The Web Vitals extension now shows you more debugging information to help you identify the root causes of Core Web Vitals issues.
Published: May 4, 2023
The Web Vitals extension provides easy access to Core Web Vitals diagnostic information to help developers measure, and address Core Web Vitals issues. It supplements the other tools provided by the Chrome team to aid developers in improving the experiences on their websites.
We have updated the extension to provide additional debug information to developers to make it easier to understand and address their performance problems.
Showing debug information in the console
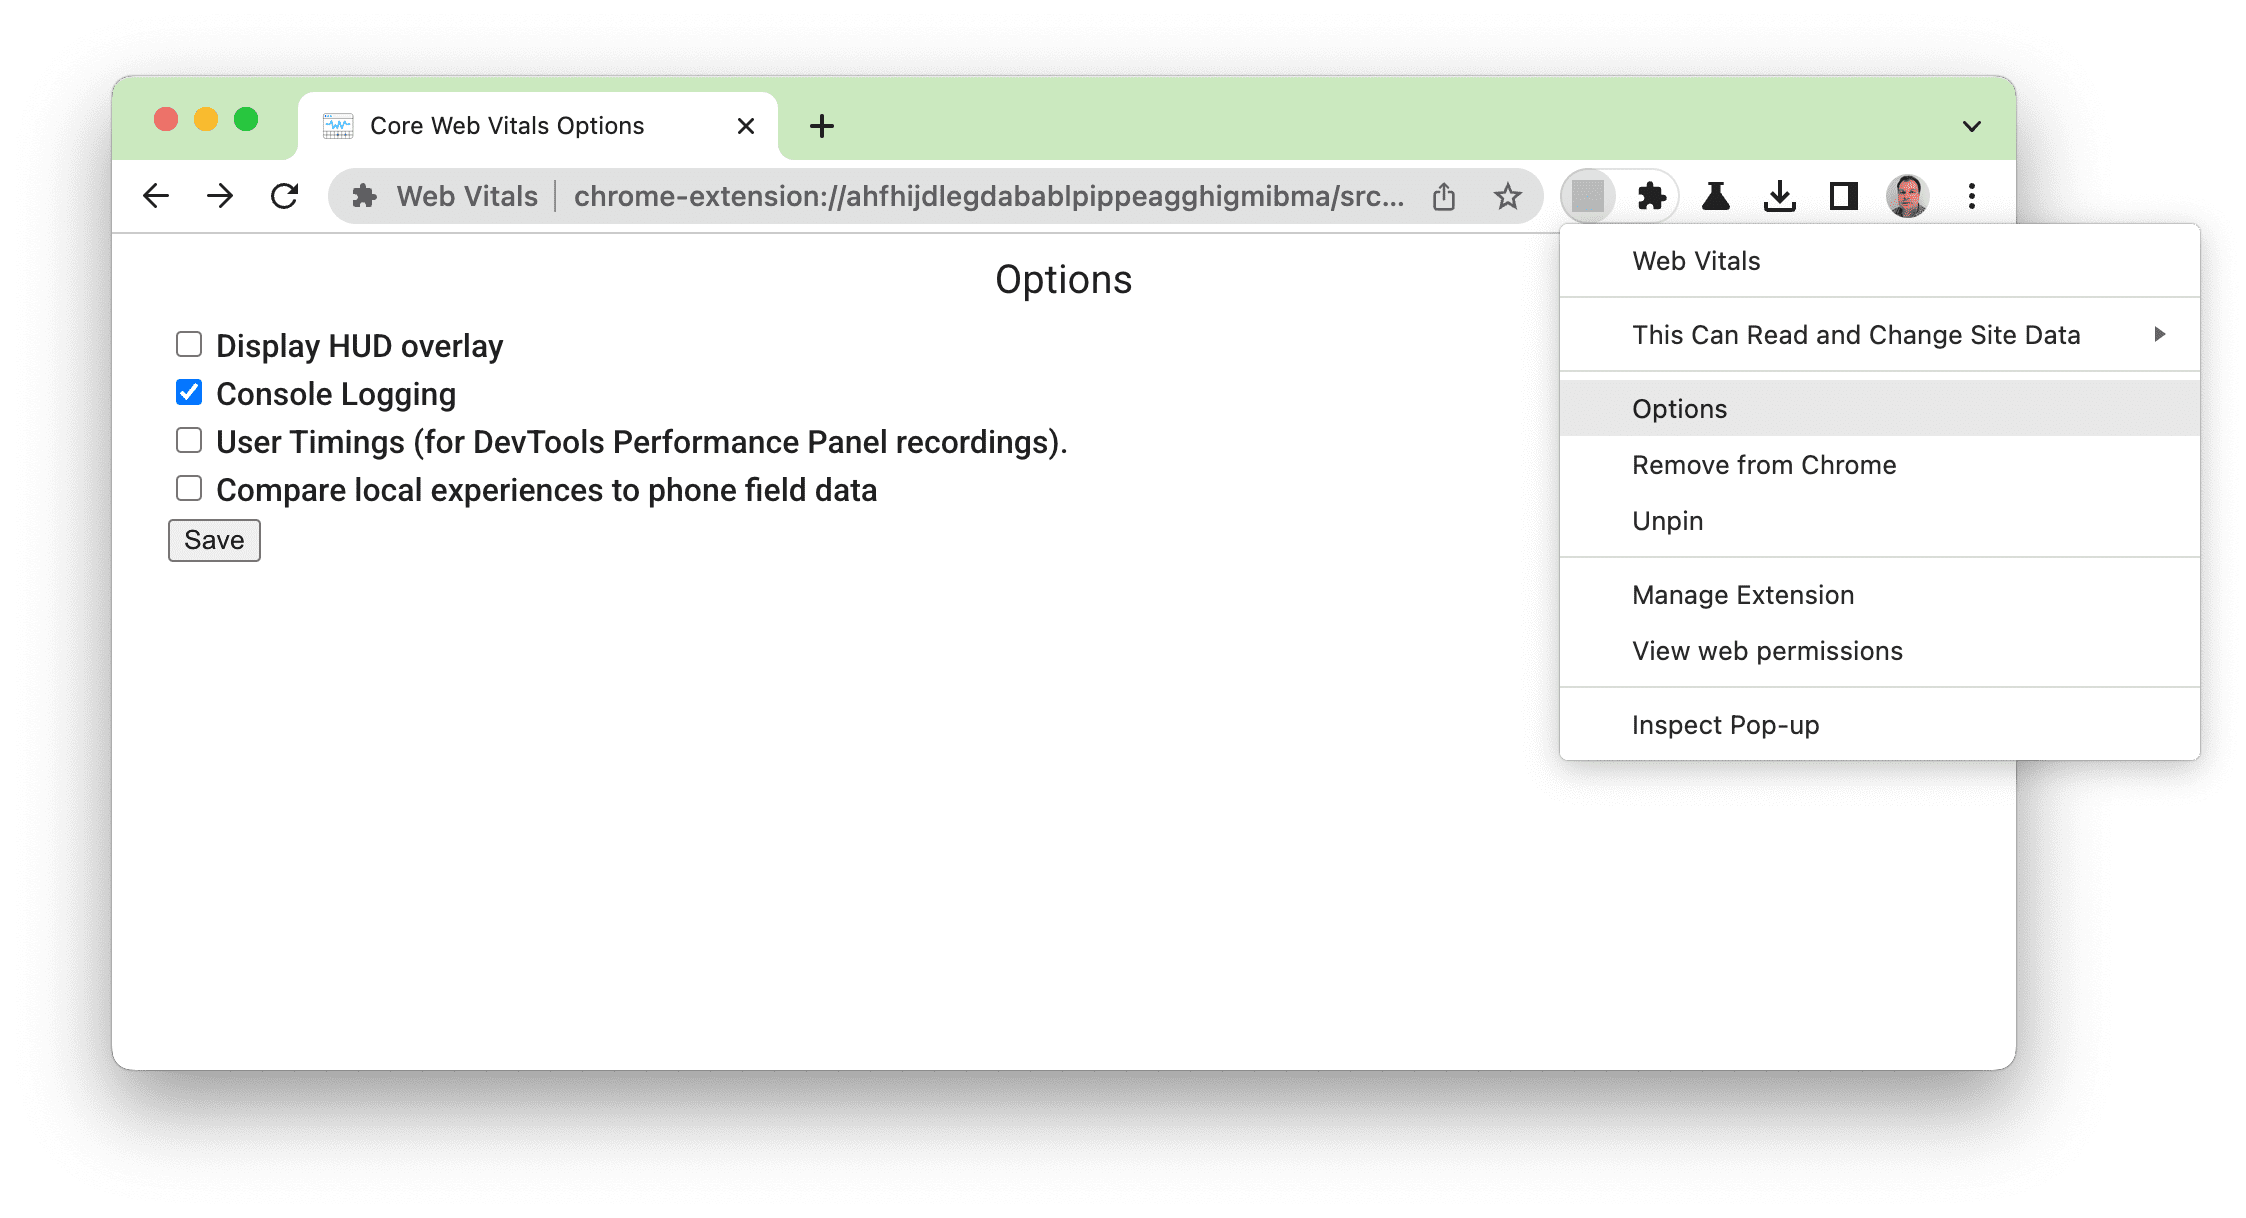
The Web Vitals extension has had a "Console Logging" debug option for some time now. It can be enabled in the Options screen:
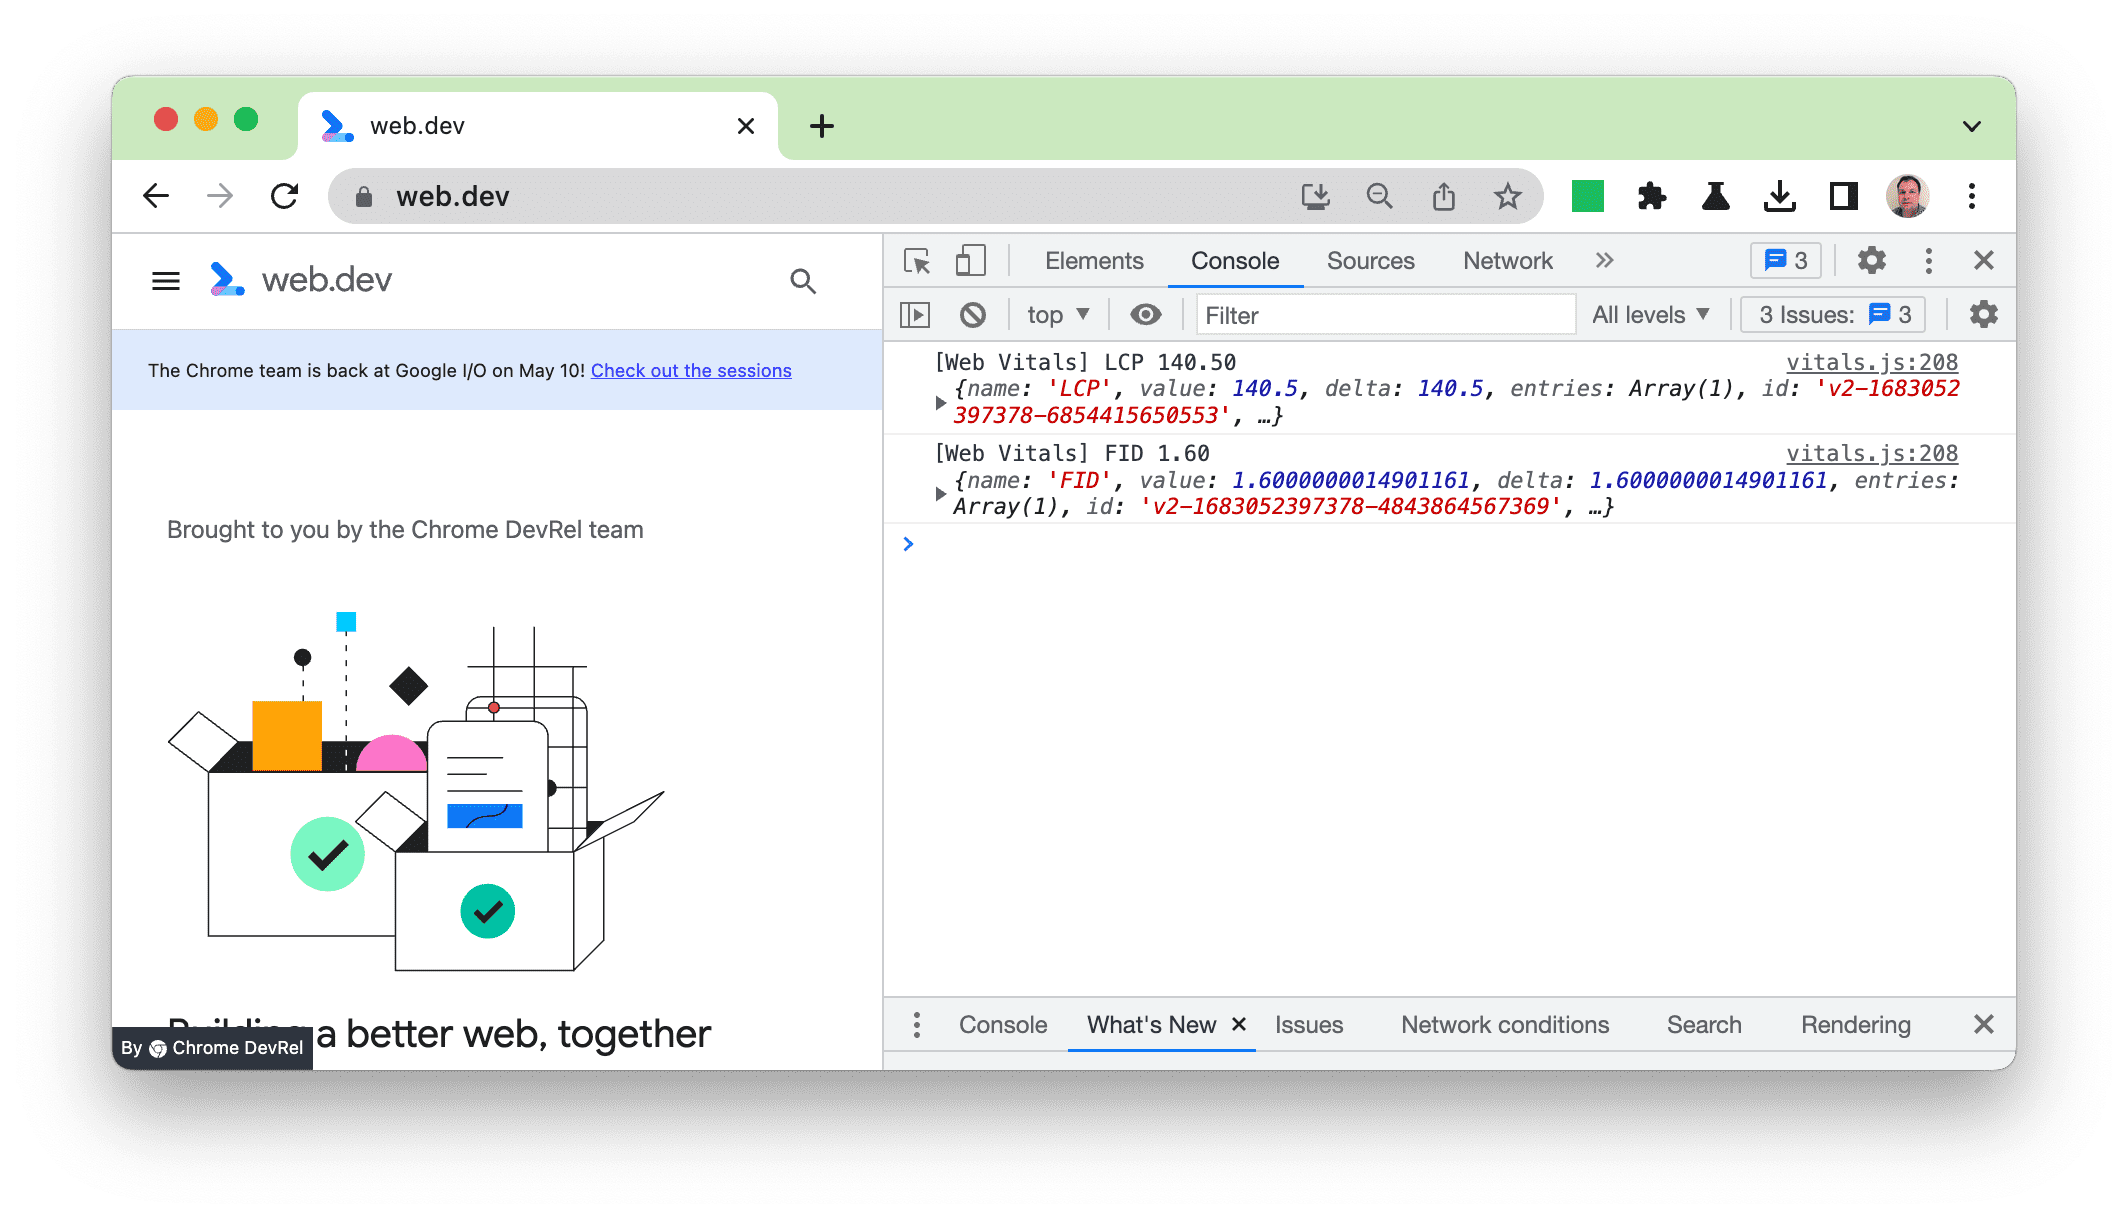
Prior to the this last upgrade, this logged the outputs from the web-vitals library (that underpins the extension) in a JSON object:
This object could then be expanded to get the full details, and elements such as the LCP image, could be hovered over to highlight them in the main panel:
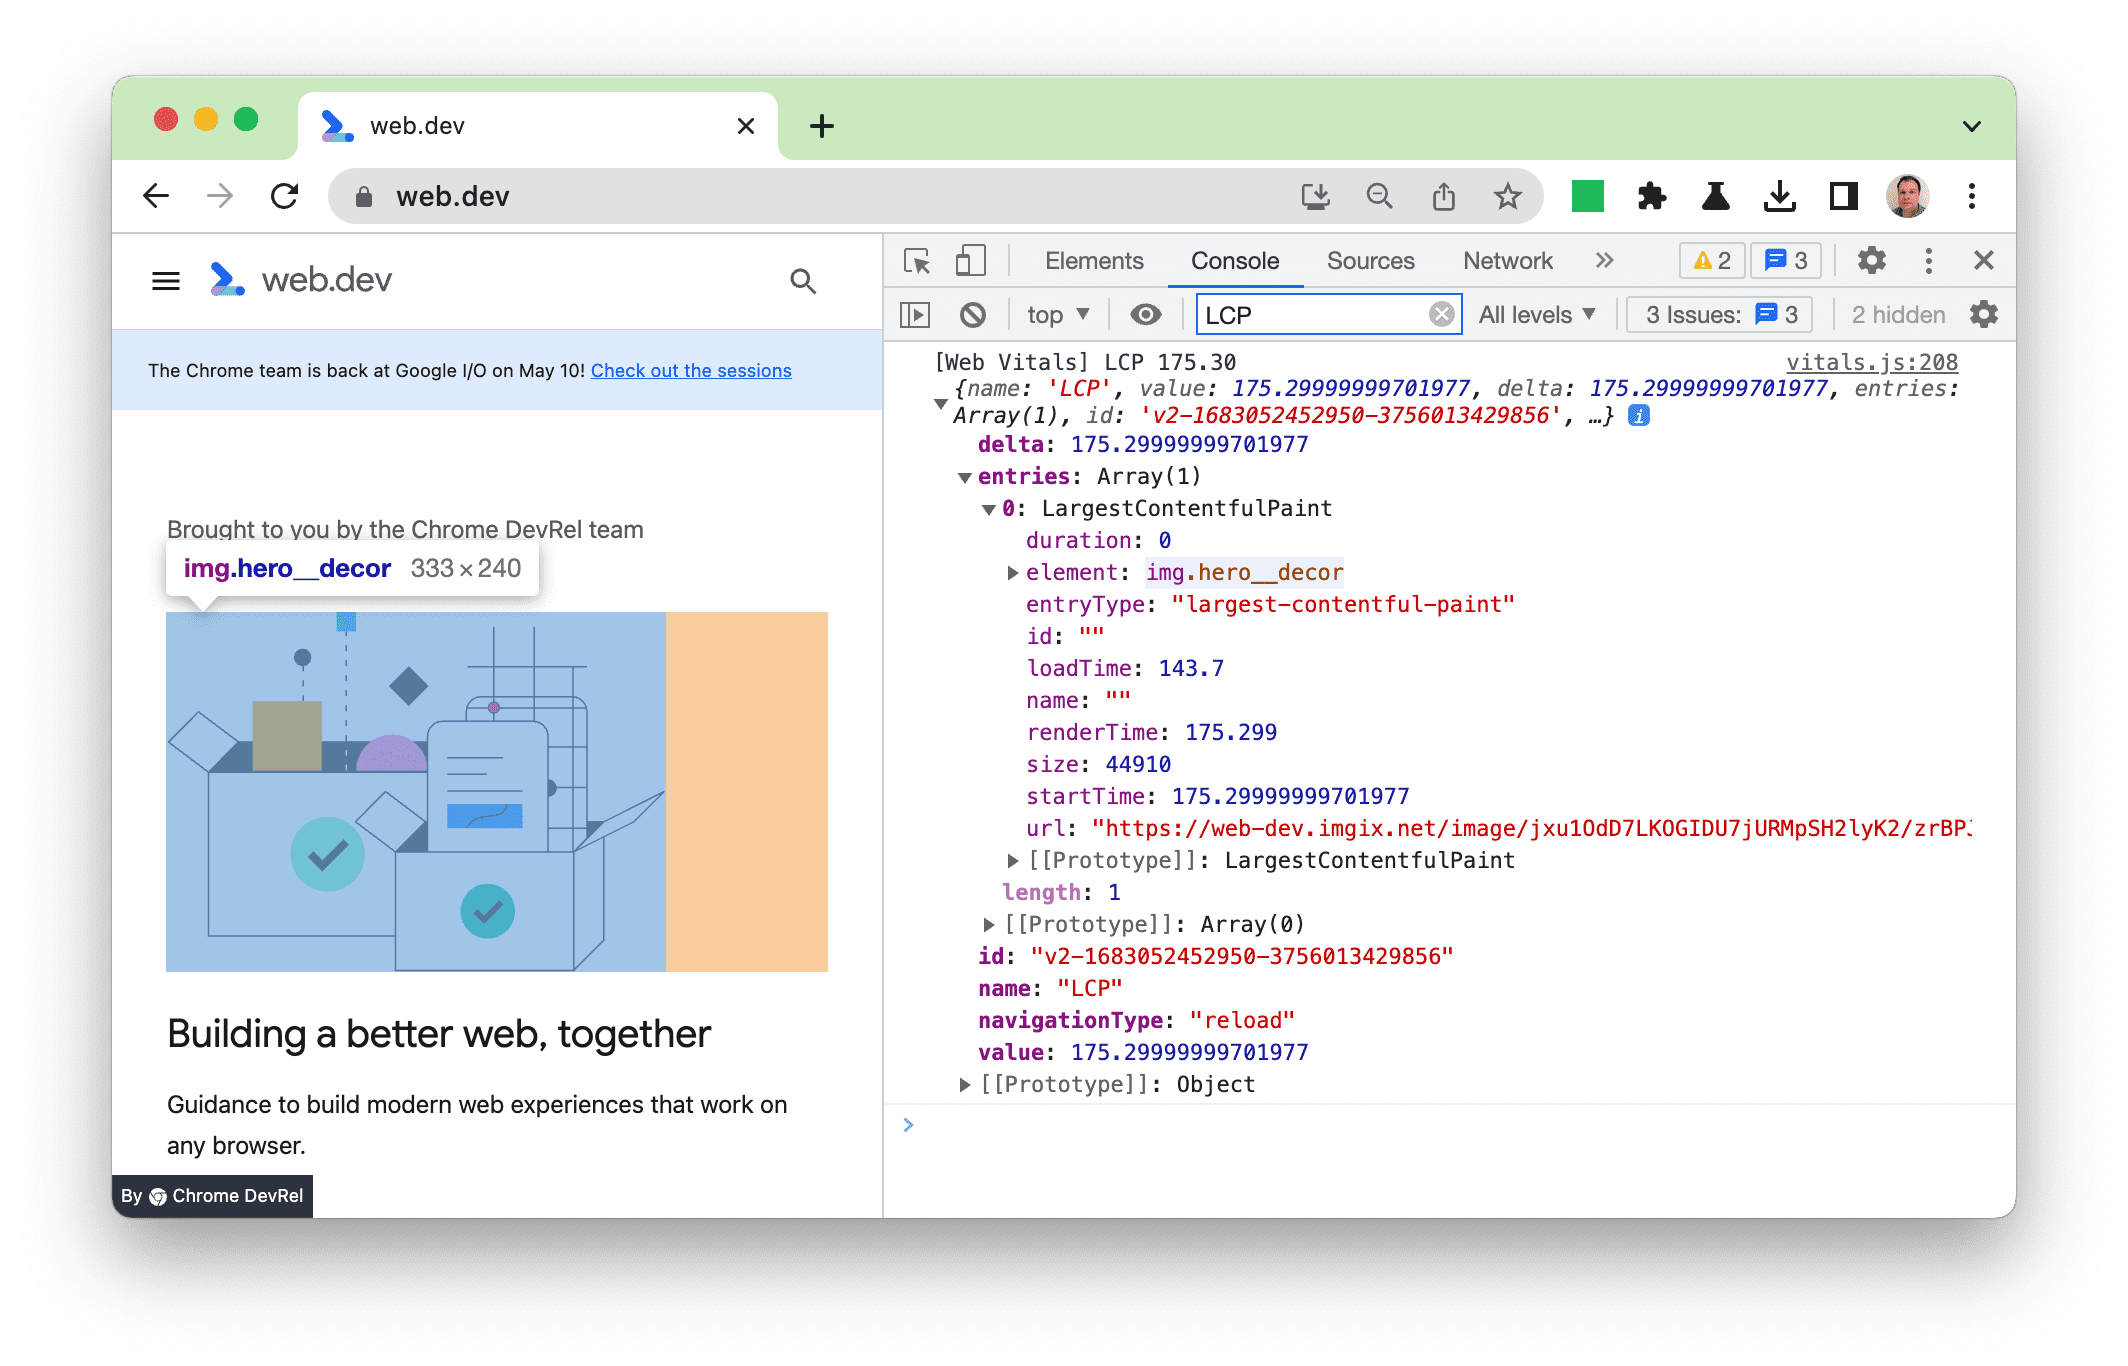
This was helpful, but the output format was not particularly user friendly, and we thought we could provide a better developer experience. So we have improved the extension to make the most important information more visible—while still including the full object for those wanting more details.
New debug information for each metric
With the new release, we have added new debug information in a more readable format to help you find and address issues. Different information is provided for each of the metrics, as each one is different.
LCP debug information
For Largest Contentful Paint (LCP), we show both the element, and the breakdown of the 4 phases detailed in our Optimize LCP guide:
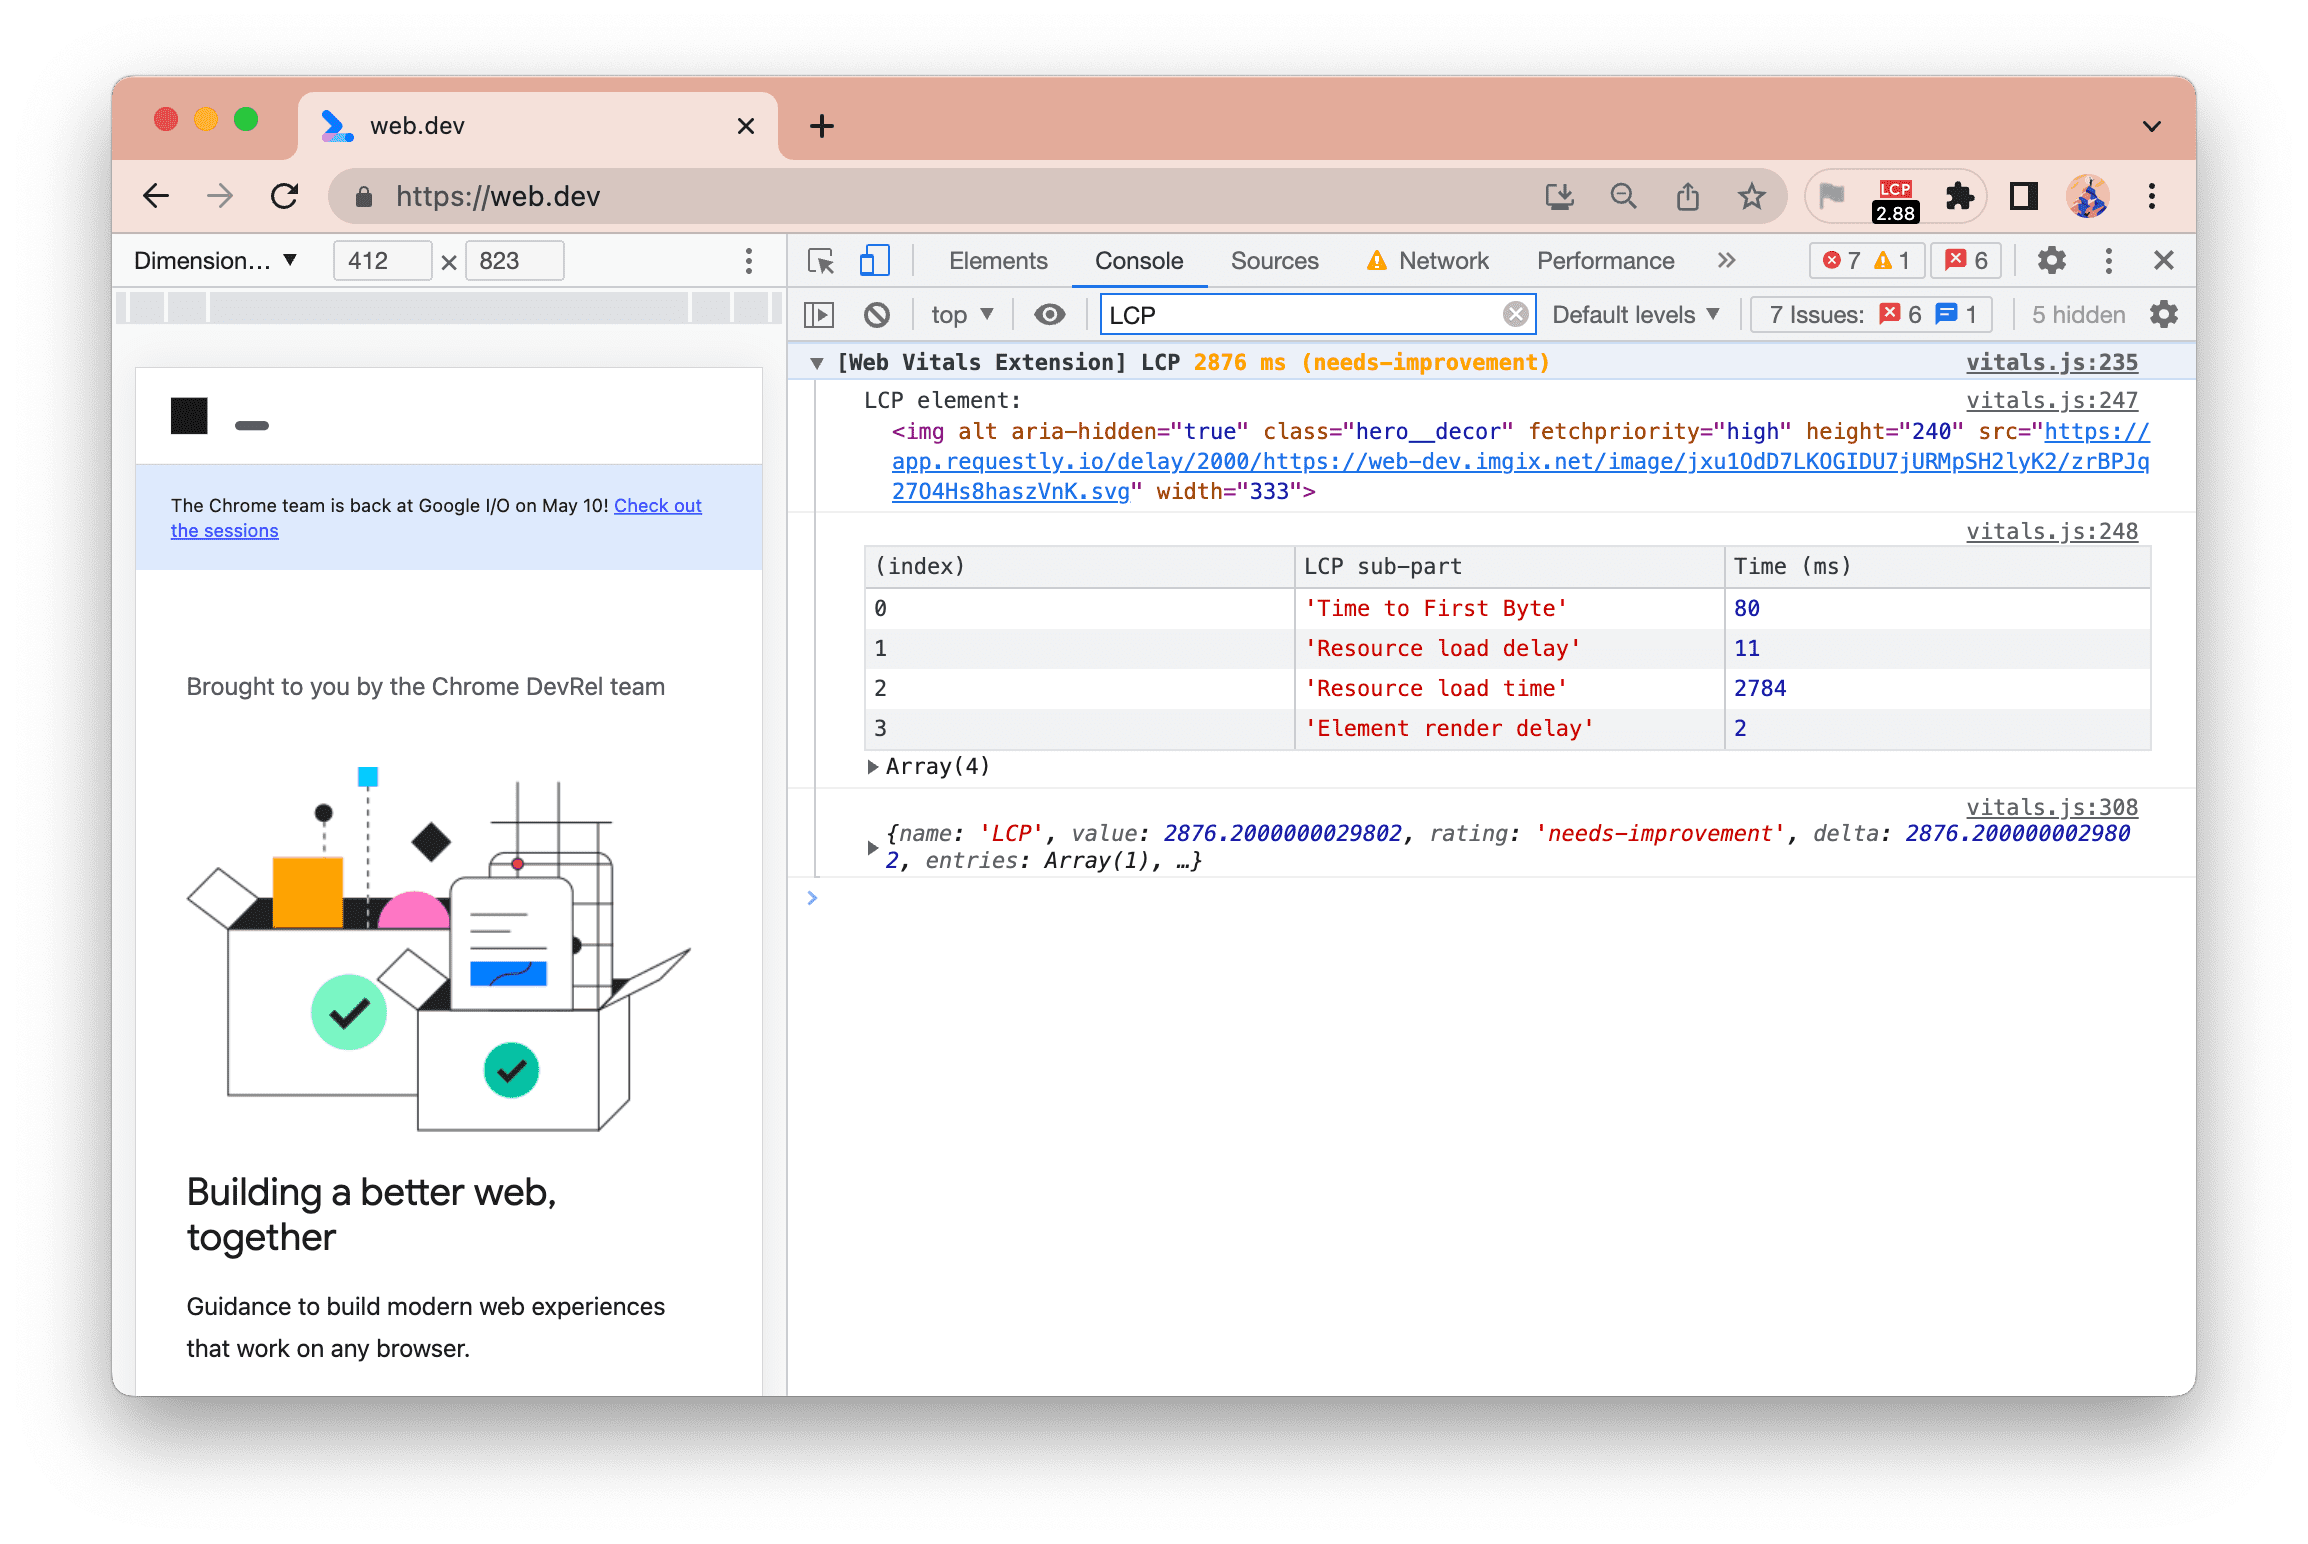
The LCP time (2,876 milliseconds—or about 2.9 seconds) is highlighted in amber as it is in the "Needs Improvement" category.
In this example, we see the Resource load time is the longest time, so to improve your LCP time you would look to optimize that - perhaps by avoiding hosting them on a separate domain, or by using smaller images or more efficient formats. In this case it's due to being artificially slowed down to demonstrate the output—web.dev is a fast site 😀
The element can also be hovered over to highlight the image:
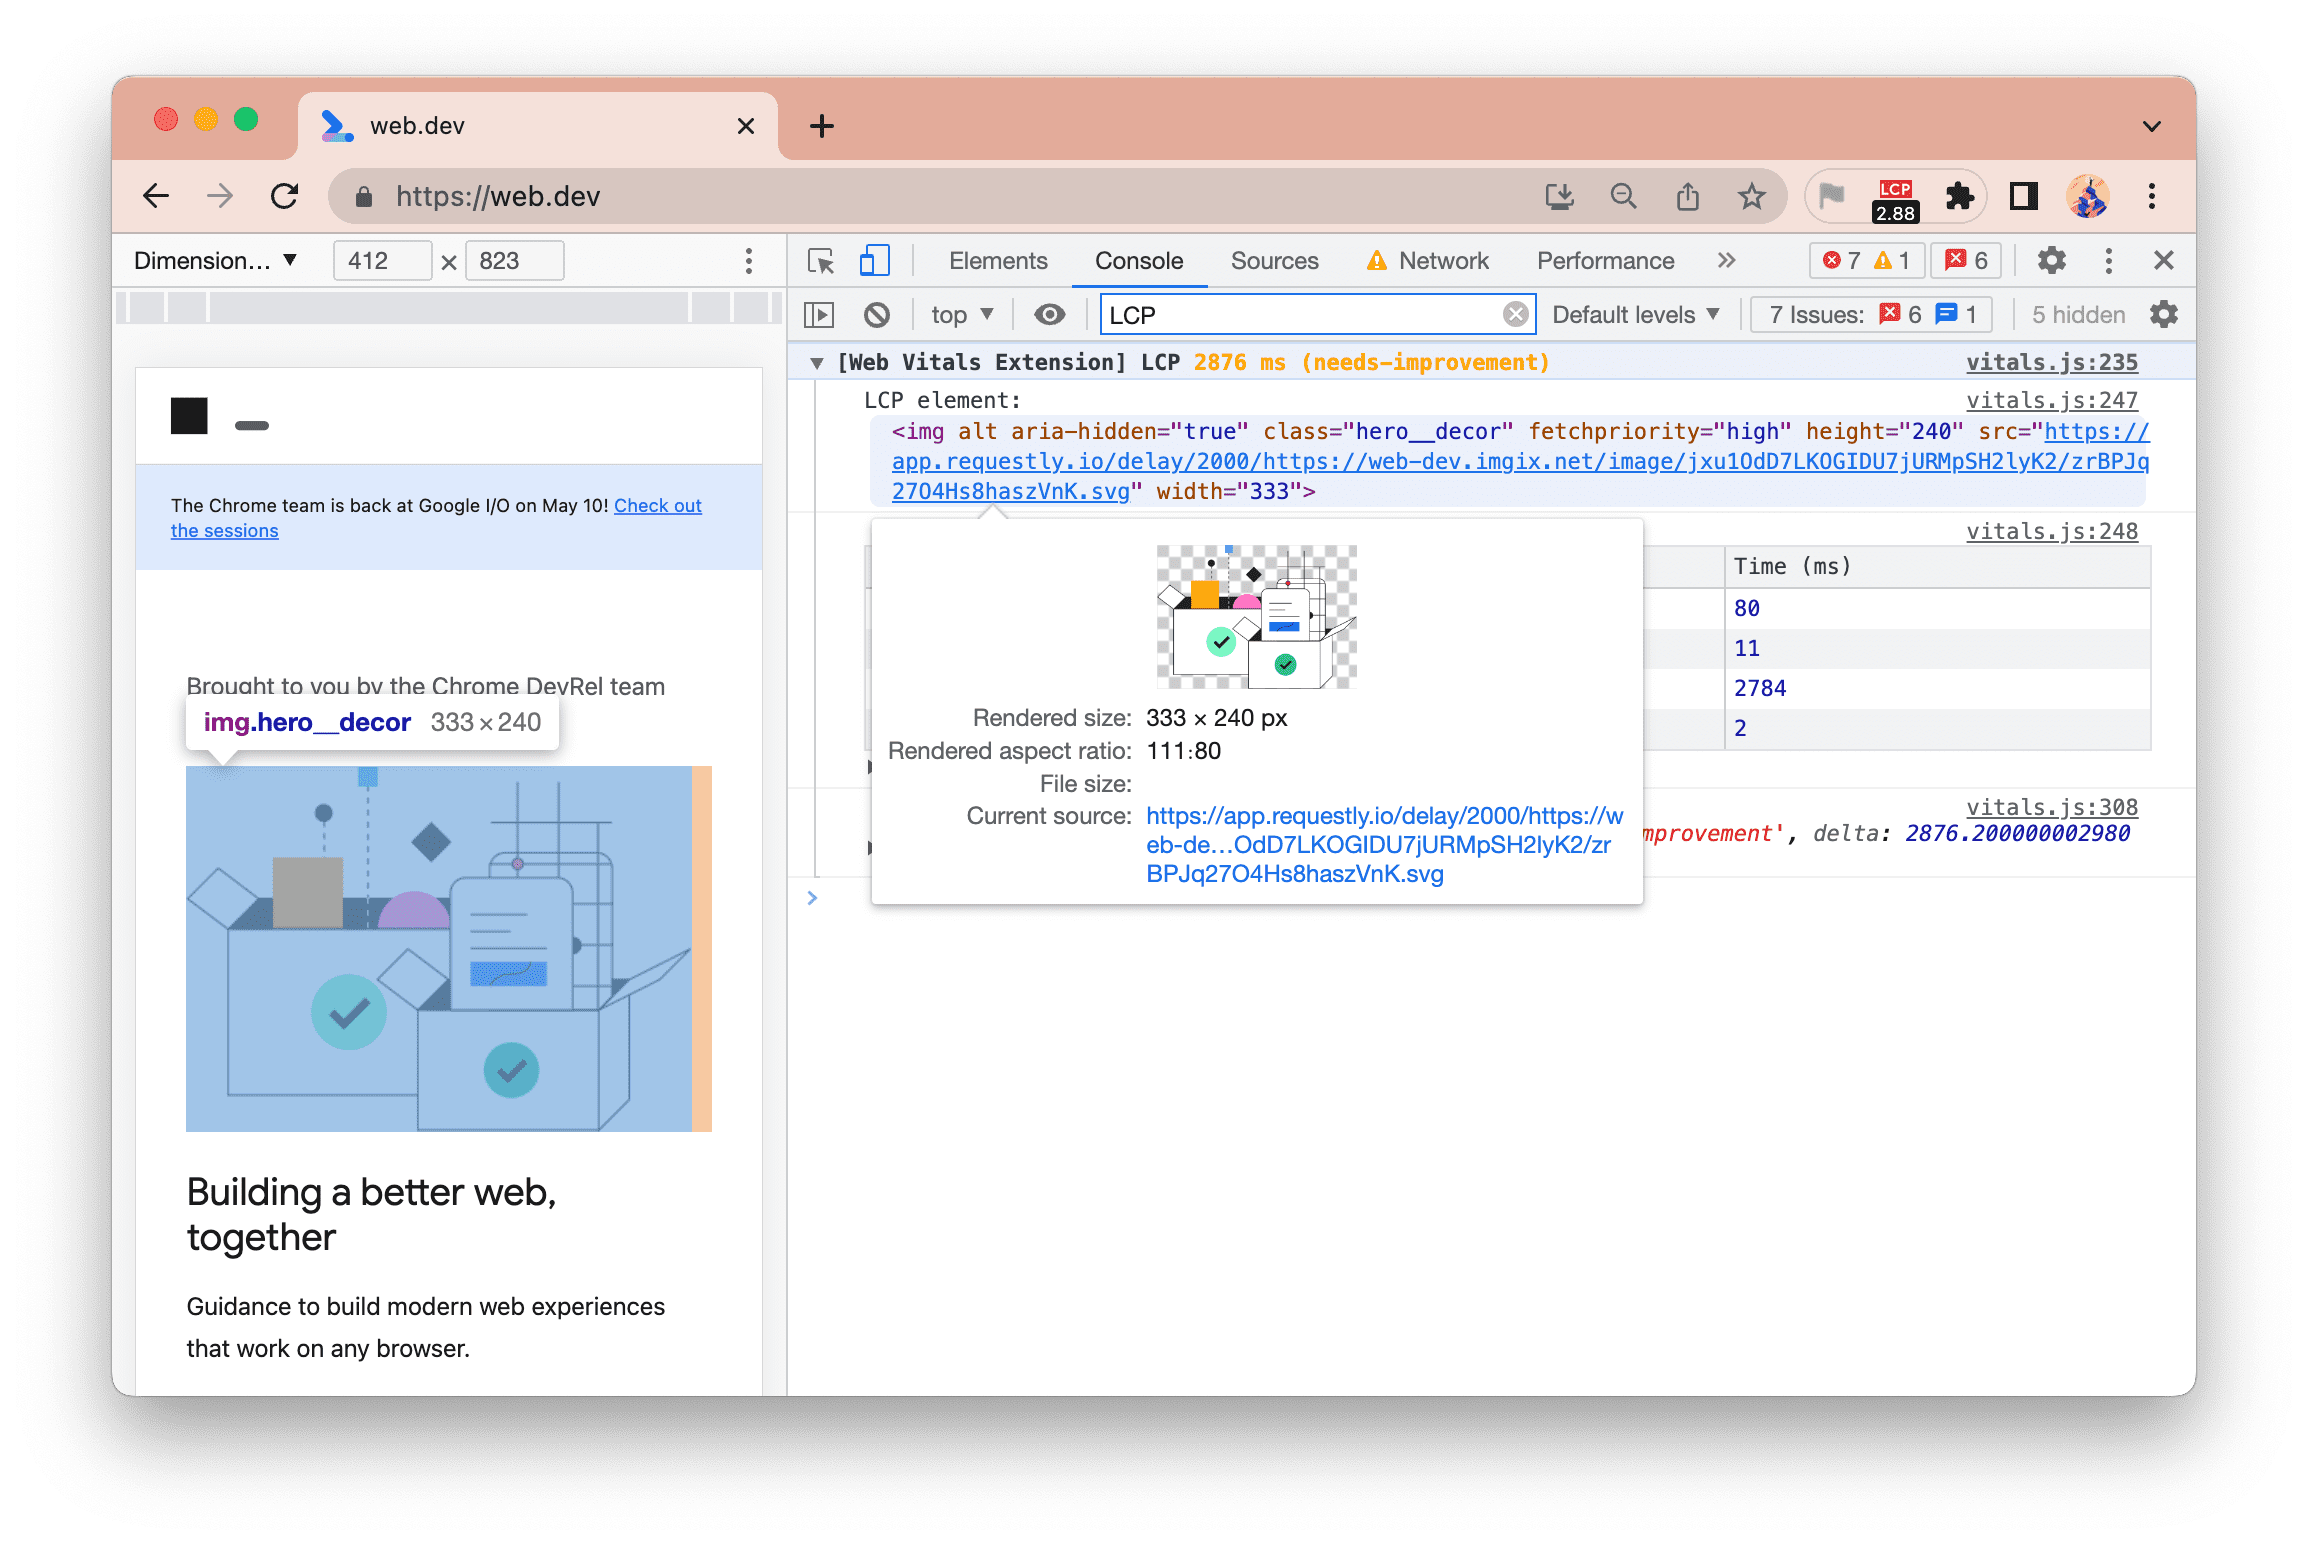
Right clicking on the element also allows you to reveal it in the elements panel.
Here the LCP element is an image, and hovering over that in the console on the right, also highlights that element on the site on the left.
CLS debug information
Shifts contributing to Cumulative Layout Shift (CLS) are now also listed, and can be hovered over to highlight the relevant element:
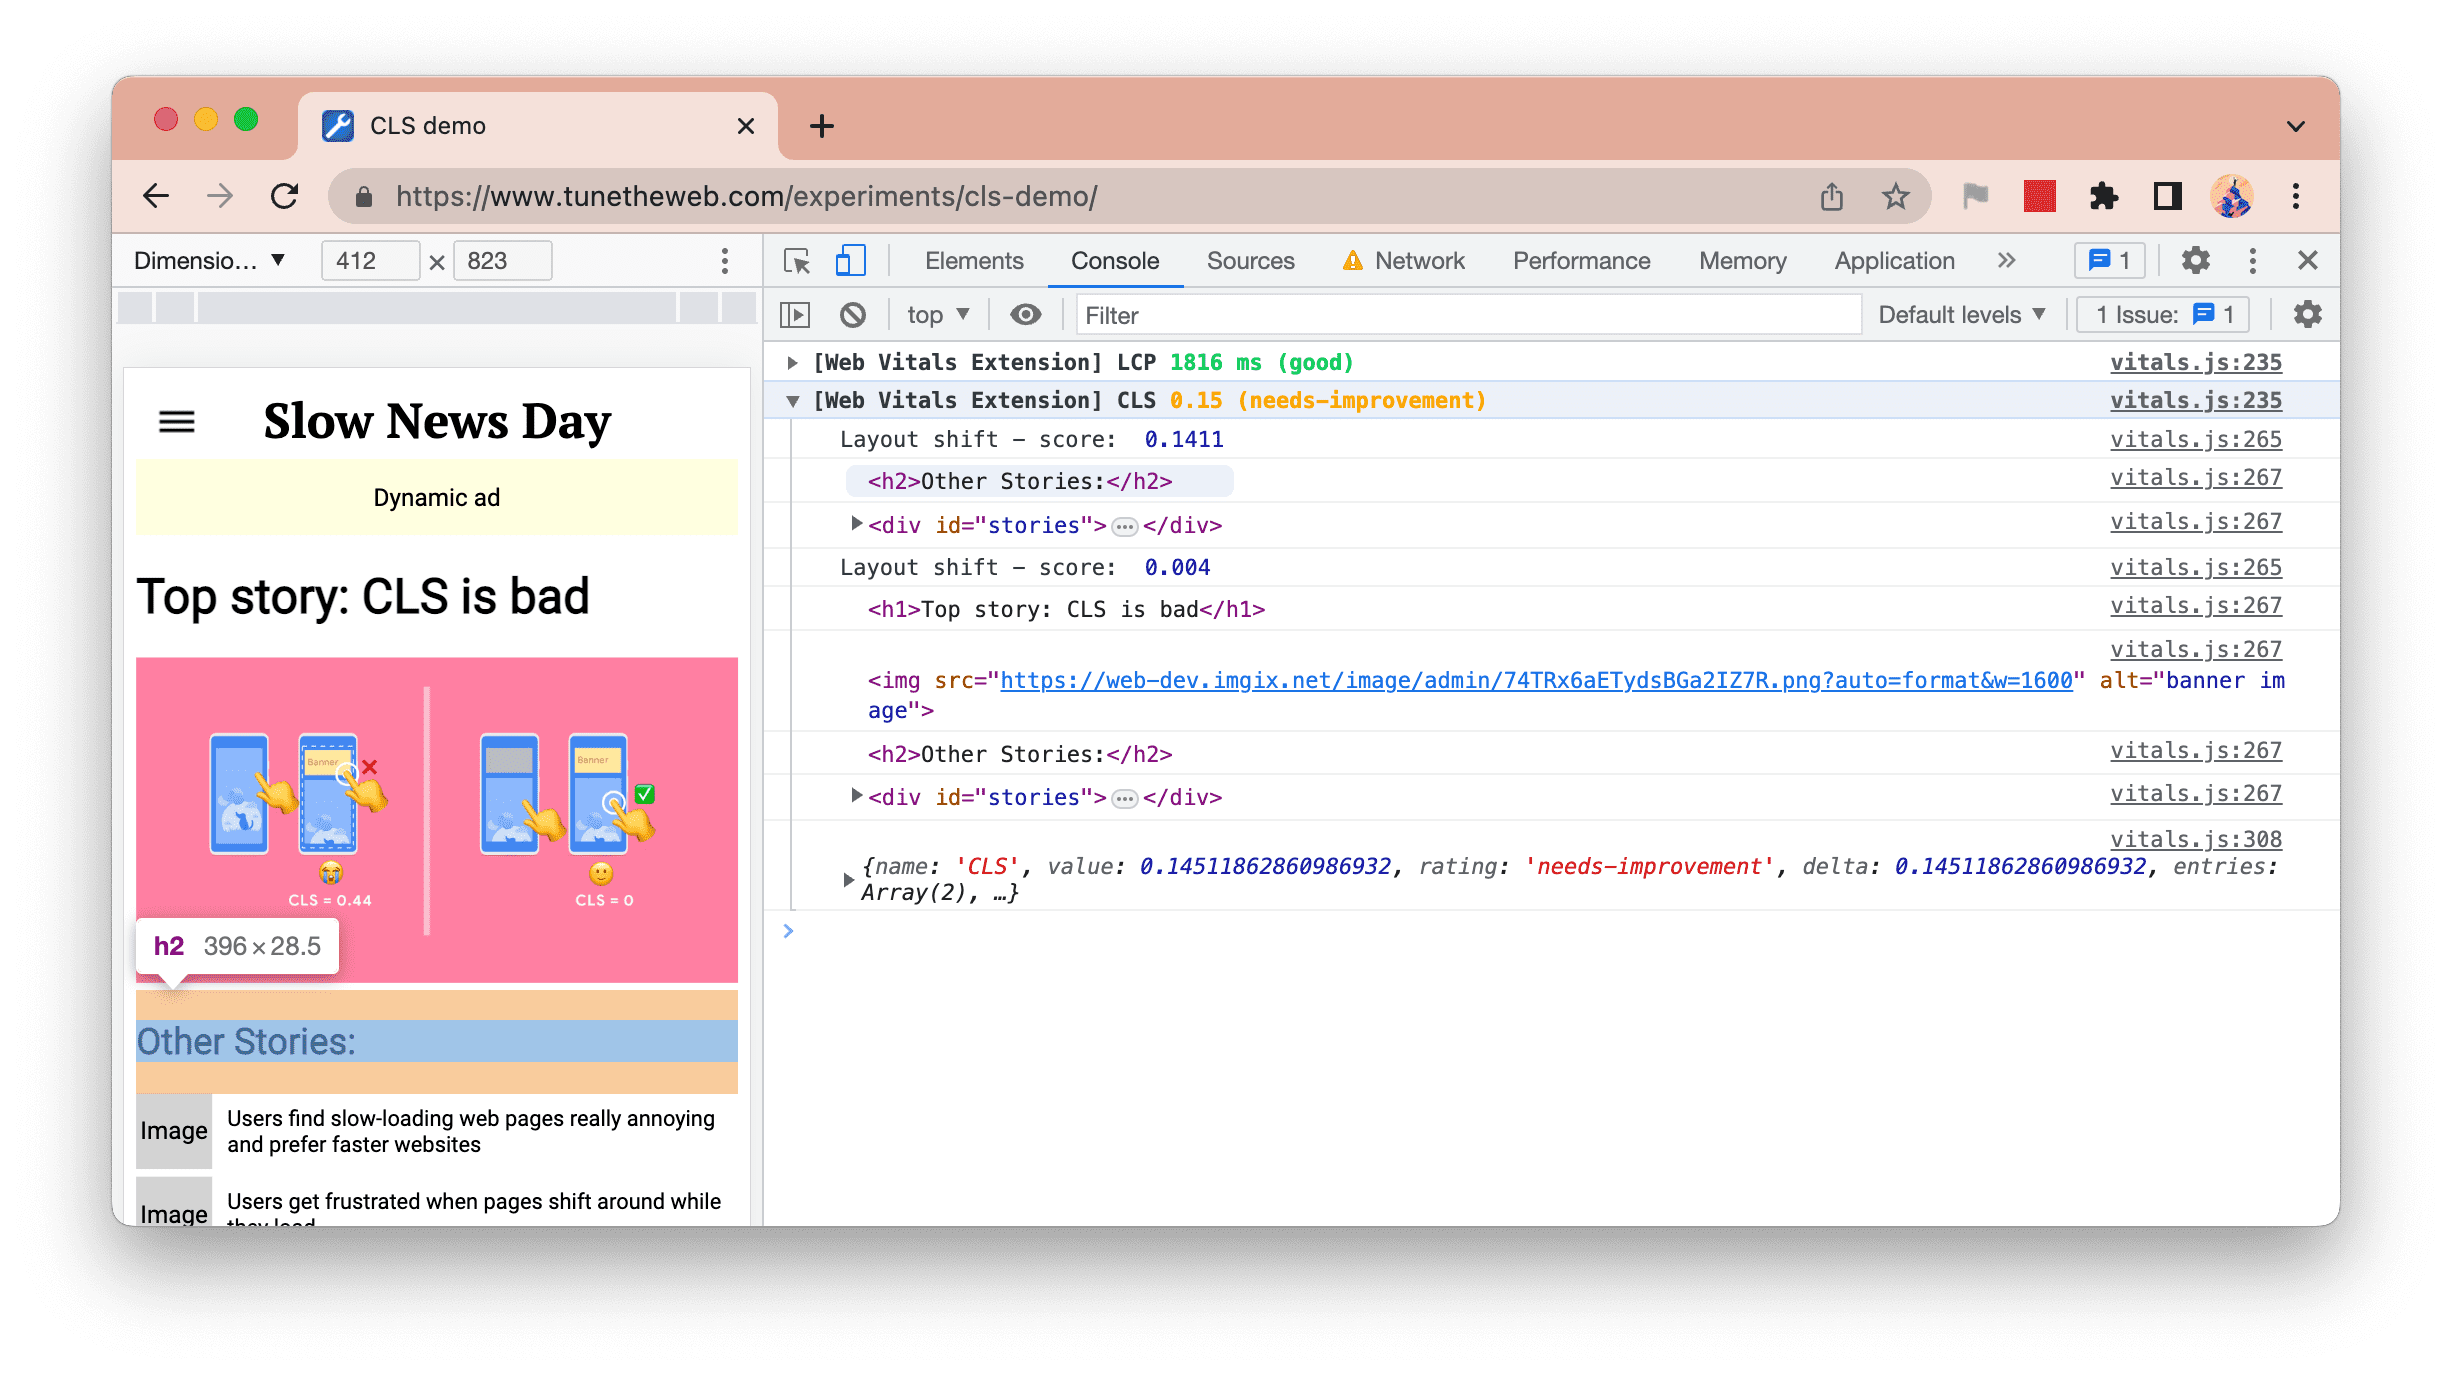
The above screenshot shows 2 shifts, the first made up of two elements (when the banner image is loaded and the content beneath it is shifted downloaded), and the second of 4 elements (when the dynamic ad is loaded and most of the page is shifted downwards).
The h2 element is being hovered over in this screenshot in the console on the right, and you can see this highlights the element on the site on the left.
FID debug information
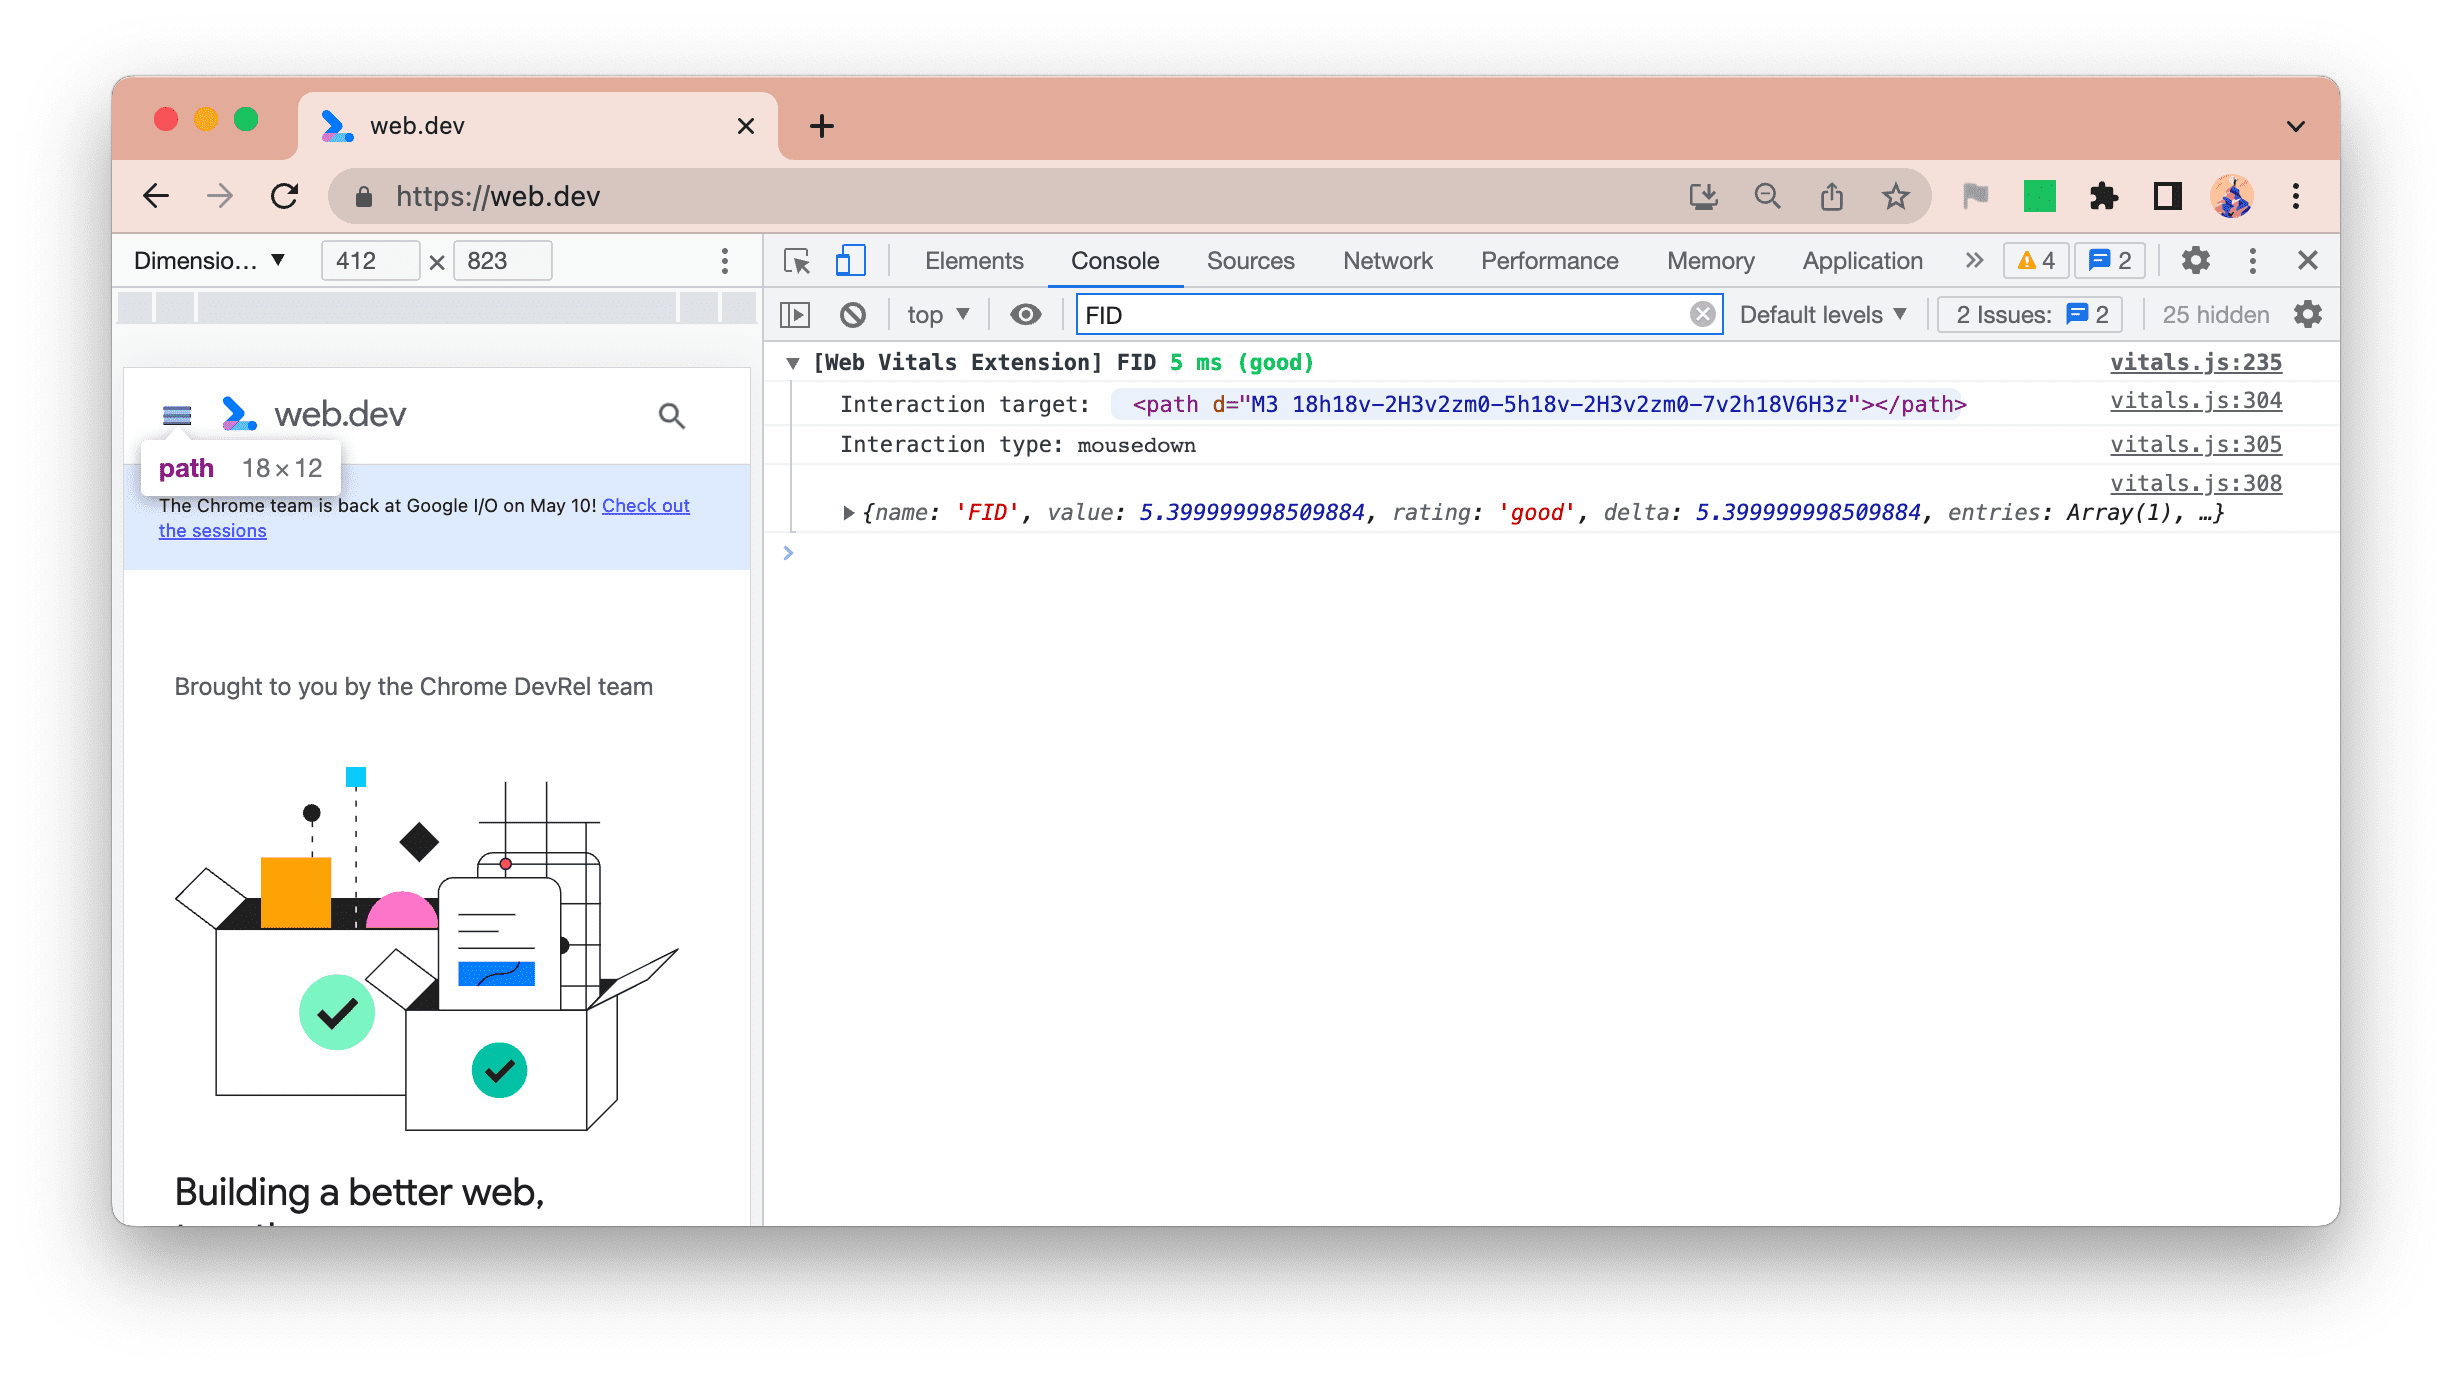
For First Input Delay (FID) we show the affected element (which again, can be hovered over to highlight it on the page) and the interaction type, along with the full JSON object as usual:
INP debug information
For Interaction to Next Paint (INP), we have added two new logs:
- INP - the longest interaction
- Interactions - all interactions
INP metric
First up, we highlight the INP metric when it changes:
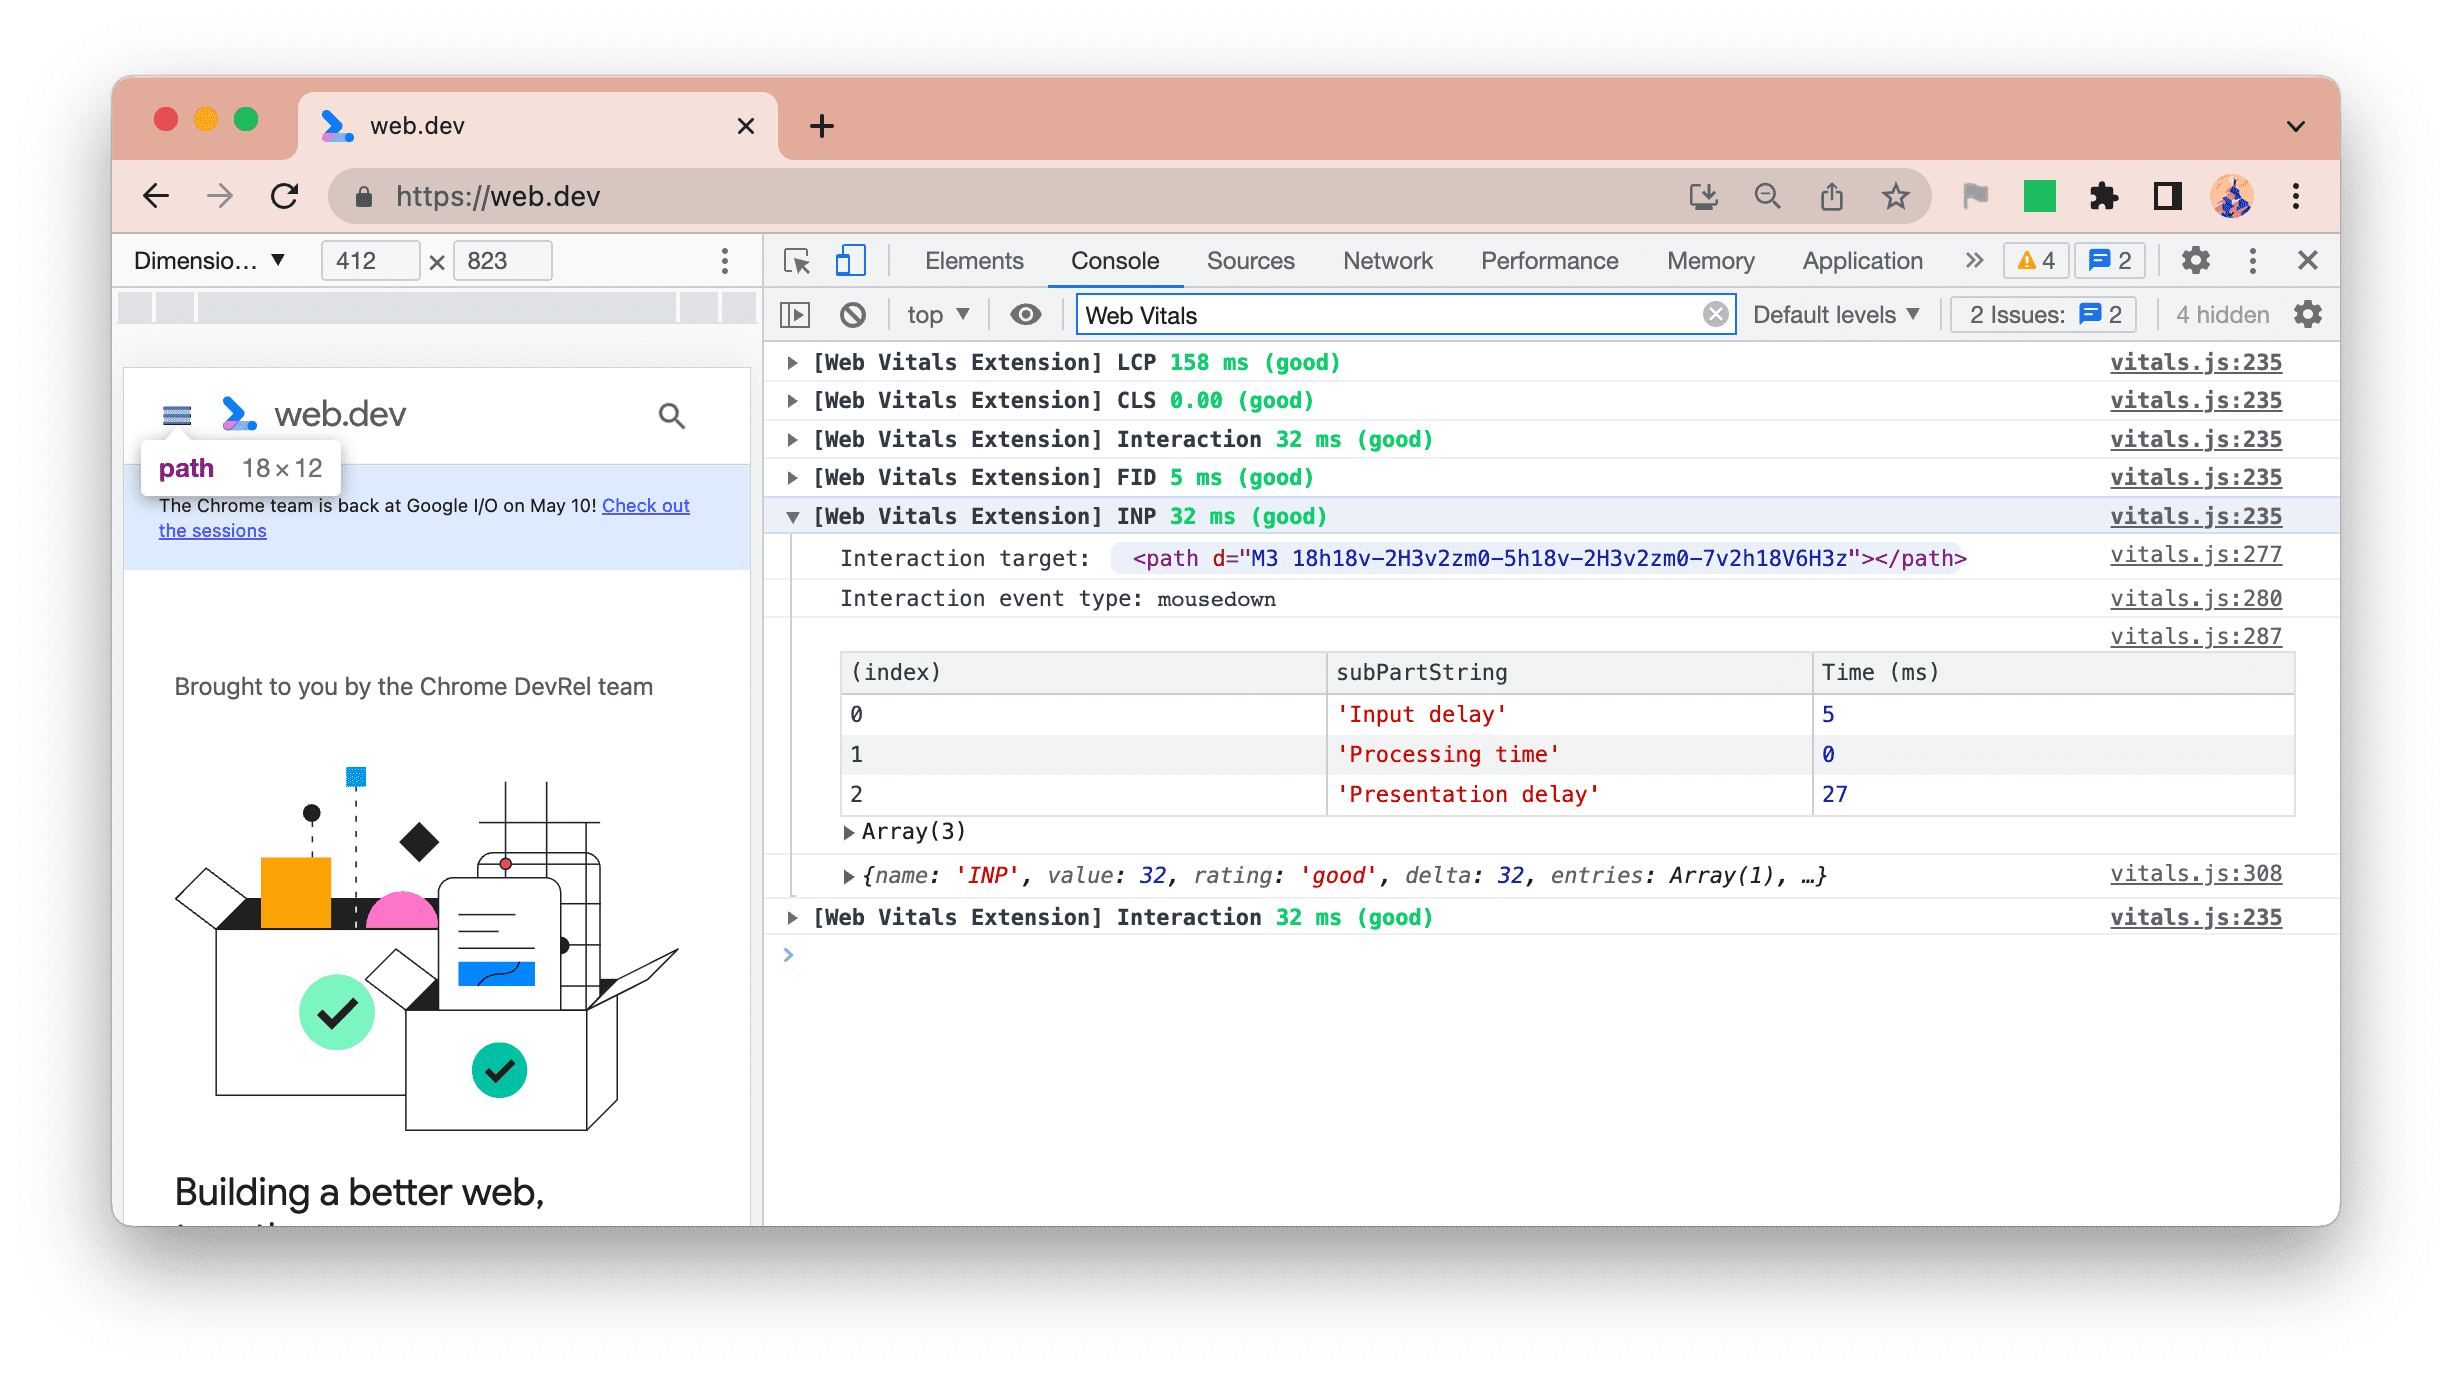
Similar to LCP, the extension breaks down the INP time to show three phases:
- Input delay
- Processing duration
- Presentation delay
This helps you identify if the event was slow due to being held up by other events (input delay), as the event handler itself was slow due to your code (processing duration), if the post-processing render delay was the reason (presentation delay), or a combination of two or more of these.
Interactions
INP can be slow due to previous interactions blocking the main thread, and thus causing a high input delay. For this reason, we list all interactions in a similar format to the INP logging:
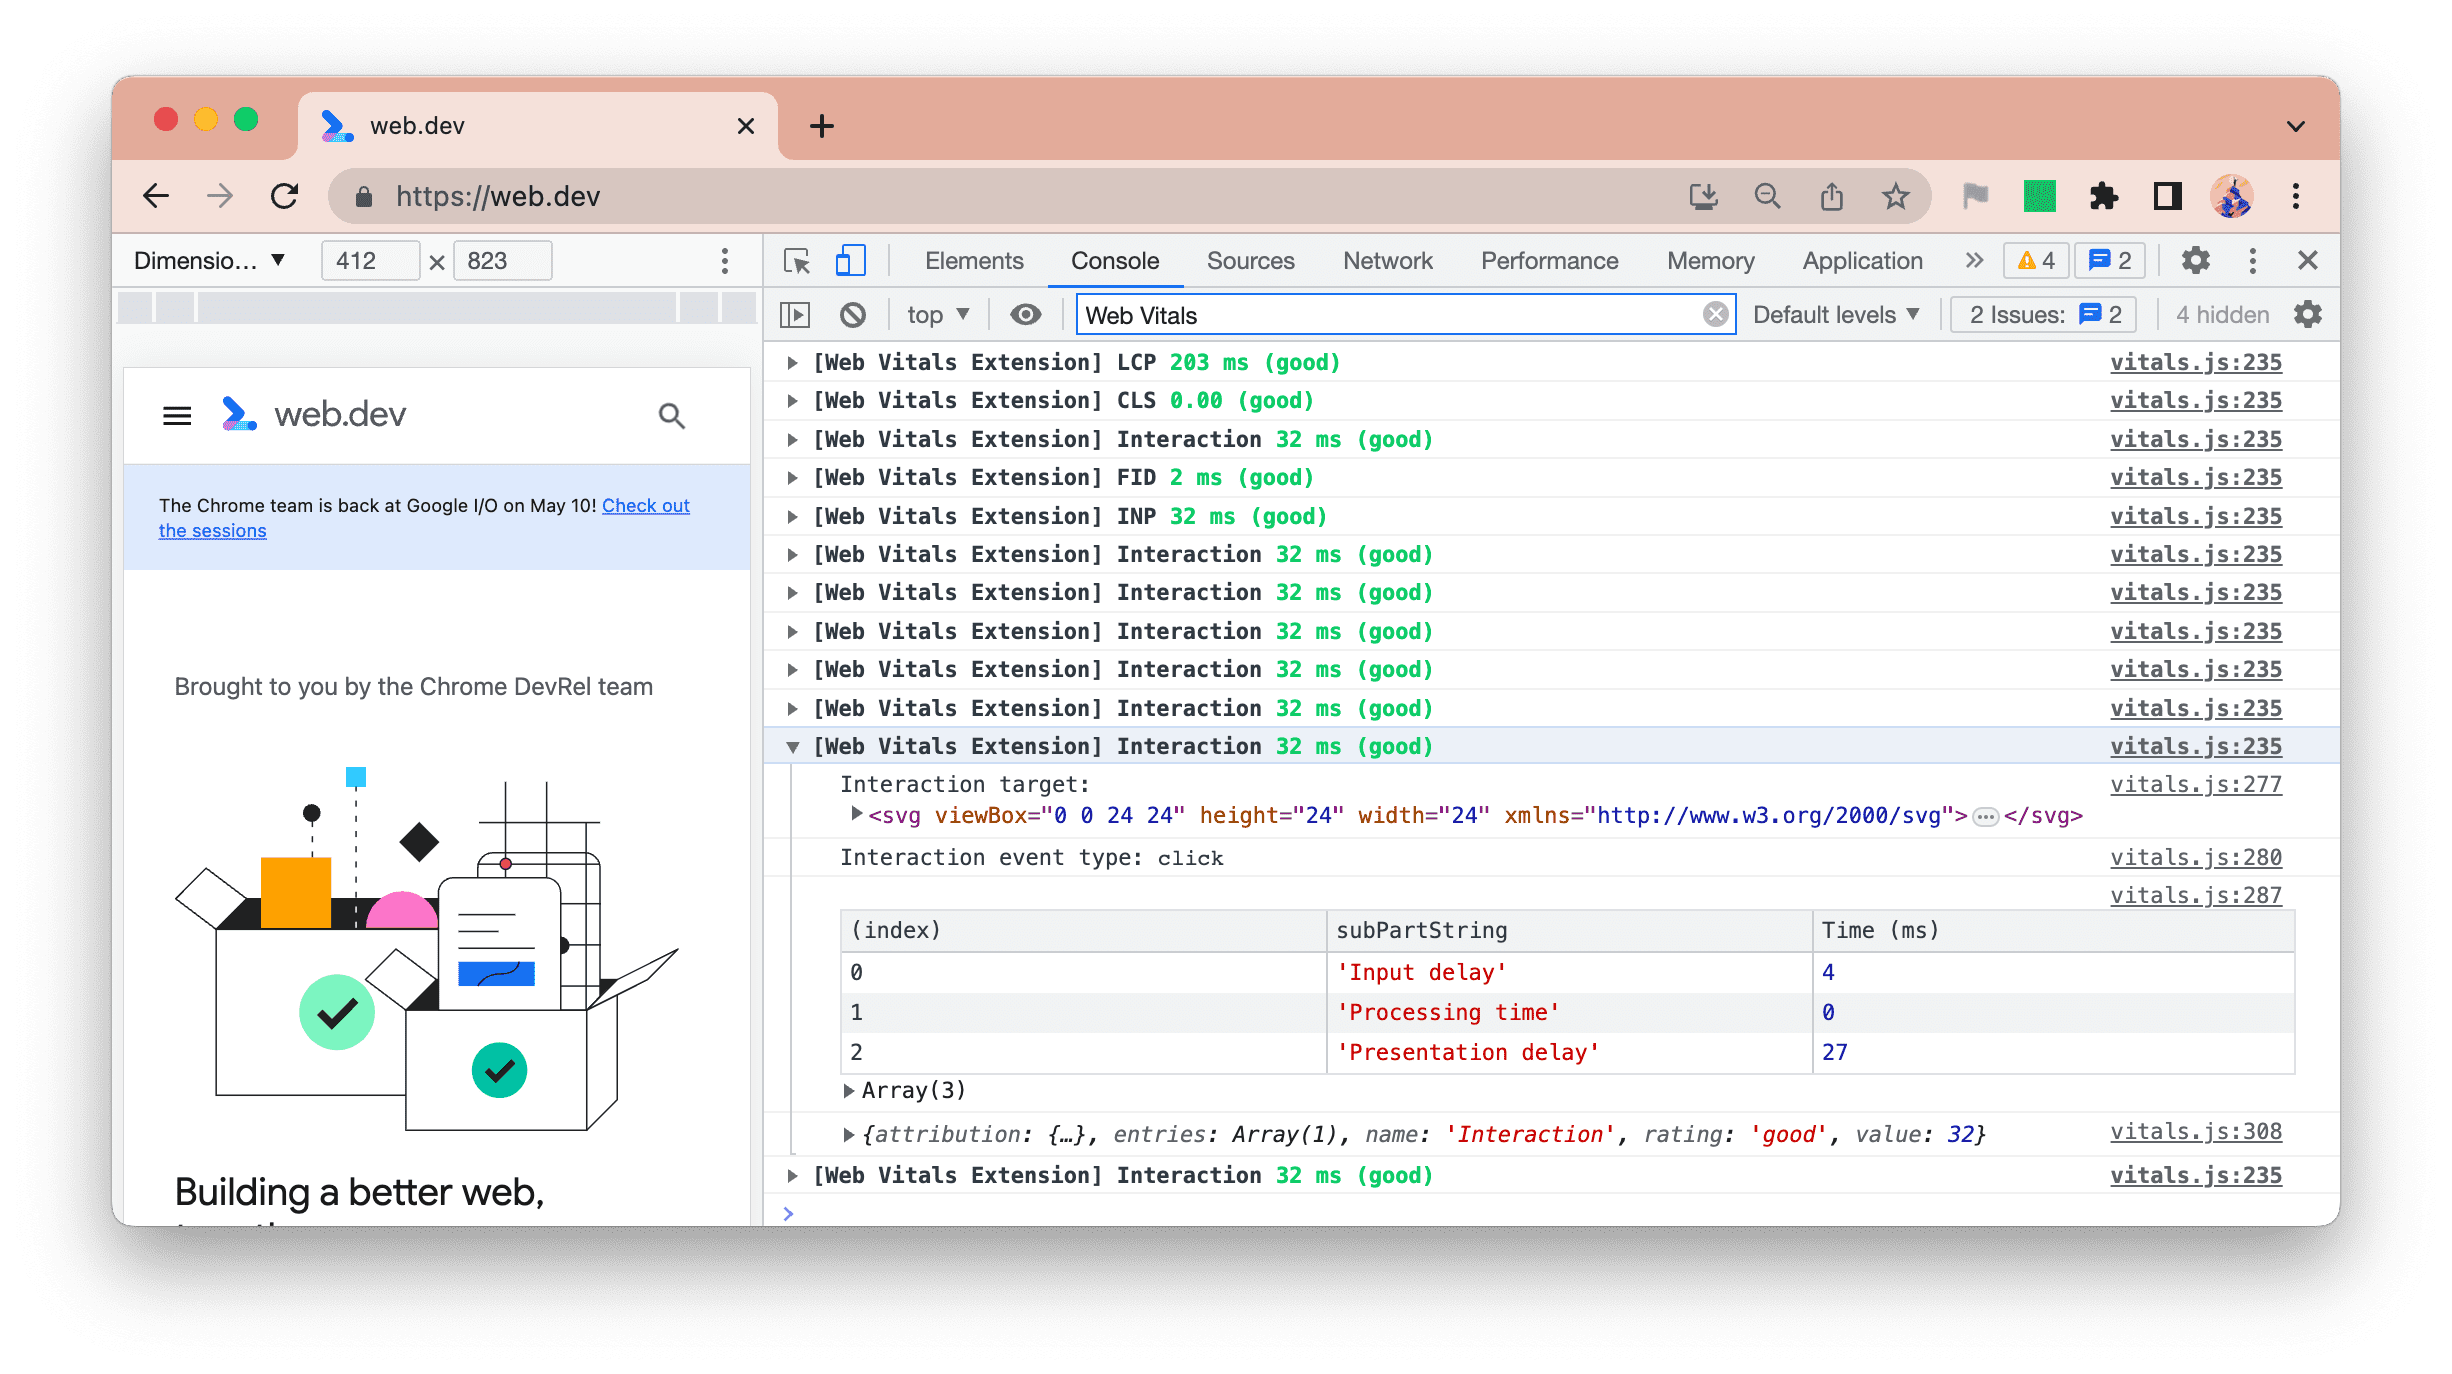
This allows you to "live trace" a website by interacting with it and seeing in the console which interactions, in which combinations, are likely to cause an INP problem.
This also allows you to identify multiple slow interactions, rather than just the largest INP interaction to help you avoid the feeling of chasing your tail when improving your responsiveness.
Filtering the console logs
All this extra information, while useful, can be distracting if you are doing other development unrelated to Core Web Vitals, or are only interested in one particular Core Web Vital at that time.
You can use the Console filtering options in DevTools to filter out some or all of the messages:
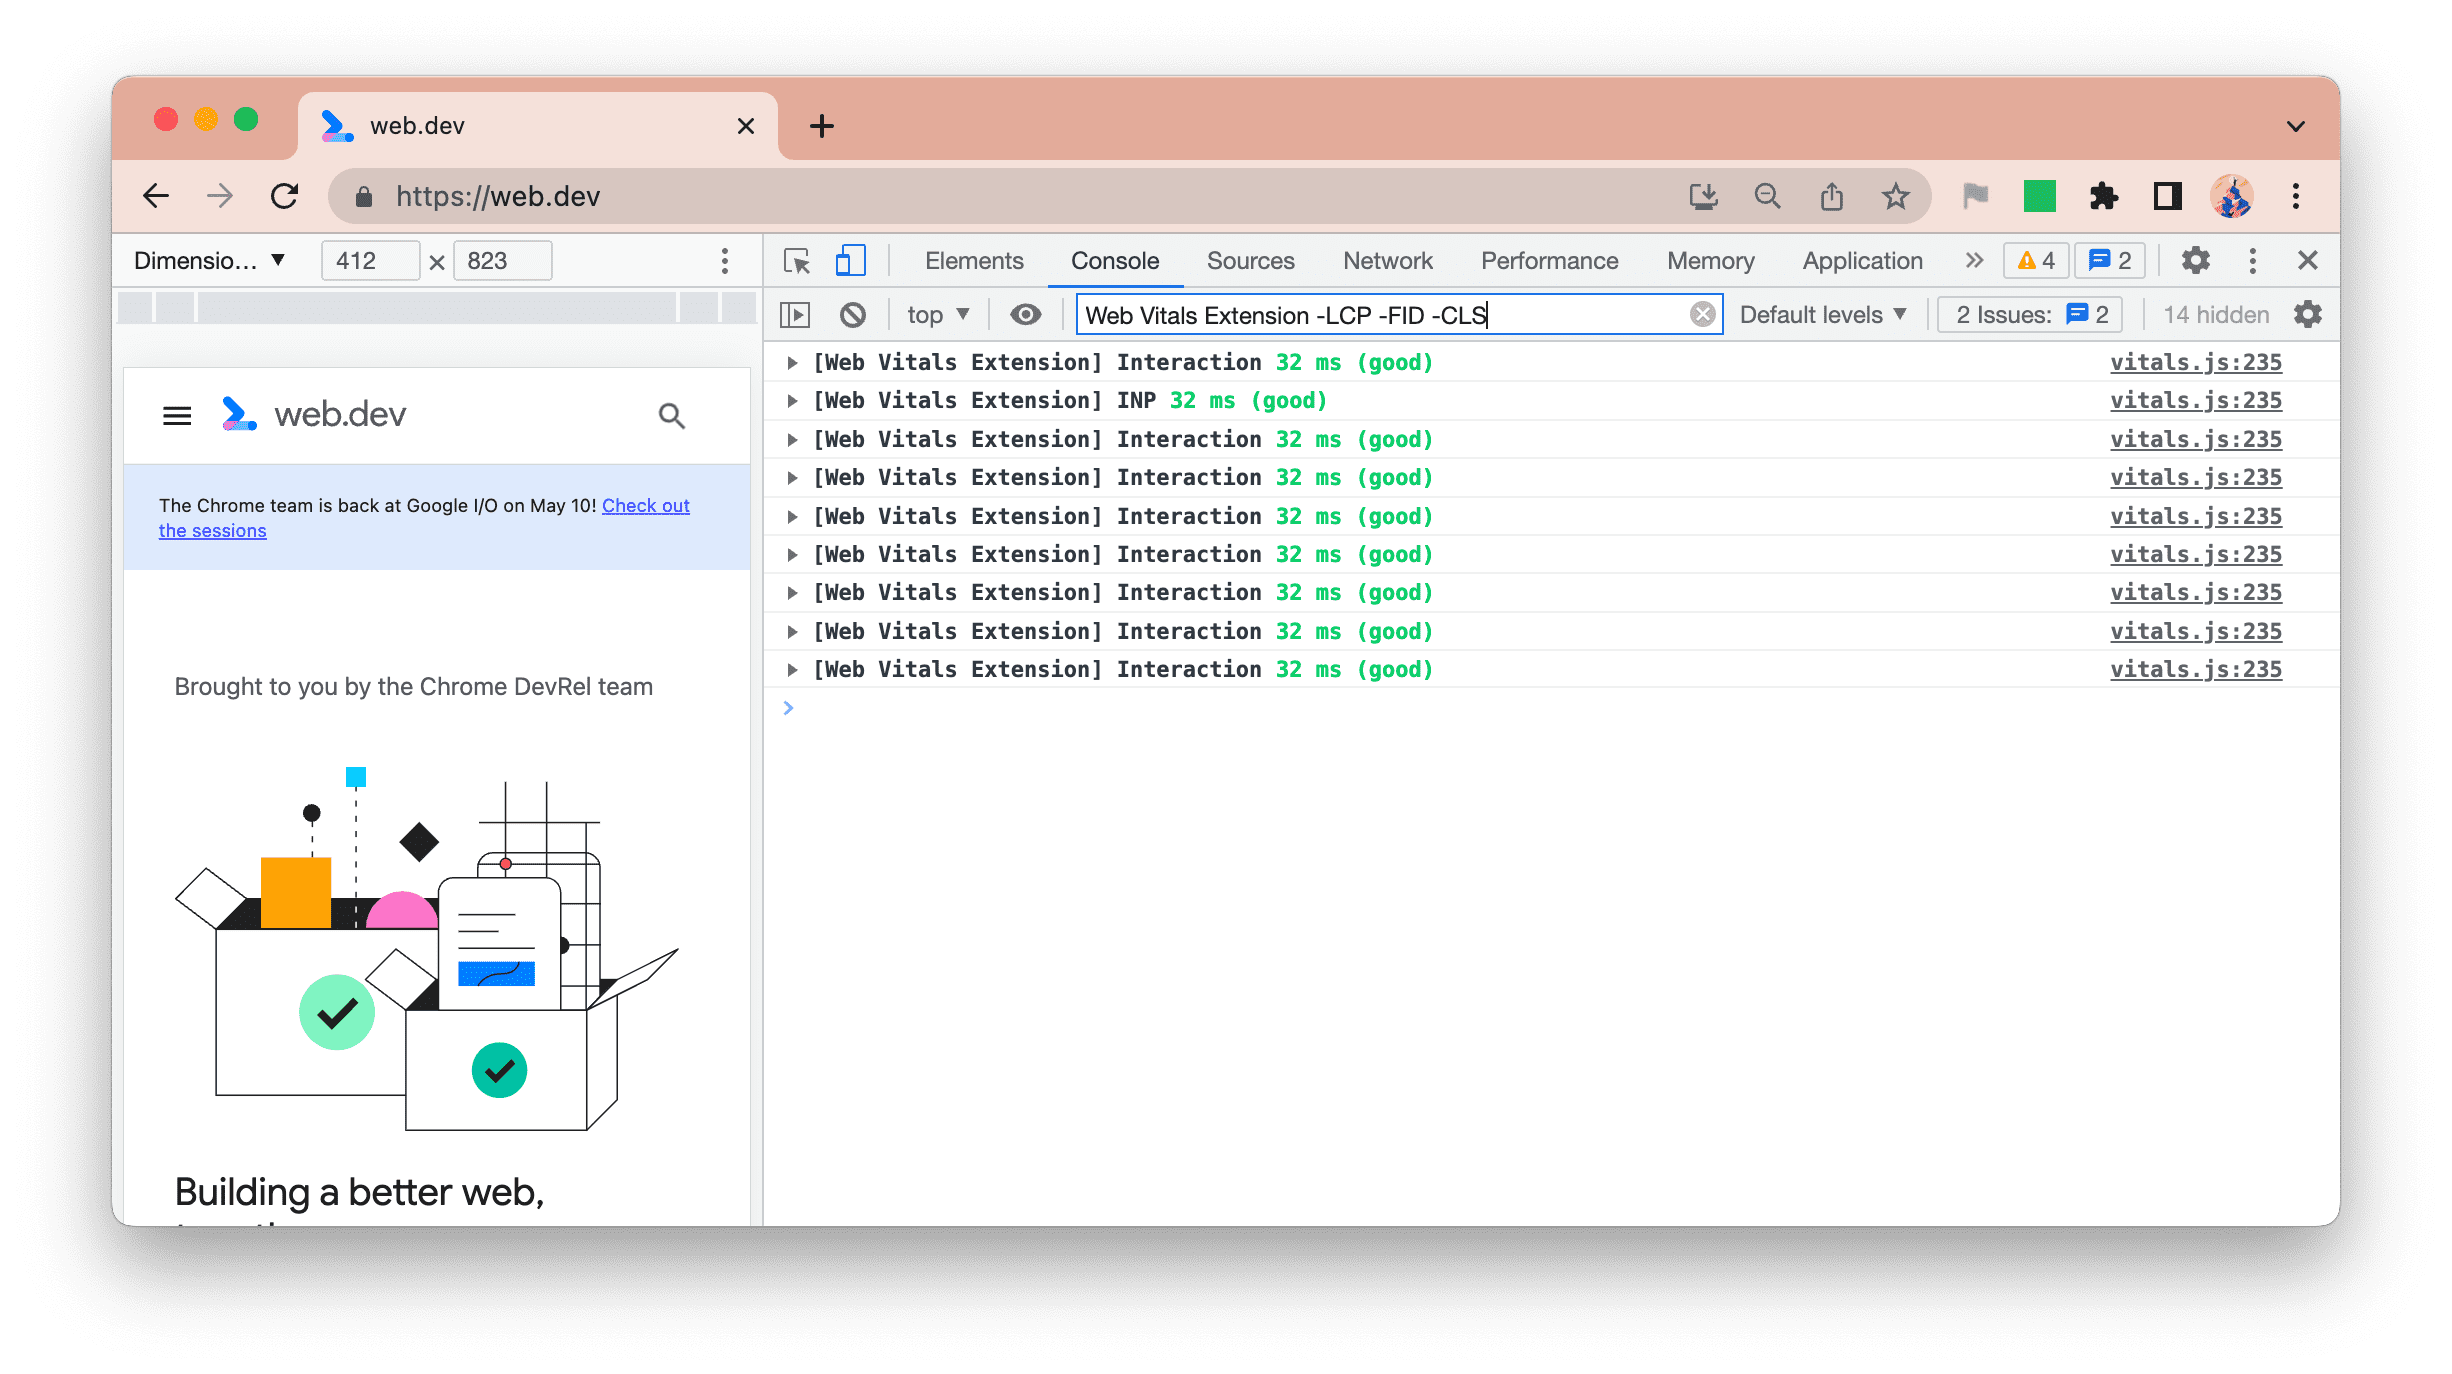
- To remove all the extension messages, you can either turn this off in the options or use the
-Extensionfilter. - To look at just LCP you can use the
Web Vitals Extension LCPfilter. - To look at just INP and interactions you can use the
Web Vitals Extension -LCP -CLS -FIDfilter.
We're trying to keep the number of options for this extension down, but do let us know by raising a GitHub issue if DevTools filtering is not sufficient and you would prefer options here.
Conclusion
We hope you find the new debug options in the latest version of the extension useful and that they make it easier to identify and resolve Core Web Vitals issues, improving the user experiences on your website.
Do remember that your experiences, on your developer computer, may not be representative of what your real users are experiencing. Check out our previous blog post on how you can view the CrUX field data for your site in the extension to get a sense of how aligned your experiences are with your users.
We would be grateful to hear any feedback on these improvements, or any other suggestions on our GitHub issues tracker.


