
Learn about measuring animations, how to think about animation frames, and overall page smoothness.


You've probably experienced pages that "stutter" or "freeze" during scrolling or animations. We like to say that these experiences are not smooth. To address these types of issues, the Chrome team has been working on adding more support to our lab tooling for animation detection, as well as making steady improvements to the rendering pipeline diagnostics within Chromium.
We'd like to share some recent progress, offer concrete tooling guidance, and discuss ideas for future animation smoothness metrics. As always, we would love to hear your feedback.
This post will cover three main topics:
- A quick look at animations and animation frames.
- Our current thoughts on measuring overall animation smoothness.
- A few practical suggestions for you to leverage in lab tooling today.
What are animations?
Animations bring content to life! By making content move, especially in response to user interactions, animations can make an experience feel more natural, understandable, and fun.
But poorly implemented animations, or just adding too many animations, can degrade the experience and make it decidedly not fun at all. We've probably all interacted with an interface which just added too many "helpful" transition effects, which actually become hostile to experience when they perform poorly. Some users therefore actually might prefer reduced motion, a user preference that you should honor.
How do animations work?
As a quick recap, the rendering pipeline consists of a few, sequential stages:
- Style: Calculate the styles that apply to the elements.
- Layout: Generate the geometry and position for each element.
- Paint: Fill out the pixels for each element into layers.
- Composite: Draw the layers to the screen.
While there are many ways to define animations, they all fundamentally work via one of the following:
- Adjusting layout properties.
- Adjusting paint properties.
- Adjusting composite properties.
Because these stages are sequential, it is important to define animations in terms of properties that are further down the pipeline. The earlier the update happens in the process, the greater are the costs and it's less likely to be smooth. (See Rendering performance for more details.)
While it can be convenient to animate layout properties, there are costs to doing so, even if those costs aren't immediately apparent. Animations should be defined in terms of composite property changes wherever possible.
Defining declarative CSS animations or using Web Animations, and ensuring you animate composite properties, is a great first step to ensuring smooth and efficient animations. But still, this alone does not guarantee smoothness because even efficient web animations have performance limits. That's why it is always important to measure!
What are animation frames?
Updates to the visual representation of a page take time to appear. A visual change will lead to a new animation frame, which is eventually rendered on the user's display.
Displays update on some interval, so visual updates are batched. Many displays update on a fixed interval of time, such as 60 times a second (that is 60 Hz). Some more modern displays can offer higher refresh rates (90–120 Hz are becoming common). Often these displays can actively adapt between refresh rates as needed, or even offer fully variable frame rates.
The goal for any application, like a game or a browser, is to process all these batched visual updates and produce a visually complete animation frame within the deadline, every time. Note that this goal is entirely distinct from other important browser tasks such as loading content from the network quickly or executing JavaScript tasks efficiently.
At some point, it can become too difficult to complete all visual updates within the allotted deadline assigned by the display. When this happens, the browser drops a frame. Your screen doesn't go black, it just repeats itself. You see the same visual update for a bit longer—the same animation frame that was presented at the previous frame opportunity.
This actually happens often! It is not necessarily even perceptible, especially for static or document-like content, which is common on the web platform in particular. Dropped frames only become apparent when there are important visual updates, such as animations, for which we need a steady stream of animation updates to show smooth motion.
What impacts animation frames?
Web developers can greatly impact the ability of a browser to quickly and efficiently render and present visual updates!
Some examples:
- Using content that is too large or resource-intensive to decode quickly on the target device.
- Using too many layers requiring too much GPU memory.
- Defining overly complex CSS styles or web animations.
- Using design anti-patterns that disable fast rendering optimizations.
- Too much JS work on the main thread, leading to long tasks that block visual updates.
But how can you know when an animation frame has missed its deadline and caused a dropped frame?
One possible method is using
requestAnimationFrame()
polling, however it has several downsides. requestAnimationFrame(), or "rAF",
tells the browser that you wish to perform an animation and asks for an
opportunity to do so before the next paint stage of the rendering pipeline. If
your callback function isn't called at the time you expect it, that means a
paint wasn't executed, and one or more frames were skipped. By polling and
counting how often rAF is called, you can compute a sort of "frames per second"
(FPS) metric.
let frameTimes = [];
function pollFramesPerSecond(now) {
  frameTimes = [...frameTimes.filter(t => t > now - 1000), now];
  requestAnimationFrame(pollFramesPerSecond);
  console.log('Frames per second:', frameTimes.length);
}
requestAnimationFrame(pollFramesPerSecond);
Using requestAnimationFrame() polling is not a good idea for several reasons:
- Every script has to set up its own polling loop.
- It can block the critical path.
- Even if the rAF polling is fast, it can prevent
requestIdleCallback()from being able to schedule long idle blocks when used continuously (blocks that exceed a single frame). - Similarly, lack of long idle blocks prevents the browser from scheduling other long-running tasks (such as longer garbage collection and other background or speculative work).
- If polling is toggled on and off, then you'll miss cases where frame budget has been exceeded.
- Polling will report false-positives in cases where the browser is using variable update frequency (for example, due to power or visibility status).
- And most importantly, it doesn't actually capture all types of animation updates!
Too much work on the main thread can impact the ability to see animation frames. Check out the Jank Sample to see how a rAF-driven animation, once there is too much work on the main thread (such as layout), will lead to dropped frames and fewer rAF callbacks, and lower FPS.
When the main thread becomes bogged down, visual updates begin to stutter. That's jank!
Many measurement tools have focused extensively on the ability for the main thread to yield in a timely manner, and for animation frames to run smoothly. But this is not the whole story! Consider the following example:
The video above shows a page that periodically injects long tasks onto the main
thread. These long tasks completely ruin the ability of the page to provide
certain types of visual updates, and you can see in the top-left corner a
corresponding drop of requestAnimationFrame() reported FPS to 0.
And yet, despite these long tasks, the page continues to scroll smoothly. This is because on modern browsers, scrolling is often threaded, driven entirely by the compositor.
This is an example that simultaneously contains many dropped frames on the main thread, yet still has many successfully-delivered frames of scrolling on the compositor thread. Once the long task is complete, the main thread paint update has no visual change to offer anyway. rAF polling suggested a frame drop to 0, but visually, a user wouldn't be able to notice a difference!
For animation frames, the story is not that simple.
Animation frames: Updates that matter
The above example showcases that there is more to the story than just
requestAnimationFrame().
So when do animation updates and animation frames matter? Here are some criteria we're thinking about and would love to get feedback on:
- Main and compositor thread updates
- Missing paint updates
- Detecting animations
- Quality versus quantity
Main and compositor thread updates
Animation frame updates are not boolean. It is not the case that frames may only be fully dropped or fully presented. There are many reasons why an animation frame may be partially presented. In other words, it can simultaneously have some stale content while also having some new visual updates which are presented.
The most common example of this is when the browser is unable to produce a new main thread update within frame deadline but does have a new compositor thread update (such as the threaded scrolling example from earlier).
One important reason why using declarative animations to animate composite properties is recommended is that doing so enables an animation to be driven entirely by the compositor thread even when the main thread is busy. These types of animations can continue to produce visual updates efficiently and in parallel.
On the other hand, there may be cases where a main thread update finally becomes available for presentation, but only after missing several frame deadlines. Here the browser will have some new update, but it may not be the very latest.
Broadly speaking, we consider frames that contain some new visual updates, without all new visual updates, as a partial frame. Partial frames are fairly common. Ideally, partial updates would at least include the most important visual updates, like animations, but that can only happen if animations are driven by the compositor thread.
Missing paint updates
Another type of partial update is when media like images have not finished decoding and rasterizing in time for frame presentation.
Or, even if a page is perfectly static, browsers may still fall behind rendering visual updates during rapid scrolling. That is because the pixel renditions of content beyond the visible viewport may be discarded to save GPU memory. It takes time to render pixels, and it may take longer than a single frame to render everything after a large scroll, like a finger fling. This is commonly known as checkerboarding.
With each frame rendering opportunity, it's possible to track how much of the latest visual updates actually got to the screen. Measuring the ability to do so over many frames (or time) is broadly known as frame throughput.
If the GPU is really bogged down, the browser (or platform) may even begin to throttle the rate at which it attempts visual updates and thus decreases effective frame rates. While technically that can reduce the number of dropped frame updates, visually it will still appear as a lower frame throughput.
Yet, not all types of low frame throughput are bad. If the page is mostly idle and there are no active animations, a low frame rate is just as visually appealing as a high frame rate (and, it can save battery!).
So when does frame throughput matter?
Detecting animations
High frame throughput matters especially during periods with important animations. Different animation types will depend on visual updates from a specific thread (main, compositor, or a worker), so its visual update is dependent on that thread providing its update within the deadline. We say that a given thread affects smoothness whenever there is an active animation that depends on that thread update.
Some types of animations are easier to define and detect than others. Declarative animations, or user-input-driven animations, are clearer to define than JavaScript-driven animations implemented as periodic updates to animatable style properties.
Even with requestAnimationFrame() you
cannot always assume that every rAF call is necessarily producing a visual
update or animation. For example, using rAF polling just to track frame rate
(as shown above) should not itself affect smoothness measurements since there is
no visual update.
Quality versus quantity
Finally, detecting animations and animation frame updates is still only part of the story because it only captures the quantity of animation updates, not the quality.
For example, you may see a steady framerate of of 60 fps while watching a video. Technically, this is perfectly smooth, but the video itself may have a low bit rate, or issues with network buffering. This isn't captured by animation smoothness metrics directly, yet may still be jarring to the user.
Or, a game which leverages <canvas> (perhaps even using techniques like
offscreen
canvas to
ensure a steady frame rate) may technically be perfectly smooth in terms of
animation frames, all while failing to load high quality game assets into the
scene or exhibiting rendering artifacts.
And of course, a site can just have some really bad animations 🙂
![]()
I mean, I guess they were pretty cool for their time!
States of a single animation frame
Because frames may be partially presented, or dropped frames may happen in ways that do not affect smoothness, we have begun to think of each frame as having a completeness or smoothness score.
Here is the spectrum of ways in which we interpret the state of a single animation frame, ordered from best to worst case:
| No Update Desired | Idle time, repeat of the previous frame. |
| Fully presented | The main thread update was either committed within deadline, or no main thread update was desired. |
| Partially presented | Compositor only; the delayed main thread update had no visual change. |
| Partially presented | Compositor only; the main thread had a visual update, but that update did not include an animation that affects smoothness. |
| Partially presented | Compositor only; the main thread had a visual update that affects smoothness, but a previously stale frame arrived and was used instead. |
| Partially presented | Compositor only; without the desired main update, and the compositor update has an animation that affects smoothness. |
| Partially presented | Compositor only but the compositor update does not have an animation that affects smoothness. |
| Dropped frame | No update. There was no compositor update desired, and main was delayed. |
| Dropped frame | A compositor update was desired, but it was delayed. |
| Stale frame | An update was desired, it was produced by the renderer, but the GPU still did not present it before the vsync deadline. |
It's possible to turn these states into somewhat of a score. And perhaps one way to interpret this score is to consider it a probability of being observable by the user. A single dropped frame may not be very observable, but a sequence of many dropped frames affecting smoothness in a row sure is!
Putting it all together: A Percent Dropped Frames metric
While it can sometimes be necessary to dive deep into the state of each animation frame, it's also useful to just assign a quick "at a glance" score for an experience.
Because frames may be partially presented, and because even fully skipped frame updates may not actually affect smoothness, we want to focus less on just counting frames, and more on the extent to which the browser is unable to provide visually complete updates when it mattered.
The mental model should move from:
- Frames Per Second, to
- Detecting missing and important animation updates, to
- Percentage Dropped over a given time period.
What matters is: the proportion of time waiting for important updates. We think this matches the natural way users experience the smoothness of web content in practice. So far, we have been using the following as an initial set of metrics:
- Average Percent Dropped: for all non-idle animation frames throughout the whole timeline
- Worst Case of Percent Dropped Frames: as measured over 1 second sliding windows of time.
- 95th percentile of Percent Dropped Frames: as measured over 1 second sliding windows of time.
You can find these scores in some Chrome developer tools today. While these metrics focus only on overall frame throughput, we are also evaluating other factors, such as frame latency.
Try it yourself in developer tooling!
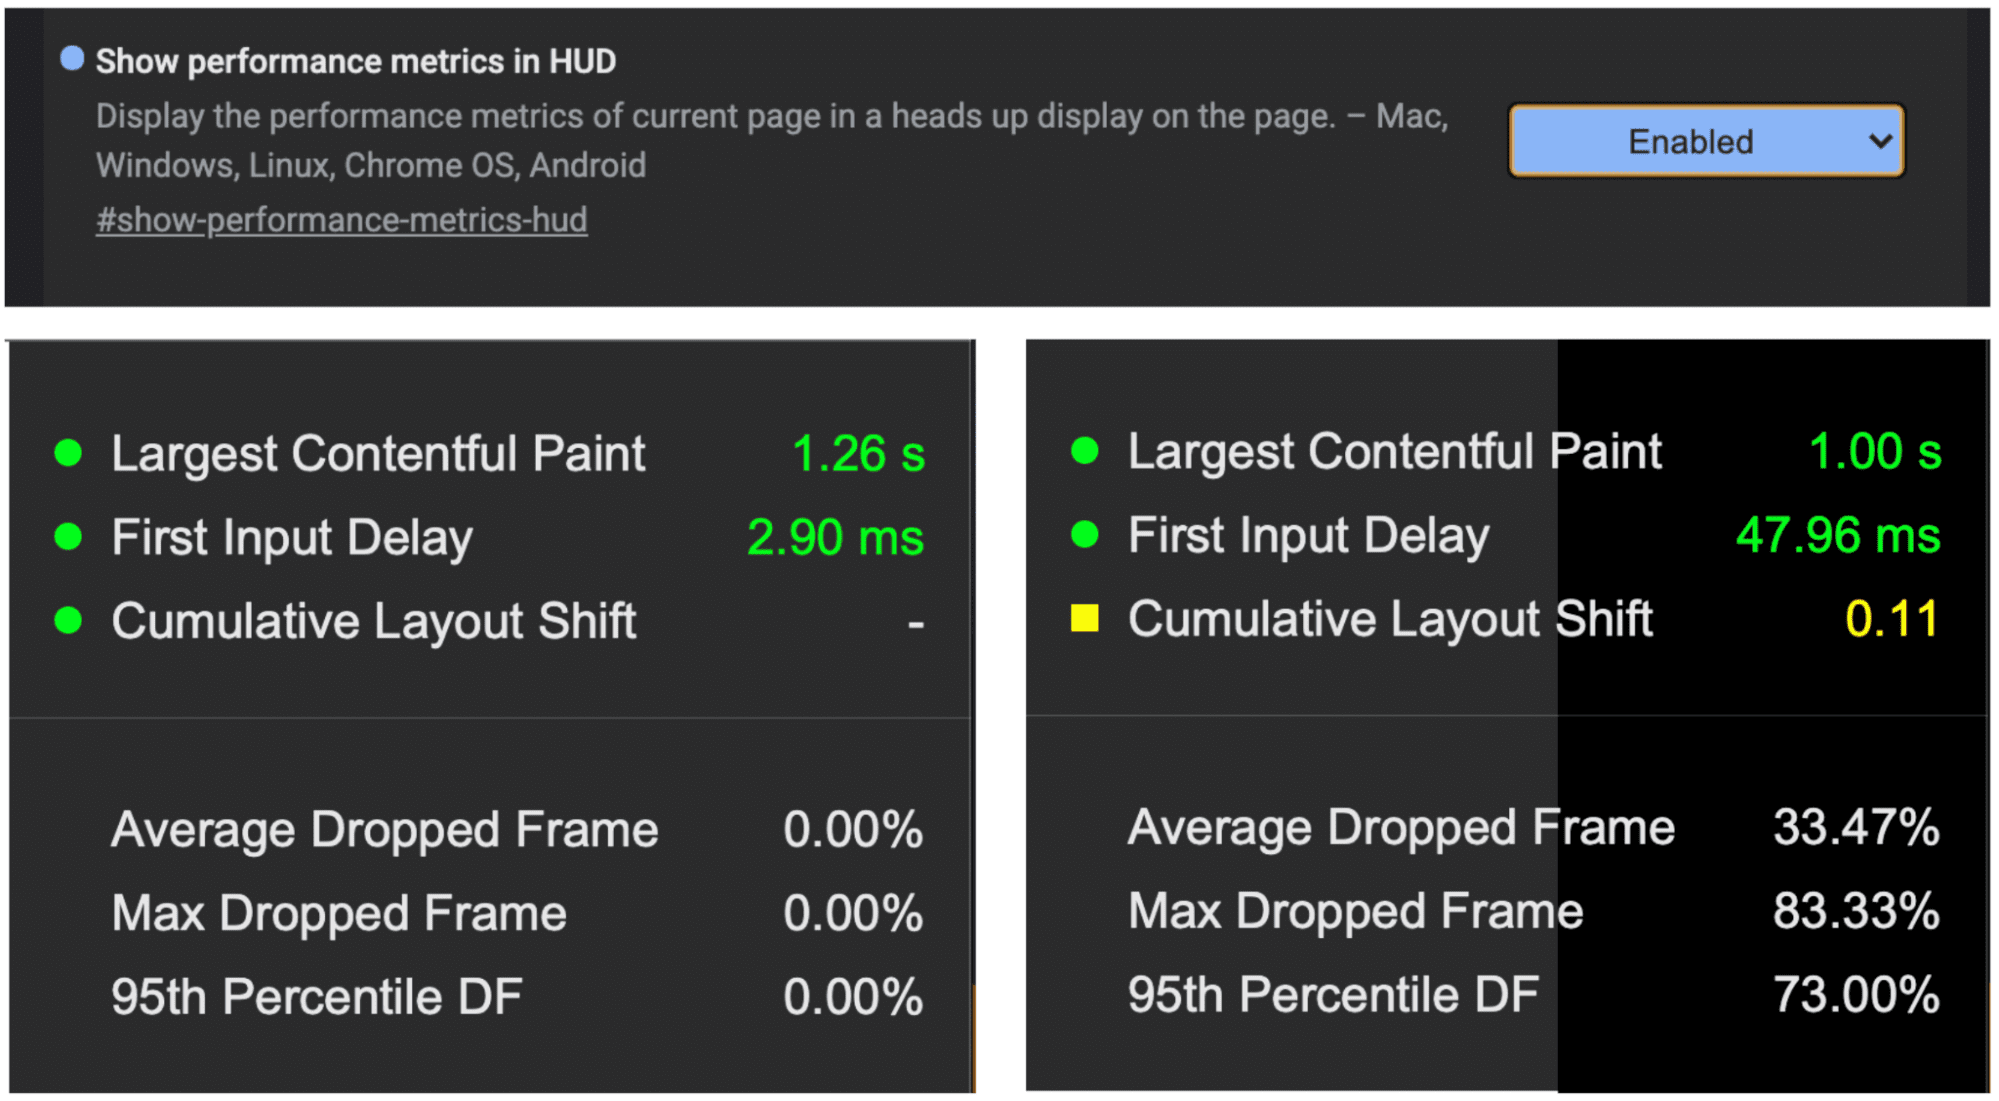
Performance HUD
Chromium has a neat Performance HUD hidden behind a flag
(chrome://flags/#show-performance-metrics-hud). In it, you can find live
scores for things like Core Web Vitals and also a few experimental definitions
for animation smoothness based on Percent Dropped Frames over time.
Frame Rendering Stats
Enable "Frame Rendering Stats" in DevTools via Rendering settings to see a live view of new animation frames, which are color-coded to differentiate partial updates from fully-dropped frame updates. The reported fps is for fully-presented frames only.

Frame Viewer in DevTools performance profile recordings
The DevTools Performance panel has long had a Frames viewer. However, it had grown a bit out of sync with how the modern rendering pipeline actually works. There has been plenty of recent improvement, even in the latest Chrome Canary, which we think will greatly ease debugging animation issues.
Today you will find that frames in the frames viewer are better aligned with vsync boundaries, and color-coded based on status. There is still not full visualization for all the nuances outlined above, but we're planning to add more in the near future.

Chrome tracing
Finally, with Chrome Tracing, the tool of choice for diving deep into details,
you can record a "Web content rendering" trace via the new Perfetto
UI (or about:tracing), and dig deep into Chrome's
graphics pipeline. It can be a daunting task, but there are a few things
recently added to Chromium to make it easier. You can get an overview of what is
available in the Life of a
Frame
document.
Through trace events you can definitively determine:
- Which animations are running (using events named
TrackerValidation). - Getting the exact timeline of animation frames (using events named
PipelineReporter). - For janky animation updates, figure out exactly what is blocking your
animation from running faster (using the event breakdowns within
PipelineReporterevents). - For input-driven animations, see how long it takes to get a visual update
(using events named
EventLatency).

What's next
The Web Vitals initiative aims to provide metric and guidance for building great user experiences on the web. Lab-based metrics like Total Blocking Time (TBT) are vital for catching and diagnosing potential interactivity issues. We are planning to design a similar lab-based metric for animation smoothness.
We'll keep you posted as we continue to work through ideas for designing a comprehensive metric based on individual animation frame data.
In the future, we'd also like to design APIs that make it possible to measure animation smoothness performantly for real users in the field as well as in the lab. Stay tuned for updates there as well!
Feedback
We're excited about all the recent improvements and developer tools that have shipped in Chrome to measure animation smoothness. Please try these tools out, benchmark your animations, and let us know where it leads!
You can send your comments to the web-vitals-feedback Google group with "[Smoothness Metrics]" in the subject line. We're really looking forward to hearing what you think!