
Creating a web performance dashboard and optimizing JavaScript, resources, and the homepage to achieve business success.
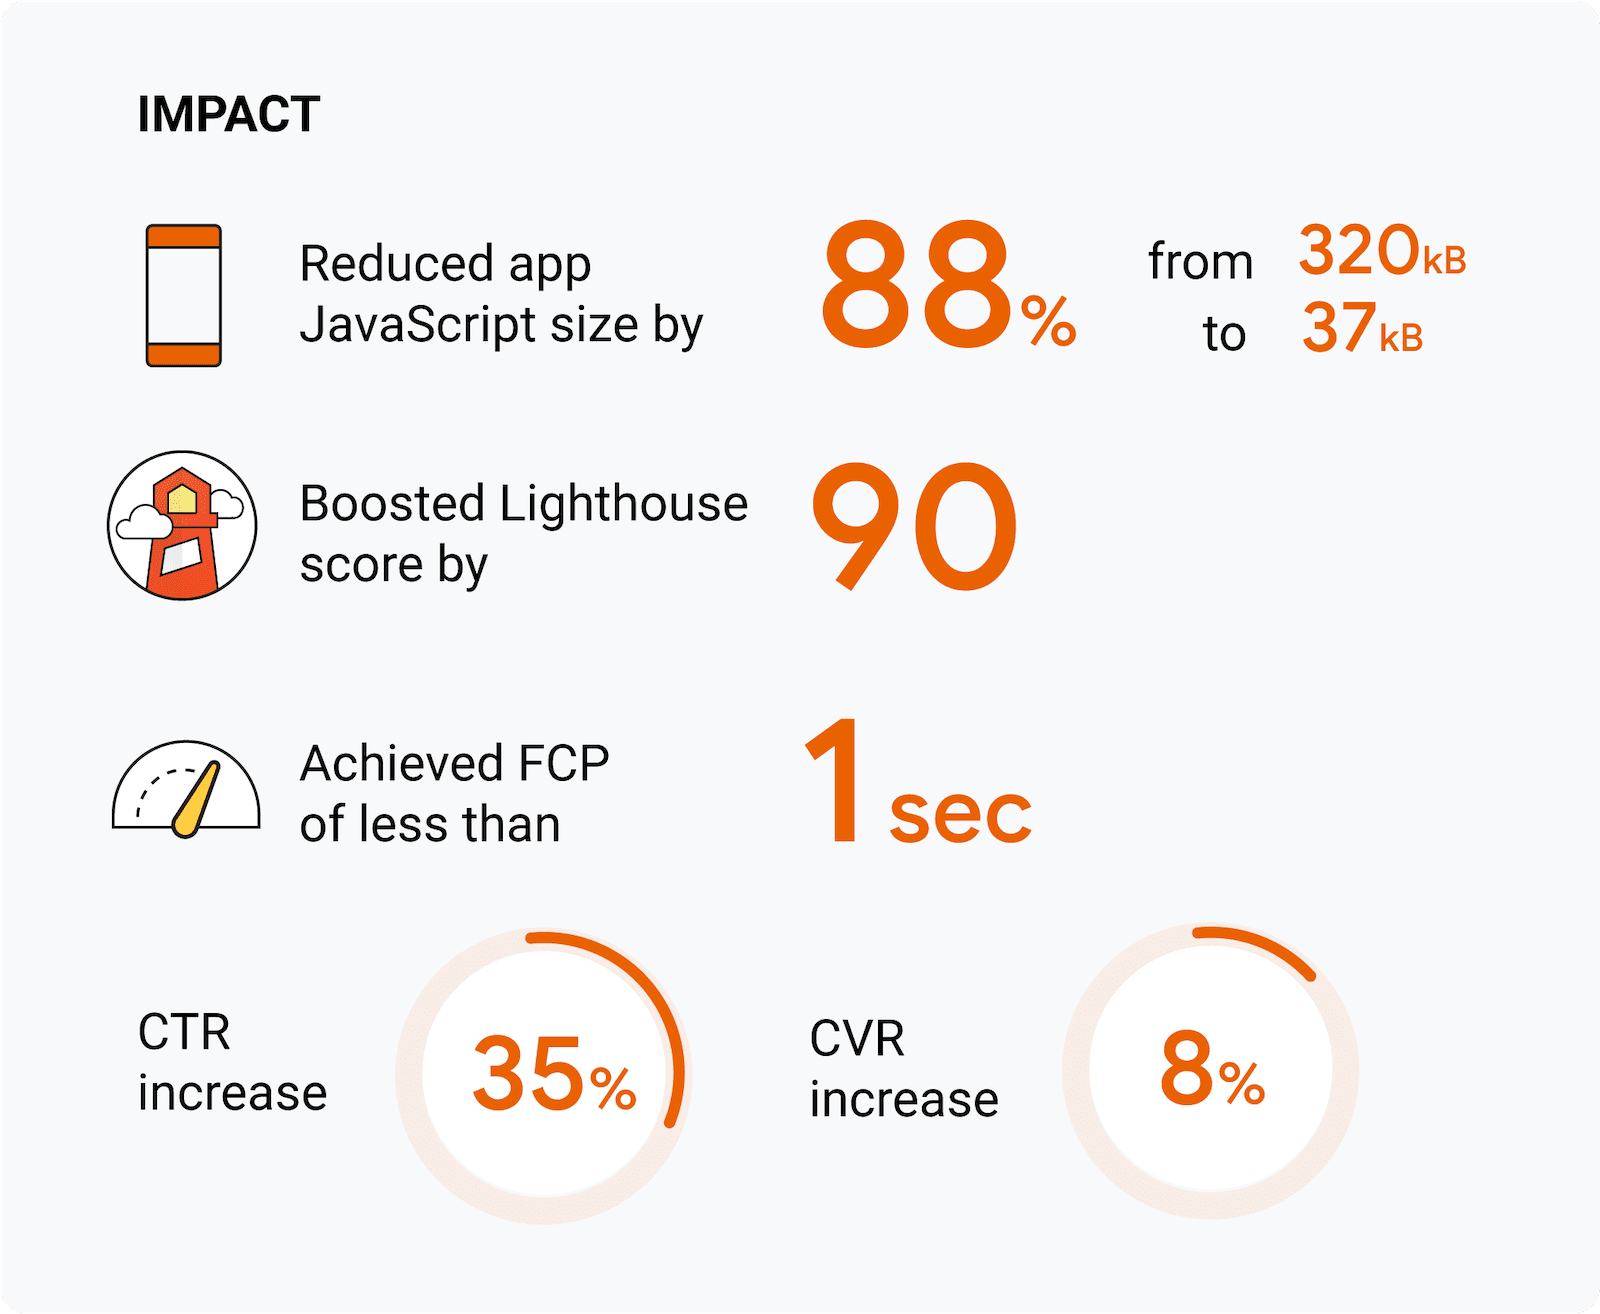
Tokopedia is one of the largest e-commerce companies in Indonesia. With 2.7M+ nationwide merchant networks, 18M+ product listings, and 50M+ monthly visitors, the web team knew that investment in web performance was essential. By building a performance-first culture, they achieved a 35% increase in click-through rates (CTR) and an 8% increase in conversions (CVR).
35%
Increase in CTR
8%
Increase in CVR
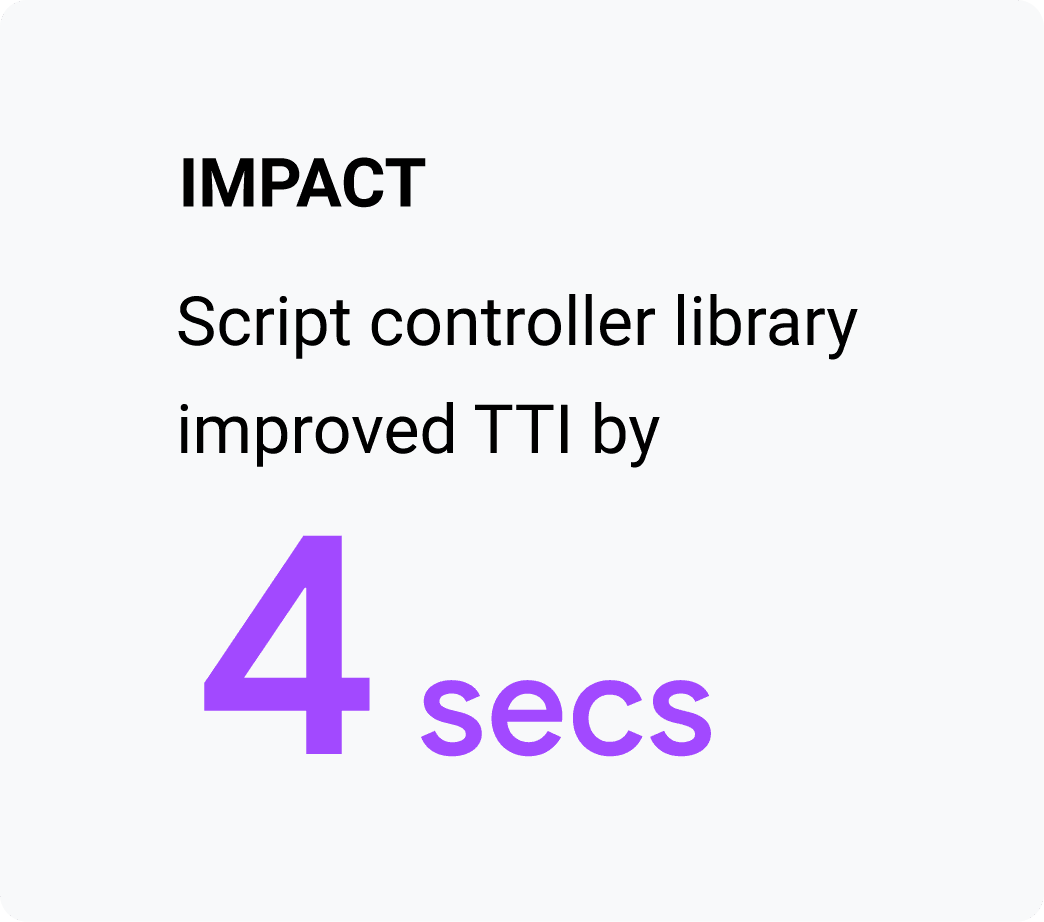
4sec
Improvement in TTI
Highlighting the opportunity
The web team talked to their leadership team on the importance of investing in web performance to improve user experience and engagement, and also showed the impact of performance using advanced patterns and APIs.
The approach they used
JavaScript and resource optimization
Render-blocking or long-running JavaScript is a common cause of performance issues. The team took several steps to minimize this:
- Built a script controller library to selectively load third-party scripts to optimize for critical rendering path.
- Replaced heavier libraries with lighter ones.
- Implemented code splitting and optimized for above-the-fold content.
- Implemented adaptive loading, e.g. only loading high-quality images for devices on fast networks and using lower-quality images for devices on slow networks.
- Lazy-loaded below-the-fold images.
- Deferred loading of non-critical JavaScript.
Homepage optimization
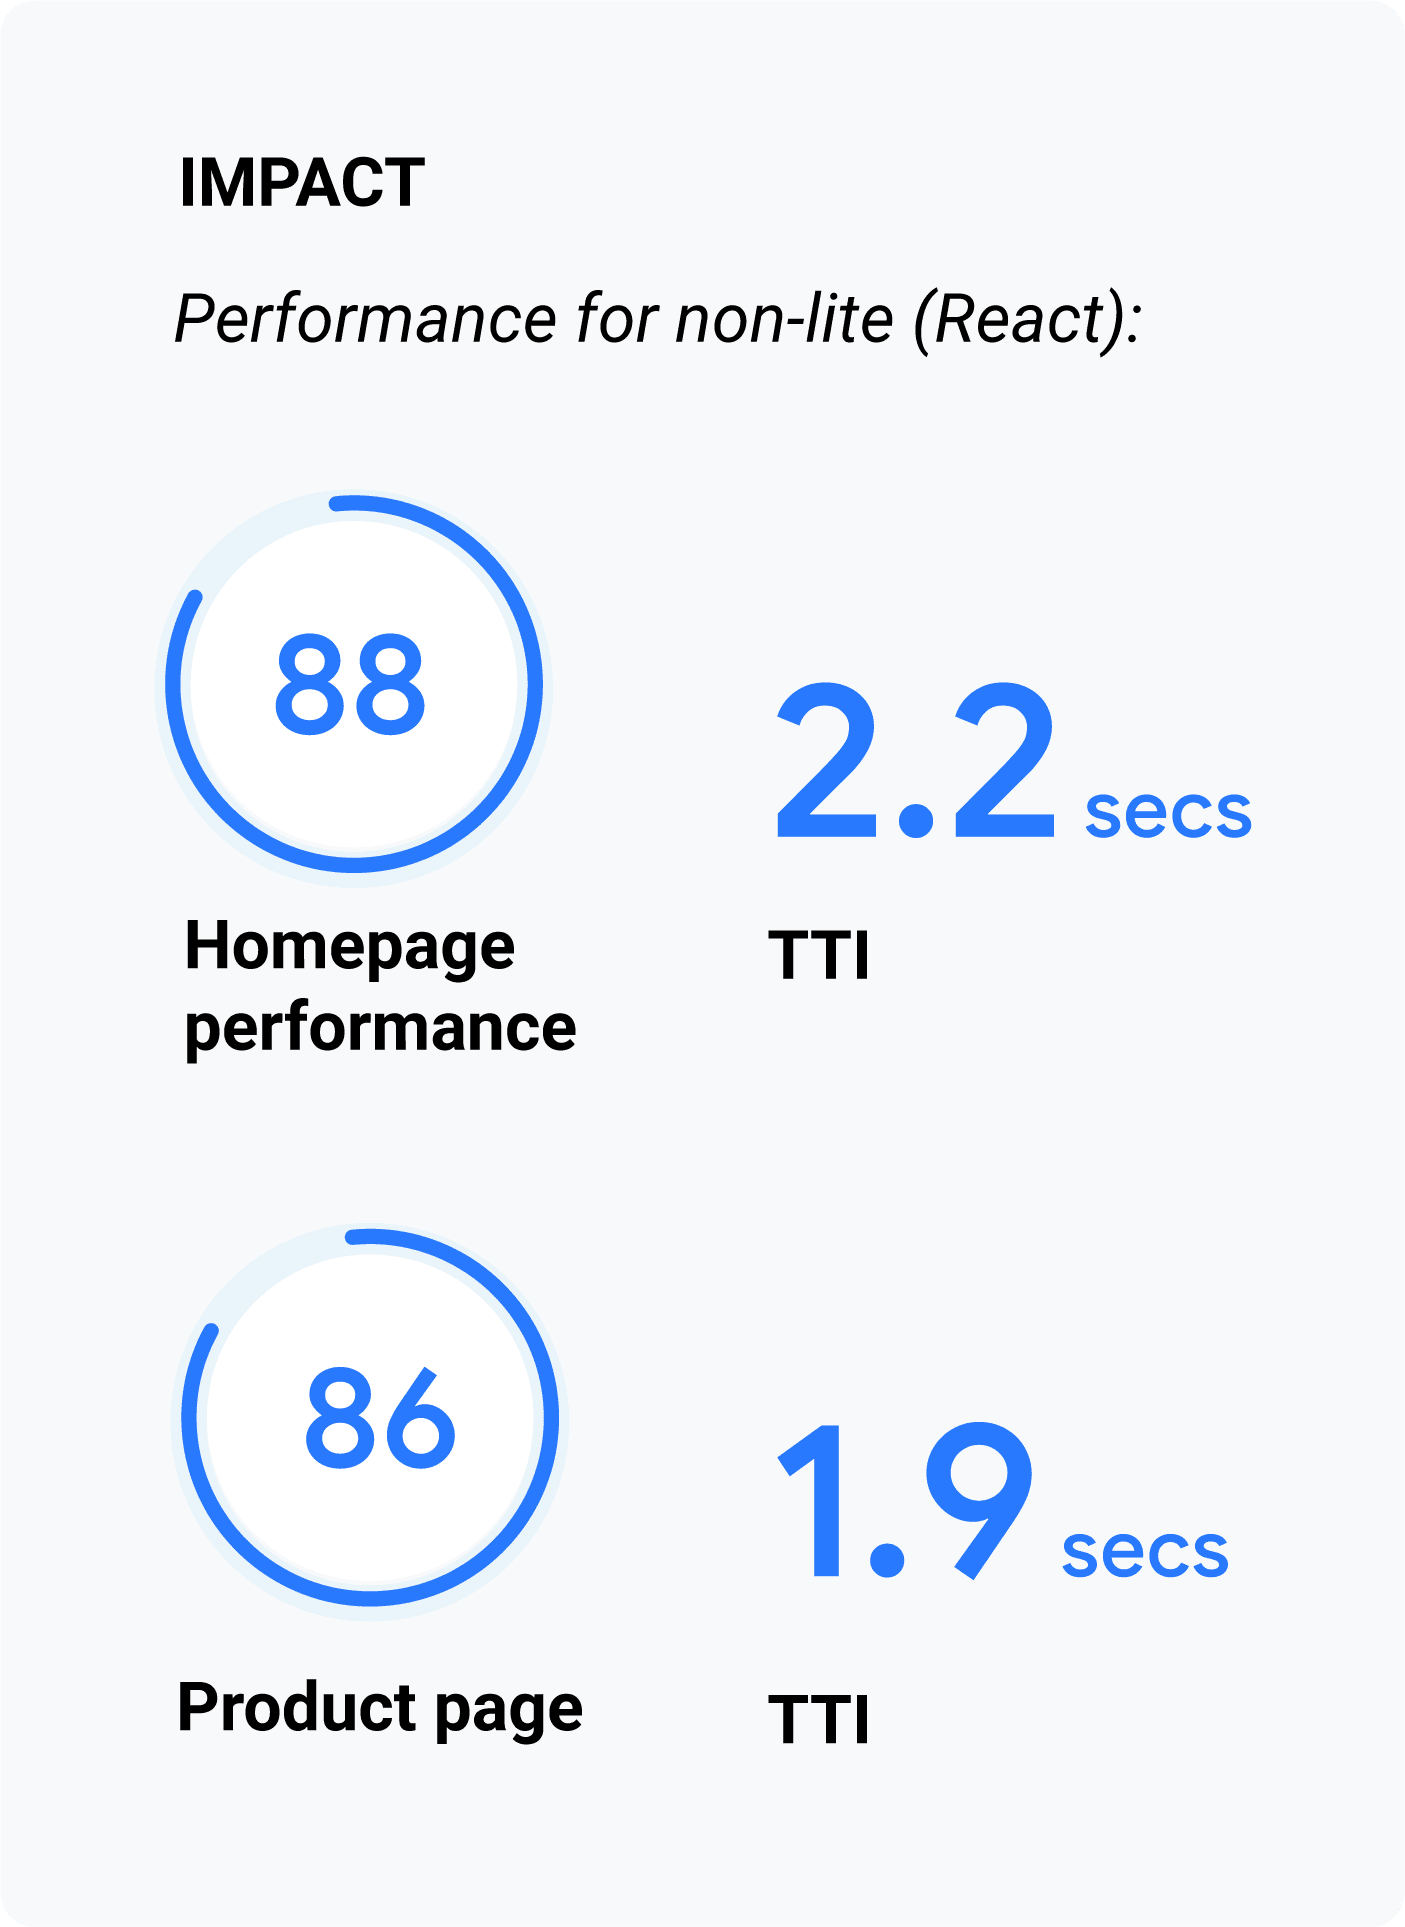
The team used Svelte to build a lite version of the homepage for first-time visitors, ensuring a fast website experience. This version also used a service worker to cache the non-lite assets in the background.
Performance budgeting and monitoring
The team built a performance monitoring dashboard using Lighthouse and other tools to improve the quality of web pages:
- Measures network quality, infrastructure monitoring, frontend performance, and server performance.
-
Uses a combination of web platform APIs (such as the
Resource Timing API
and the
Server-Timingheader), the PageSpeed Insights (PSI) API, and Chrome User Experience Report data to monitor field and lab metrics. - Analyzes images from Lighthouse to help identify image optimization opportunities.
- Enforces a bundle-size budget during continuous integration (CI). The CI run fails if the bundle size is over budget.
Being an e-commerce business, user acquisition is at the heart of our success. We acknowledge the importance of the web and thus we are passionate about investing in all the tools and features that will give the best user experience to our users.
Dendi Sunardi, Engineering Manager, Web Platform, Tokopedia
Check out the Scale on web case studies page for more success stories from India and Southeast Asia.