
Combine Google tools to audit, improve and monitor your website effectively.


Core Web Vitals are a set of metrics that assess the user experience on criteria such as load performance, responsiveness to user input, and layout stability.
A workflow for improving Core Web Vitals for your website will be explored in this guide, but where that workflow begins depends on whether you're collecting your own field data. Where it ends may depend on which of Google's tools you'll find useful in diagnosing and fixing user experience problems.
Core Web Vitals are best measured in the field
Core Web Vitals are specifically designed to measure how users experience your website—they are user centric metrics. Lab-based tools such as Lighthouse are diagnostic tools to highlight potential performance problems and best practices. Lab-based tools are run under certain, predefined conditions and may not reflect the real-life Core Web Vitals measurements your users experience.
For example, Lighthouse is a lab-based tool that runs tests with simulated throttling in a simulated desktop or mobile environment. While such simulations of slower network and device conditions are helpful when trying to diagnose performance problems, they're just a single slice of the large variety in network conditions and device capabilities, and so may not reflect what users on your sites are experiening.
Lab-based tools like Lighthouse also typically do a "cold load" of a web page as a totally new visitor. This is often the slowest load, but in real life, visitors may have some assets cached if they have visited before, or when they are browsing around the site. New visitors, and tools, also may experience the site differently with cookie banners or other content present to them.
In short, while lab-based tools can give an indication of potential performance problems and help you debug and iterate, they may not represent how many of your visitors actually experience your website. Use field data for measuring real-world performance, and lab-based tools like Lighthouse for diagnostics of how to improve it. See also the When to use Lighthouse section.
Google measures Core Web Vitals through the Chrome User Experience Report (CrUX). This is a public dataset collected from real Chrome users. It is the backbone of many Google and third-party tools which report a site's Core Web Vitals.
CrUX has its limitations, though. It can often tell you when there is a problem, but often has insufficient data to tell you why.
Collect your own field data if possible
The best dataset for improving website performance in the field is the one you build. That starts with collecting field data from your website's visitors. How you do this depends on the size of your organization, and whether you want to pay for a third-party solution or create your own.
Paid solutions will almost certainly measure Core Web Vitals (and other performance metrics) and usually provide a variety of tools to dig into the resulting data. In large organizations with significant resources, this may be the preferred method.
However, you may not be part of a large organization—or even one with the means to afford a third-party solution. In these cases, Google's web-vitals library will help you gather all Web Vitals. However, you'll be responsible for how that data is reported, stored, and analyzed.
If you're already using Google Analytics, but you haven't started collecting your own field data, there may be an opportunity for you to use the web-vitals library to send Web Vitals collected in the field to Google Analytics and use the BigQuery exports of GA4 to report on the data.
Understanding Google's tools
Regardless of whether you're collecting your own field data, there are several Google tools that may be useful in analyzing Core Web Vitals. Before establishing a workflow, a high-level overview of each tool can help you to understand which tools may—or may not—be best for you.
Chrome User Experience Report (CrUX)
As mentioned previously, CrUX is a public dataset of field data gathered from a segment of real Google Chrome users from millions of websites. It includes Core Web Vital metrics and other metrics for websites with sufficient traffic.
CrUX is available as a monthly BigQuery dataset at the origin level, or as a daily API at the URL or origin-level, provided a URL or origin has enough samples in the CrUX dataset. The BigQuery data is also viewable in an easy to use CrUX Dashboard allowing sites to review historical trends for their site.
When to use CrUX
Even if you gather your own field data, CrUX is still useful. Though CrUX represents a subset of Chrome users, it's helpful to compare your website's field data to see how it aligns with its CrUX data. There are advantages and disadvantages to each, which can result in differences. If you currently don't gather any field data for your website, CrUX is especially valuable to provide a high-level overview—provided your website is represented in its dataset.
You can use CrUX directly, or via another tool (including those mentioned below). Using the CrUX dataset directly, either via BigQuery or the API, is useful to surface data that is not currently shown in other tools—for example country-level data is often not available on other tools, or to view the additional metrics in CrUX which again are often not surfaced in other tooling.
When not to use CrUX
CrUX only represents Chrome users, and even then, only a subset of Chrome users. A full RUM solution can include more experiences across Chrome and other browsers where they support the Web Vital metrics.
Websites that don't receive enough traffic are not represented in the CrUX dataset. If this is the case for you, you'll need to gather your own field data to understand how your website performs in the field, as CrUX won't be an option. Alternatively, you will need to depend on lab data, but with the limitations that it may not be representative above.
Since the data CrUX provides is a rolling average over the previous 28 days, it's not an ideal tool during development, as it will take a fair amount of time for improvements to be reflected in the CrUX dataset.
Finally, as a public dataset, CrUX is limited to how much information it can make available, and how this data can be queried. Capturing your own RUM data allows you to gather more details (for example, the LCP element), and slice and dice the data more to identify problems. Do logged in users experience better or worse Core Web Vitals than logged out users? Do users with a slow LCP have a particular LCP element? Which interactions are causing high FID and INP values?
PageSpeed Insights (PSI)
PSI is a tool that reports field data from CrUX and lab from Lighthouse for a given page. See those individual sections for more details.
When to use PSI
PSI is great for assessing CrUX performance at the page level or origin-level, for both mobile and desktop users. It's a good choice for an initial overview of Core Web Vitals for a page or site. It also allows you to easily view Core Web Vitals data for other sites like competitors.
PSI also provides Lighthouse data, which gives useful recommendations to improve your Core Web Vitals—if the metrics align. Where these do not align, Lighthouse recommendations may be less relevant.
Since Lighthouse is run from the server, it can form a more consistent baseline than running Lighthouse from DevTools.
When not to use PSI
PSI is only available for public URLs. It cannot be used on development sites that are not publicly accessible.
CrUX data is only available when sites meet certain eligibility criteria, including site popularity thresholds. PSI is less useful when CrUX data is not available for a page or origin as it can only show the Lighthouse lab data in these cases.
Similarly, if you only have origin-level CrUX data rather than the specific URL being tested, then this also limits its usefulness of correlating the origin-level field data to the page-level lab diagnostics. Having the origin-level field data is still very useful information to have as a summary of the site's performance and the Lighthouse audits may help, but extra caution should be used in this case.
Finally, where page-level data is available in CrUX, but differs from the Lighthouse lab data, recommendations from Lighthouse may be of limited value. This can happen particularly for post-load CLS issues, and for interactivity Core Web Vitals (FID and INP) where lab-based audits are less useful.
Search Console
Search Console measures your site's search traffic and performance, including Core Web Vitals. It is only available to site owners who have confirmed their ownership of the site.
A valuable feature of Search Console is that it groups similar pages (for example, pages that use the same template) into a single group assessment. Search Console also includes a Core Web Vitals report based on field data from CrUX.
When to use Search Console
Search Console is well-suited for both developers and those in non-developer roles to assess both search and page performance in ways other Google tools don't. Its presentation of CrUX data and grouping of pages by similarity offers novel insight into how performance improvements impact entire categories of pages.
When not to use Search Console
Search Console may not be a fit for projects that use different third-party tools which group pages by similarity, or if a website isn't represented in the CrUX dataset.
Page grouping can also be somewhat confusing when the example pages in a group have different characteristics than the rest of the group—for example, if the group fails particular Core Web Vitals overall, but the example pages all seem to pass the same Core Web Vitals. This can happen when a group contains a long tail or seldomly visited pages that may be slower to load, as they're less likely to be cached. When there are sufficient volumes of these pages in the long tail, they can influence the group's overall pass rate.
Lighthouse
Lighthouse is a lab tool that provides specific opportunities for improving page performance. Lighthouse user flows also allow developers to script interaction flows for performance testing beyond page load.
Lighthouse-CI is a related tool that runs Lighthouse during project builds and deploys to assist with performance regression testing. It presents a Lighthouse report along with pull requests, and tracks performance metrics over time.
When to use Lighthouse
Lighthouse is excellent for finding performance improvement opportunities during development in both local and staging environments. Lighthouse CI is similarly useful in the build and deploy phases to staging and production environments, where performance regression testing is needed to preserve good user experiences.
When not to use Lighthouse
Lighthouse (or Lighthouse CI) is not a substitute for field data. Lighthouse is primarily a diagnostic tool listing potential issues and best practices from a predefined page load. The recommendations it surfaces may not always match the performance experienced by your users.
While Lighthouse can be used to diagnose production sites through tools like PageSpeed Insights, Lighthouse would ideally be used in development and continuous integration environments to address performance issues before they reach production.
Web Vitals extension
The Web Vitals Chrome extension is a diagnostic tool that surfaces Core Web Vitals metrics as you browse the web. It also includes CrUX data for the current page if it is represented in the CrUX dataset, and provides debugging information to help you identify Core Web Vitals performance problems.
When to use the Web Vitals extension
The Web Vitals extension can be used by anyone in any role to assess a page's Core Web Vitals at all points of the page lifecycle. It is useful as a "live" view of performance as you interact with the page to attempt to uncover performance issues—particularly for post-load issues you might see with the CLS and INP metrics.
When not to use the Web Vitals extension
The Web Vitals extension isn't a holistic assessment of page performance. In addition, the metrics it reports are highly dependent the environment in which it runs, and developers often have higher powered machines or access to faster networks.
The Performance panel in Chrome DevTools
Chrome DevTools is a collection of in-browser development tools, including the Performance panel. The Performance panel is a lab tool that profiles all page activity during page load or a recorded time period. It offers deep insight into everything it observes across dimensions such as network, rendering, painting, and scripting activity, as well as a page's Core Web Vitals.
When to use the Performance panel
The Performance panel should be used by developers during development to gain deep insight into page performance. This is particularly useful to debug responsiveness issues affecting FID or INP. Once a poorly responding interaction is identified and repeatable, the Performance panel can provide a wealth of data as to what is going on in the browser to help understand the issue, from main thread blocking, to JavaScript call stacks, to rendering work.
When not to use the Performance panel
The Performance panel is a developer tool that provides lab data only. It's not a substitute for field data. It contains a lot of debugging information, but because of that, it may not be easy to use for novice developers or those in non-developer roles.
A three step workflow for ensuring your website's Core Web Vitals stay healthy
When working to improve the user experience, it's best to think of the process as a continuous cycle. For improving Core Web Vitals and other performance metrics, one approach could be:
- Evaluate website health and identify pain points.
- Debug and optimize.
- Monitor with continuous integration tools to catch and prevent regressions.

Step 1: Evaluate website health and identify opportunities for improvement
It is best to start with field data to evaluate website health.
- Use PageSpeed Insights to view overall Core Web Vitals experience metrics on the origin, and specific information on an individual URL.
- Search Console can be useful to identify pages which need improvement where its page grouping feature works well for your site.
- If you have RUM data, then that is often the best option to be able to identify particular pages or traffic segments with issues.
Whether you analyze field data you collect yourself or CrUX data, this first step is vital. If you're not gathering field data, CrUX data may be enough to guide you—again, provided your website is represented in the dataset.
Analyze site performance with PageSpeed Insights
PageSpeed Insights displays the CrUX data covering the last 28 days of user experience data at the 75th percentile. This means that if 75% of user experiences meet the threshold set for a given metric, then the experience is considered "good".
If you have a specific page in mind to look at the performance of, then use that. For an overall view of a site when you first start optimizing, you may wish to start with the home page, as it is typically one of the most popular pages on many sites.
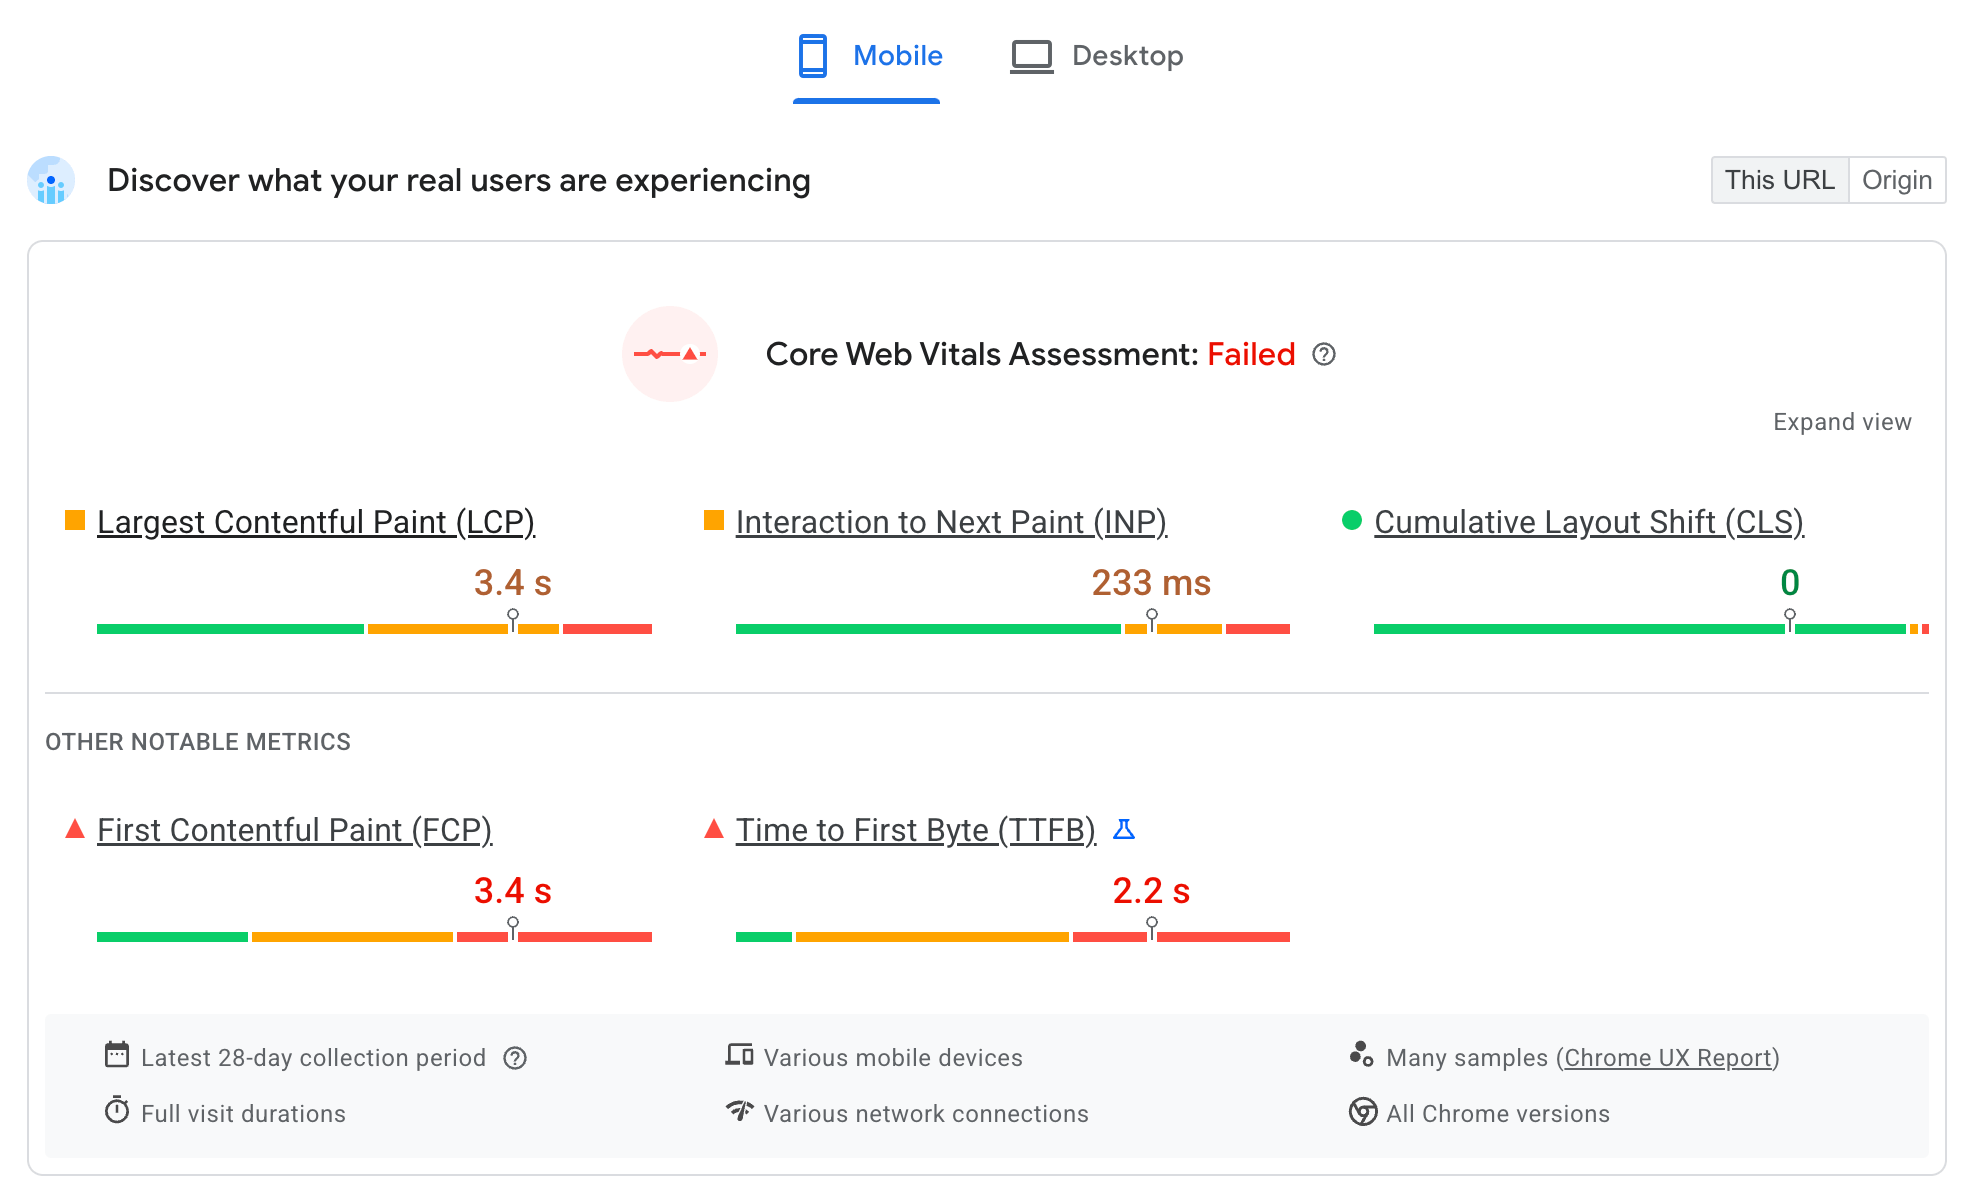
Concentrate on the what your real users are experiencing section of PSI initially. You will see up to four views of the data: mobile and desktop for the URL entered and the whole origin. Compare these and see how they differ. Mobile is typically less performant than desktop since it is a more resource-constrained device operating under potentially less stable network conditions. If the URL and origin data are significantly different, then try to understand why: home pages are often the first pages visited (that is, a landing page) so can be slower than the origin users take the full brunt of an unprimed browser cache. Subsequent pages will likely load faster, as any shared assets will be cached, bringing down the aggregate origin-level data.
PSI also shows all three Core Web Vitals (LCP, CLS, and FID) and the pending INP metric, plus the diagnostic TTFB and FCP metrics. Are any of the Core Web Vitals failing, and by how much? This will indicate where to concentrate your efforts.
Understand the relationships between these numbers—particularly for LCP. If LCP is slow, as it is in this example, then look at TTFB and FCP which are both milestones to that metric. In this example we have a 1.8 second TTFB, which is going to make it very tough to meet the 2.5 second recommended threshold for good LCP. This suggests either a slow backend (server issues or a lack of CDN), slower networks, or redirects delaying the first HTML bytes. Look at the Optimize TTFB guide for more information. FCP takes another second on top of that, which again may be indicative of slower networks. LCP is not long after FCP in this example suggesting the LCP resource is well optimized once the page itself loads.
For CLS, look at the CrUX CLS and the Lighthouse CLS scores to see if this is a load CLS issue (which Lighthouse will catch and advise on), or a post-load CLS issue that Lighthouse won't catch. More for information see the Optimize CLS guide.
For responsiveness, look at the FID and INP scores. Look at the TBT audits in Lighthouse to see if a lot of JavaScript processing is happening during the initial page load, which is likely to impact INP. INP can be a tricky metric to improve, so consult the Optimize INP guide for more information.
Identify poorly performing pages in Search Console

While PSI is useful when you have a specific URL you want to test or the site as a whole, Search Console can help target your efforts to particular types of pages. This is particularly useful if many pages share common themes or technologies and Search Console can successfully identify these.
The Core Web Vitals report in Search Console shows the big picture of your website's performance, but you can still drill down into specific pages that need attention. With Search Console, you can also:
- Identify individual page groups that need improvement, and those that currently provide a good user experience.
- Get granular data on performance by URL grouped by status, metric, and groups of similar web pages (such as product detail pages on an ecommerce website).
- Get detailed reports that bucket URLs in each user experience quality category for both mobile and desktop.
Once you have some specific pages to look at, you can use PSI as explained previously to gather further understanding of the issues for those pages.
Step 2: Debug and optimize
In step 1, you should have identified pages which require performance improvements, and also which of the Core Web Vitals metrics you want to improve. You can use the Google tooling to get further information to understand the root cause to identify the issue.
- Run a Lighthouse audit to get page-level guidance
- Use the Web Vitals extension to analyze Core Web Vitals in real time.
- Use the Performance panel in Chrome DevTools to debug performance issues and test code changes.
For more detailed guidance, see these guides:
Uncover opportunities with Lighthouse
PageSpeed Insights runs Lighthouse for you, but for local development it is also possible to run Lighthouse from Chrome DevTools, which is useful to validate fixes locally.

A key point is to validate that the Lighthouse audit replicates the issues you are trying to solve (for example, slow LCP, or CLS issues). Out of the box, Lighthouse only assesses the user experience during page load. Since it's a lab tool, it also excludes FID and INP in favor of TBT.
When the Lighthouse metrics suggest a similar problem as the one you are trying to solve, the wealth of information in its audits can help identify issues and suggest solutions.
You can filter the audits to just the Core Web Vitals you are interested in to focus on fixes for issues related to a specific metric:

For FID and INP, use the TBT audits to identify issues that can potentially affect those metrics, but be aware that without interactions, Lighthouse is limited in how much it can diagnose.
Analyze in real time with the Web Vitals extension
The Web Vitals Chrome extension shows Core Web Vitals in real time during page load and while browsing a page. Because of this, it can capture FID and INP as well as layout shifts that occur after load. The debugging options show more detailed information on each metric:
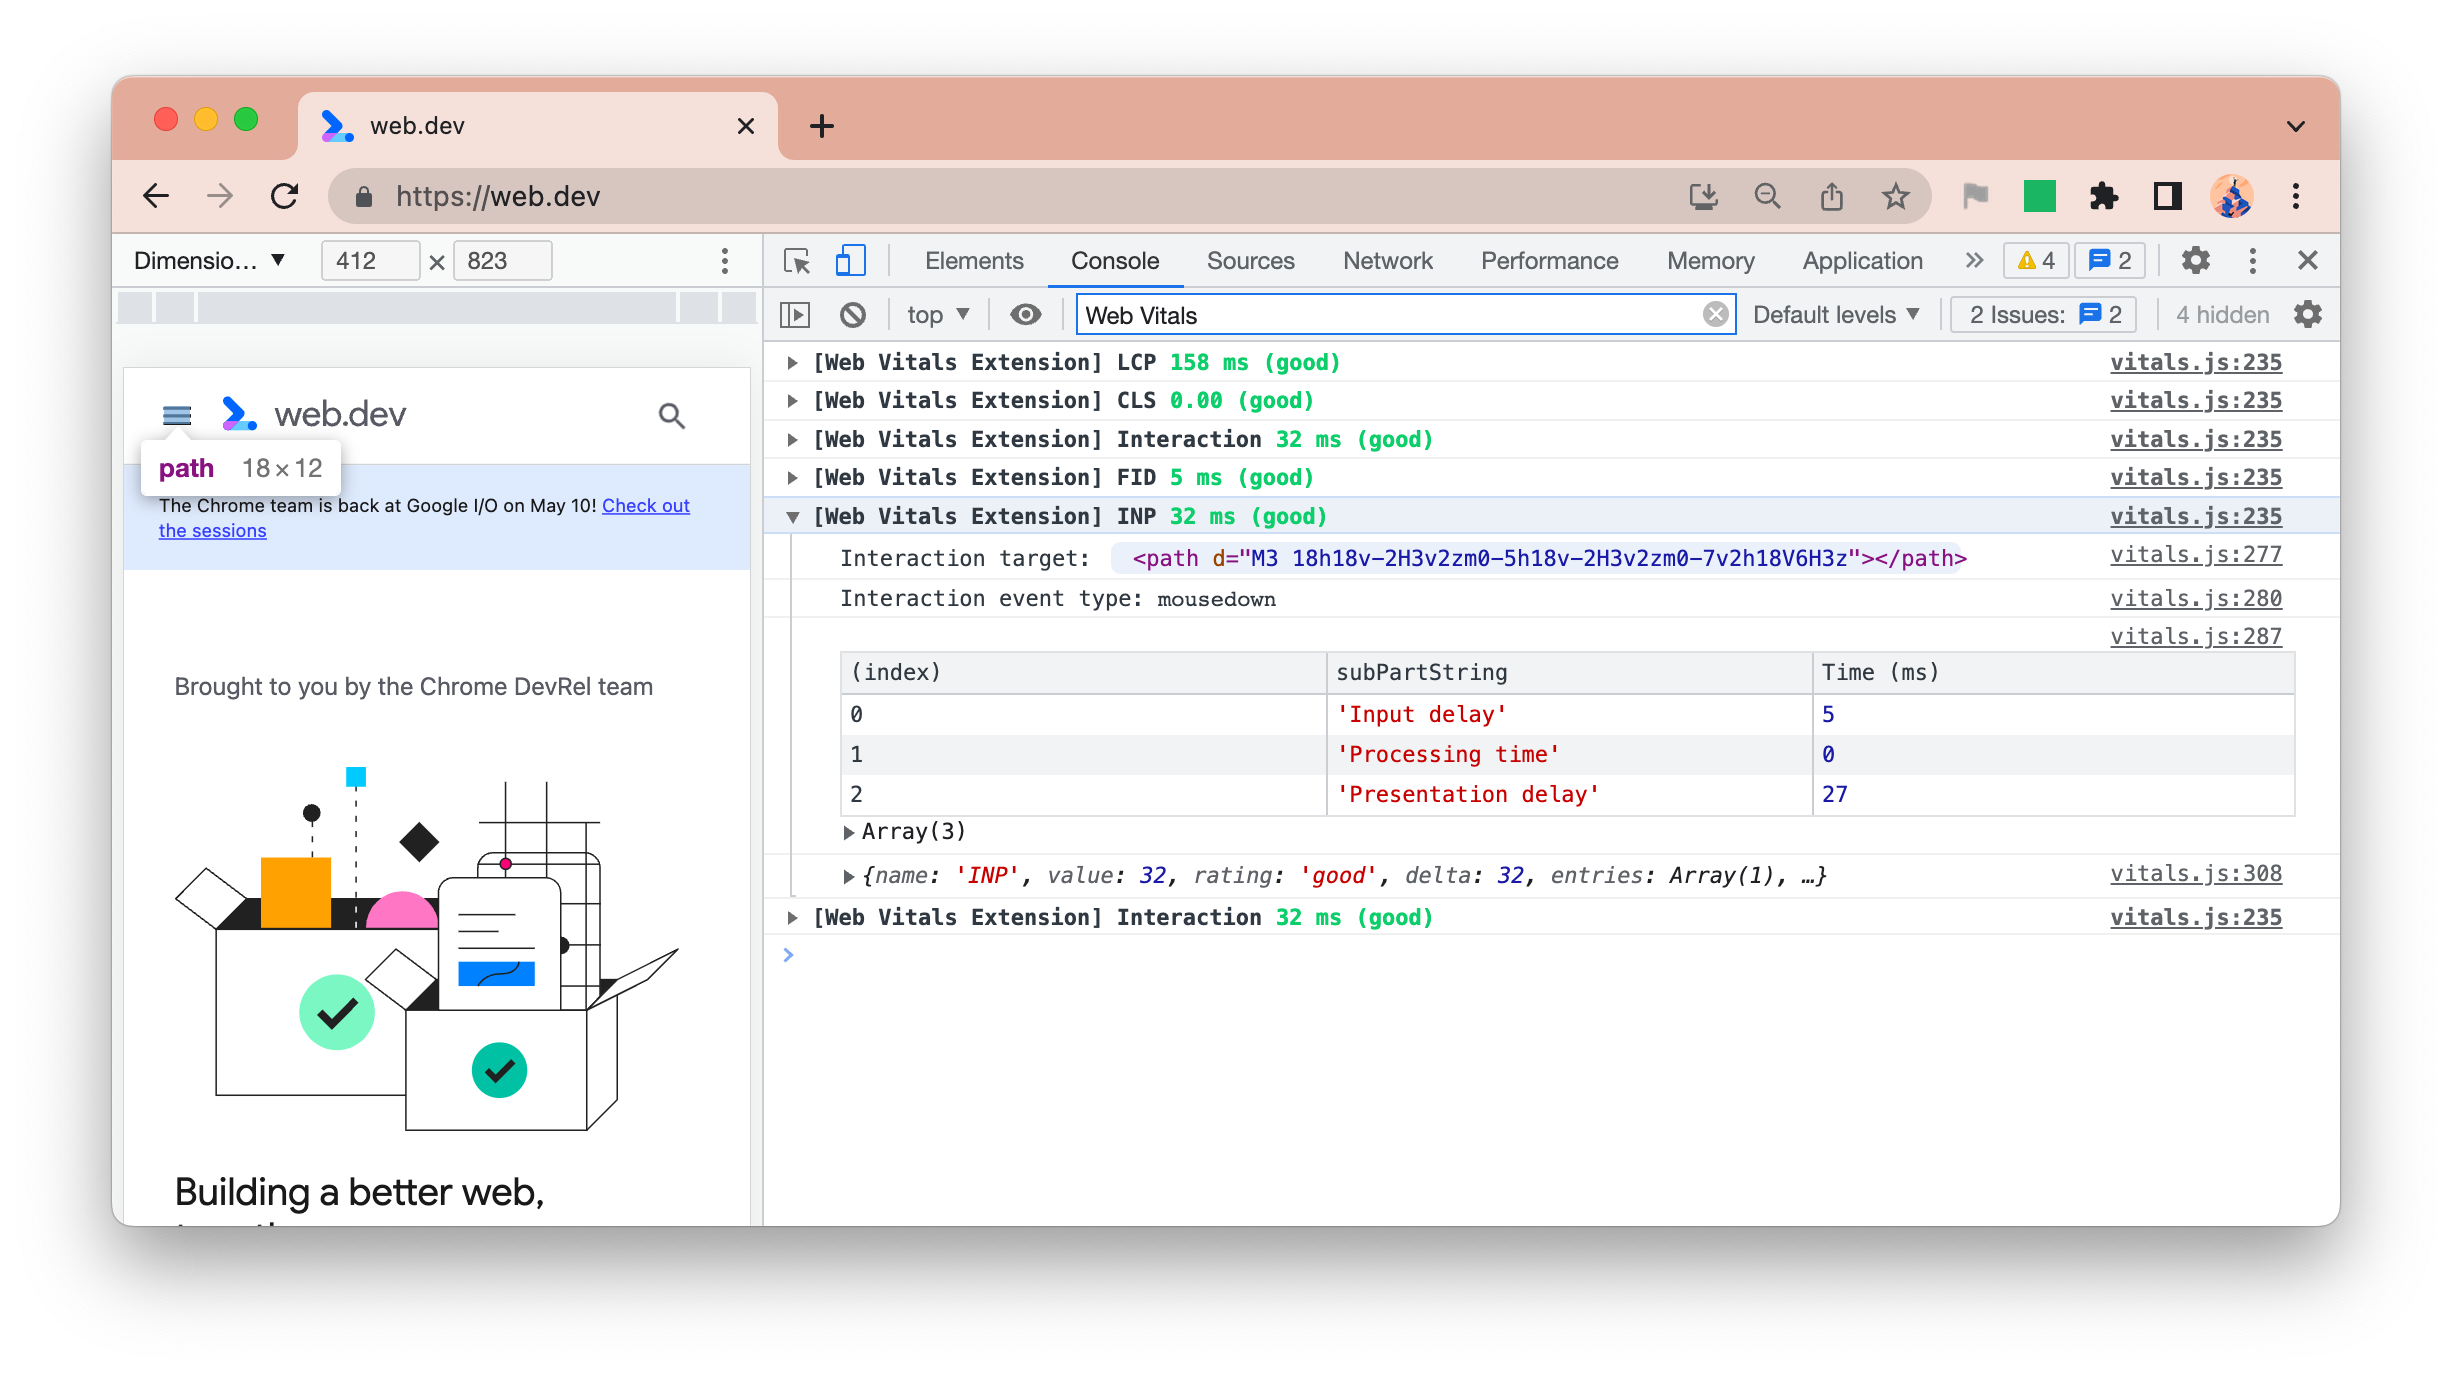
It's best to think of the Web Vitals extension as a spot-checking tool to find performance issues, not a comprehensive debugging tool—that's a job for the Performance panel in Chrome DevTools.
Drill down with the Performance panel
The Performance panel in Chrome DevTools profiles all page behavior during a recorded period of time.

Key timings—such as LCP, for example—are shown in the Timings track. Click on these for more details.
The Layout Shifts track highlights layout shifts and clicking on these provides more details about the elements that shifted for debugging CLS.
Long Tasks (that can lead to FID and INP issues) are also highlighted with red triangles.
These features—as well as information in other parts of the Performance panel—can help you determine whether fixes are having any effect on a page's Core Web Vitals.
Debug Core Web Vitals in the field
Lab tools can't always identify the cause of all Core Web Vitals issues affecting your users. This is one reason why it's so important to collect your own field data, as it takes factors into account that lab data cannot.
See debug performance in the field for more information.
Step 3: Monitor for changes
Once you have fixed any issues, you want to ensure they have the desired effect and that new issues do not disrupt your Core Web Vitals. This requires monitoring for performance issues as part of developer workflow to prevent performance issues being released to production, and monitoring the field data regularly to ensure this is the case.
Monitor for performance requisitions in Continuous Integration (CI) environments
Lighthouse-CI allows you to automatically run Lighthouse audits on code commits to prevent performance regressions entering code. This can check performance timings (which are subject to variability), or for just the performance audits, as a linting tool to prevent bad practices in the code.
View website health trends with field data
While you should aim to catch and fix all performance issues before they make it to production, monitoring your field data via RUM is essential to find any that slip through. There are many commercial RUM products available that can help with this. The web-vitals JavaScript library can automate a website's field data collection, and optionally use this data to power custom dashboards and alerting systems.
For sites without a RUM solution, you can use the CrUX Dashboard as a basic trend analysis of field data. It reports the following for sites in CrUX:
- Site overview, which segments Core Web Vitals into desktop and mobile device types.
- Historical trend by metric type, which is a distribution of metrics over time for each available monthly release of CrUX report data.
- User demographics, which illustrates the distribution of page views across an entire origin for users in each demographic including device and effective connection types.
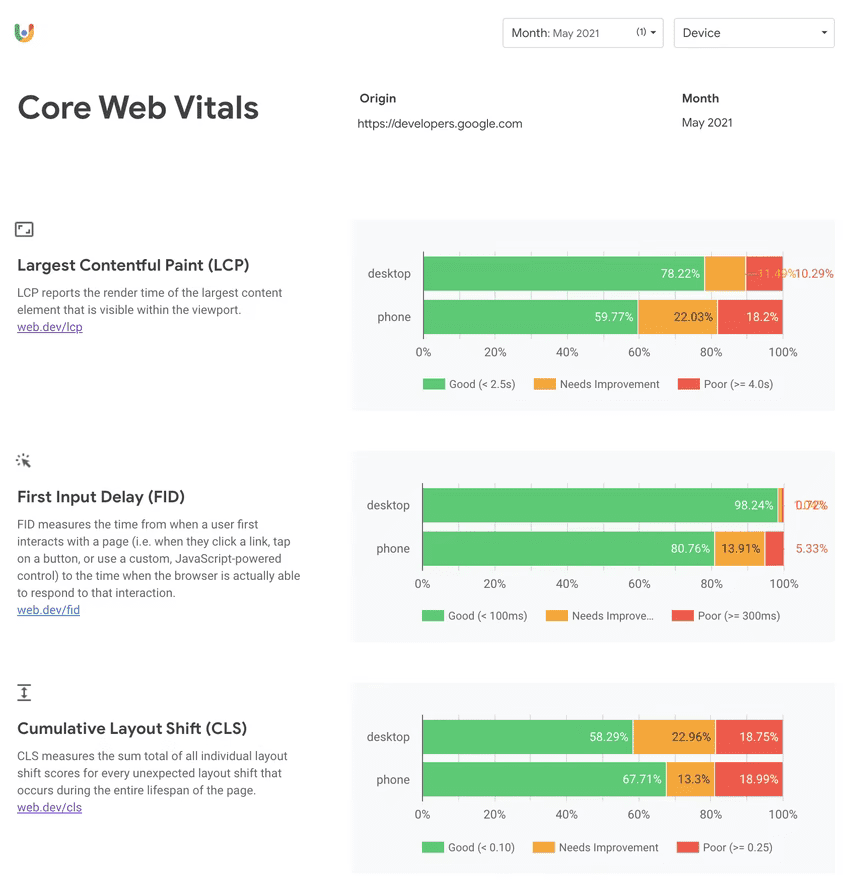
The CrUX Dashboard is based on the CrUX BigQuery dataset, which is updated once a month. This can be a good reminder to regularly check in on your Core Web Vitals.
Conclusion
Ensuring fast and delightful user experiences requires a performance-first mindset and adoption of a workflow to ensure progress. With the right tools and processes to audit, debug, and monitor, building great user experiences and staying within the thresholds defined for good Core Web Vitals is within your reach.