Learn about our thoughts on measuring responsiveness and give us feedback.
On the Chrome Speed Metrics team, we're working on deepening our understanding of how quickly web pages respond to user input. We'd like to share some ideas for improving responsiveness metrics and hear your feedback.
This post will cover two main topics:
- Review our current responsiveness metric, First Input Delay (FID), and explain why we chose FID rather than some of the alternatives.
- Present some improvements we've been considering that should better capture the end-to-end latency of individual events. These improvements also aim to capture a more holistic picture of the overall responsiveness of a page throughout its lifetime.
What is First Input Delay?
The First Input Delay (FID) metric measures how long it takes the browser to begin processing the first user interaction on a page. In particular, it measures the difference between the time when the user interacts with the device and the time when the browser is actually able to begin processing event handlers. FID is just measured for taps and key presses, which means that it only considers the very first occurrence of the following events:
clickkeydownmousedownpointerdown(only if it is followed bypointerup)
The following diagram illustrates FID:
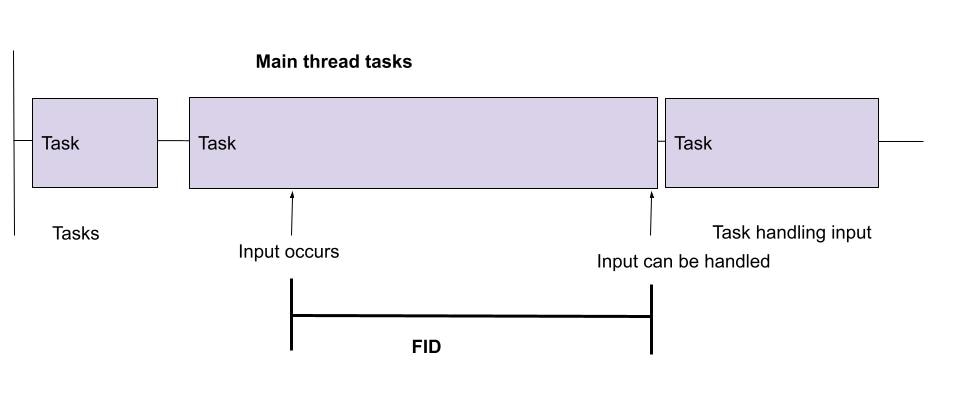
FID does not include the time spent running those event handlers, nor any work done by the browser afterwards to update the screen. It measures the amount of time the main thread was busy before having the chance to handle an input. This blocking time is usually caused by long JavaScript tasks, as these can't just be stopped at any time, so the current task must complete before the browser can start processing the input.
Why did we choose FID?
We believe it is important to measure actual user experience in order to ensure that improvements on the metric result in real benefits to the user. We chose to measure FID because it represents the part of the user experience when the user decides to interact with a site that has just been loaded. FID captures some of the time that the user has to wait in order to see a response from their interaction with a site. In other words, FID is a lower bound on the amount of time a user waits after interacting.
Other metrics like Total Blocking Time (TBT) and Time To Interactive (TTI) are based on long tasks and, like FID, also measure main thread blocking time during load. Since these metrics can be measured in both the field and the lab, many developers have asked why we don't prefer one of these over FID.
There are several reasons for this. Perhaps the most important reason is that these metrics do not measure the user experience directly. All of these metrics measure how much JavaScript runs on the page. While long running JavaScript does tend to cause problems to sites, these tasks don't necessarily impact the user experience if the user is not interacting with the page when they occur. A page can have a great score on TBT and TTI but feel slow or it can have a poor score while feeling fast for users. In our experience, these indirect measurements result in metrics that work great for some sites but not for most sites. In short, the fact that long tasks and TTI are not user-centric makes these weaker candidates.
While lab measurement is certainly important and an invaluable tool for diagnostics, what really matters is how users experience sites. By having a user-centric metric that reflects real-user conditions, you are guaranteed to capture something meaningful about the experience. We decided to start with a small portion of that experience, even though we know this portion is not representative of the full experience. This is why we're working on capturing a larger chunk of the time a user waits for their inputs to be handled.
Measuring TTI on real users in the field is problematic because it occurs very late in the page load. A 5-second network quiet window is required before TTI can even be computed. In the lab, you can choose to unload the page whenever you have all the data that you need, but that's not the case with real-user monitoring in the field. A user may choose to leave the page or interact with it at any time. In particular, users may choose to leave pages that take a long time to load, and an accurate TTI will not be recorded in those cases. When we measured TTI for real users in Chrome, we found that only about half of page loads reached TTI.
What improvements are we considering?
We would like to develop a new metric that extends what FID measures today yet still retains its strong connection to user experience.
We want the new metric to:
- Consider the responsiveness of all user inputs (not just the first one)
- Capture each event's full duration (not just the delay).
- Group events together that occur as part of the same logical user interaction and define that interaction's latency as the max duration of all its events.
- Create an aggregate score for all interactions that occur on a page, throughout its full lifecycle.
To be successful, we should be able to say with high confidence that if a site scores poorly on this new metric, it is not responding quickly to user interactions.
Capture the full event duration
The first obvious improvement is to try to capture broader end-to-end latency of an event. As mentioned above, FID only captures the delay portion of the input event. It does not account for the time it takes the browser to actually process the event handlers.
There are various stages in the lifecycle of an event, as illustrated in this diagram:
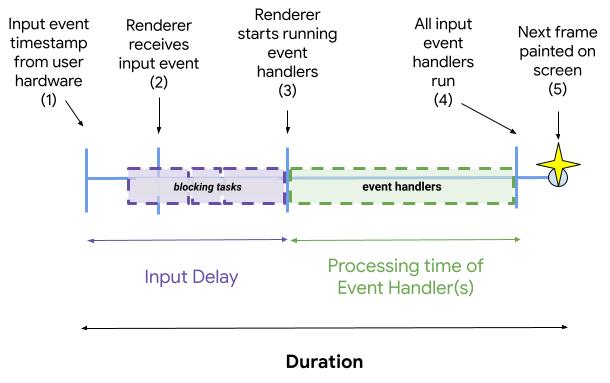
The following are steps Chrome takes to process an input:
- The input from the user occurs. The time at which this occurs is the event's
timeStamp. - The browser performs hit testing to decide which HTML frame (main frame or some iframe) an event belongs to. Then the browser sends the event to the appropriate renderer process in charge of that HTML frame.
- The renderer receives the event and queues it so that it can process when it becomes available to do so.
- The renderer processes the event by running its handlers. These handlers may queue additional
asynchronous work, such as
setTimeoutand fetches, that are part of the input handling. But at this point, the synchronous work is complete. - A frame is painted to the screen that reflects the result of event handlers running. Note that any asynchronous tasks queued by the event handlers may still be unfinished.
The time between steps (1) and (3) above is an event's delay, which is what FID measures.
The time between steps (1) and (5) above is an event's duration. This is what our new metric will measure.
The event's duration includes the delay, but it also includes the work occurring in event handlers and the work the browser needs to do to paint the next frame after those handlers have run. The duration of an event is currently available in the Event Timing API via the entry's duration attribute.
Ideally we would love to also capture asynchronous work triggered by the event. But the problem is
that the definition of asynchronous work triggered by the event is extremely tricky to get right. As
an example, a developer may choose to begin some animation on event handlers and use a setTimeout
to begin such animation. If we captured all tasks posted on the handlers, the animation would delay
the completion time for as long as the animation runs. We believe it is worthwhile to investigate
options on how to use heuristics to capture work that is asynchronous and which should be completed
ASAP. However, we want to be really careful when doing so because we don't want to penalize work
that is meant to take a long time to be finished. Thus, our initial effort will look at step 5 as
the end point: it will only consider synchronous work and the amount of time it takes to paint after
such work is completed. That is, we're not going to apply heuristics to guess the work that would be
kicked off asynchronously in step 4 in our initial effort.
It's worth noting that, in many cases, work should be executed synchronously. In fact, this may be
unavoidable because events are sometimes dispatched one after the other and the event handlers need
to be executed in order. That said, we will still miss important work, like events which trigger
fetching or which rely on important work to be done at the next requestAnimationFrame callback,
for example.
Group events into interactions
Extending the metric measurement from delay to duration is a good first step, but it still leaves a critical gap in the metric: it focuses on individual events and not the user experience of interacting with the page.
Many different events can fire as a result of a single user interaction, and separately measuring each doesn't build a clear picture of what the user experiences. We want to make sure our metric captures the full amount of time a user has to wait for a response when tapping, pressing keys, scrolling, and dragging as accurately as possible. So we're introducing the concept of interactions to measure the latency of each.
Interaction types
The following table lists the four interactions we want to define along with the DOM events that they're associated with. Note that this is not quite the same as the set of all events that are dispatched when such user interaction occurs. For instance, when a user scrolls, a scroll event is dispatched, but it happens after the screen has been updated to reflect the scrolling, so we don't consider it part of the interaction latency.
| Interaction | Start / end | Desktop events | Mobile events |
|---|---|---|---|
| Keyboard | Key pressed | keydown |
keydown |
keypress |
keypress |
||
| Key released | keyup |
keyup |
|
| Tap or drag | Tap start or drag start | pointerdown |
pointerdown |
mousedown |
touchstart |
||
| Tap up or drag end | pointerup |
pointerup |
|
mouseup |
touchend |
||
click |
mousedown |
||
mouseup |
|||
click |
|||
| Scroll | N/A | ||
The first three interactions listed above (keyboard, tap, and drag) are currently covered by FID. For our new responsiveness metric, we want to include scrolling as well, since scrolling is extremely common on the web and is a critical aspect of how responsive a page feels to users.
Note that each of these interactions has two parts: when the user presses the mouse, finger, or key down and when they lift it up. We need to ensure our metric doesn't count time the user spends holding the finger down between these two actions as part of the page's latency!
Keyboard
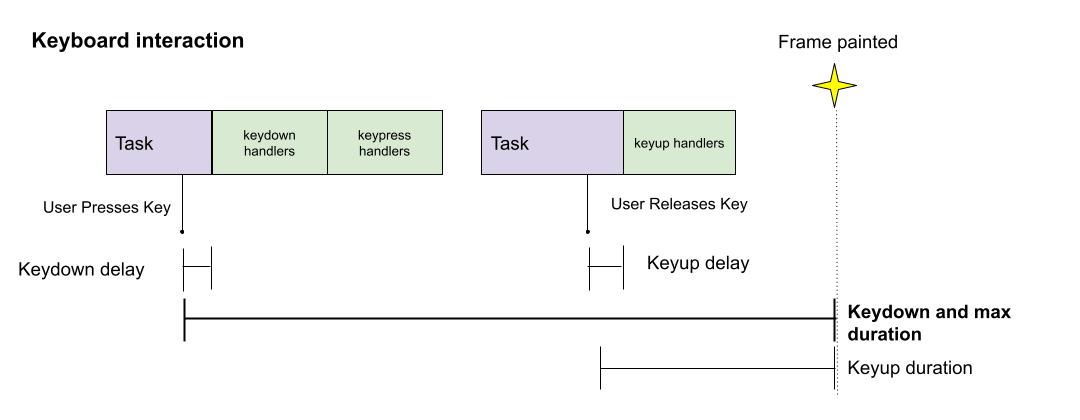
A keyboard interaction has two parts to it: when the user presses the key and when they release it.
There are three associated events with this user interaction: keydown, keyup, and keypress.
The following diagram illustrates the keydown and keyup delays and durations for a keyboard
interaction:
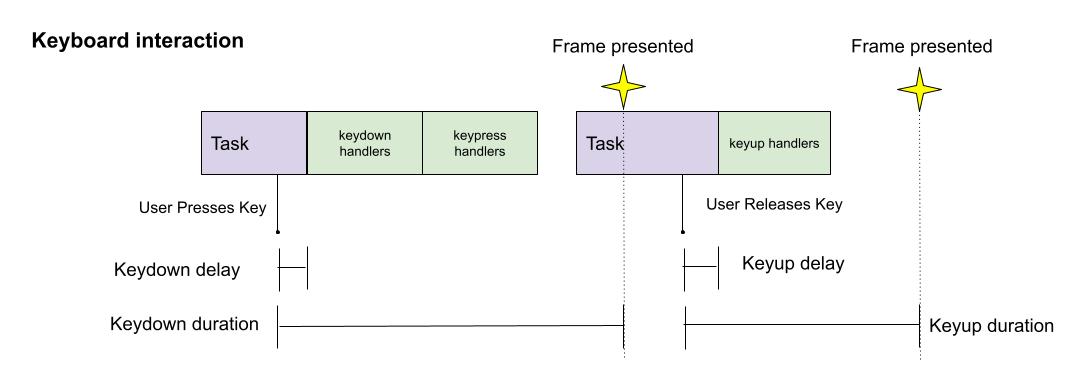
In the diagram above, the durations are disjoint because the frame from keydown updates is
presented before the keyup occurs, but this does not need to be the case always. In addition, note
that a frame can be presented in the middle of a task in the renderer process since the last steps
required to produce the frame are done outside of the renderer process.
The keydown and keypress occur when the user presses the key, while the keyup occurs when the
user releases the key. Generally the main content update occurs when the key is pressed: text
appears on the screen, or the modifier effect is applied. That said, we want to capture the more
rare cases where keyup would also present interesting UI updates, so we want to look at the
overall time taken.
In order to capture the overall time taken by the keyboard interaction, we can compute the maximum
of the duration of the keydown and the keyup events.
There is an edge case here worth mentioning: there may be cases where the user presses a key and
takes a while to release it. In this case, the sequence of events dispatched can
vary. In
these cases, we would consider there to be one interaction per keydown, which may or may not have
a corresponding keyup.
Tap
Another important user interaction is when the user taps or clicks on a website. Similar to
keypress, some events are fired as the user presses down, and others as they release, as shown in
the diagram above, Note the events associated with a tap are a little different on desktop vs
mobile.
For a tap or click, the release is generally the one which triggers the majority of reactions, but, as with keyboard interactions, we want to capture the full interaction. And in this case it's more important to do so because having some UI updates upon tap press is not actually that uncommon.
We'd like to include the event durations for all of these events, but as many of them overlap
completely, we need to measure just pointerdown, pointerup, and click to cover the full
interaction.
pointerdown and pointerup?One initial thought would be to use the pointerdown and pointerup events and assume that they
cover all of the durations that we're interested in. Sadly, this is not the case, as this edge
case shows. Try opening this site on mobile, or with mobile
emulation, and tapping where it says "Click me". This site triggers the browser tap
delay. It can be seen
that the pointerdown, pointerup, and touchend are dispatched quickly, whereas the mousedown,
mouseup, and click wait for the delay before being dispatched. This means that if we only looked
at pointerdown and pointerup then we'd miss the duration from the synthetic events, which is
large due to the browser tap delay and should be included. So we should measure pointerdown,
pointerup, and click to cover the full interaction.
Drag
We decided to include dragging as well since it has similar associated events and since it generally
causes important UI updates to sites. But for our metric we intend to only consider the drag start
and the drag end - the initial and final parts of the drag. This is to make it easier to reason
about as well as make the latencies comparable with the other interactions considered. This is
consistent with our decision to exclude continuous events such as mouseover.
We're also not considering drags implemented via the Drag and Drop API because they only work on desktop.
Scrolling
One of the most common forms of interacting with a site is via scrolling. For our new metric, we'd like to measure the latency for the initial scrolling interaction of the user. In particular, we care about the initial reaction of the browser to the fact that the user requested a scroll. We will not cover the whole scrolling experience. That is, scrolling produces many frames, and we'll focus our attention on the initial frame produced as a reaction to the scroll.
Why just the first one? For one, subsequent frames may be captured by a separate smoothness proposal. That is, once the user has been shown the first result of scrolling, the rest should be measured in terms of how smooth the scrolling experience feels. Therefore, we think that the smoothness effort could better capture this. So, as with FID, we choose to stick to discrete user experiences: user experiences that have clear points in time associated with them and for which we can easily compute their latency. Scrolling as a whole is a continuous experience, so we do not intend to measure all of it in this metric.
So why measure scrolls? The scrolling performance we've gathered in Chrome shows that scrolling is generally very fast. That said, we still want to include initial scroll latencies in our new metric for various reasons. First, scrolling is fast only because it has been optimized so much, because it is so important. But there are still ways for a website to bypass some of the performance gains that the browser offers. The most common one in Chrome is to force scrolling to happen on the main thread. So our metric should be able to say when this happens and causes poor scrolling performance for users. Second, scrolling is just too important to ignore. We worry that if we exclude scrolling then we'll have a big blindspot, and scrolling performance could decrease over time without web developers properly noticing.
There are several events that are dispatched when a user scrolls, such as touchstart, touchmove,
and scroll. Except for the scroll event, this is largely dependent on the device used for
scrolling: touch events are dispatched when scrolling with the finger on mobile devices, while wheel
events occur when scrolling with a mouse wheel. The scroll events are fired after initial scrolling
has completed. And in general, no DOM event blocks scrolling, unless the website uses non-passive
event listeners. So we think of scrolling as decoupled from DOM
Events altogether. What we want to measure is the time from when the user moves enough to produce a
scroll gesture until the first frame that shows that scrolling happened.
How to define the latency of an interaction?
As we noted above, interactions that have a "down" and "up" component need to be considered separately in order to avoid attributing the time the user spent holding their finger down.
For these types of interactions, we'd like the latency to involve the durations of all events
associated with them. Since event durations for each "down" and "up" part of the interaction can
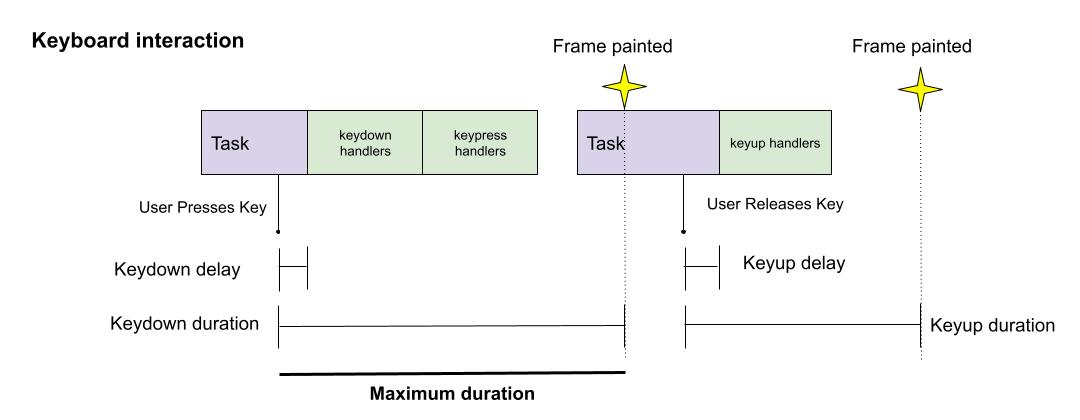
overlap, the simplest definition of interaction latency that achieves this is the maximum duration
of any event associated with it. Referring back to the keyboard diagram from earlier, this would be
the keydown duration, as it is longer than the keyup:
The keydown and keyup durations may overlap as well. This may happen for instance when the frame
presented for both events is the same, as in the following diagram:
There's are pros and cons to this approach of using the maximum, and we're interested in hearing your feedback:
- Pro: It is aligned with how we intend to measure scroll in that it only measures a single duration value.
- Pro: It aims to reduce noise for cases like keyboard interactions, where the
keyupusually does nothing and where the user may execute the key press and release quickly or slowly. - Con: It does not capture the full wait time of the user. For instance, it will capture the start or end of a drag, but not both.
For scrolling (which just has a single associated event) we'd like to define its latency as the time
it takes for the browser to produce the first frame as a result of scrolling. That is, the latency
is the delta between the event timeStamp of the first DOM event (like touchmove, if using a
finger) that is large enough to trigger a scroll and the first paint which reflects the scrolling
taking place.
Aggregate all interactions per page
Once we've defined what the latency of an interaction is, we'll need to compute an aggregate value for a page load, which may have many user interactions. Having an aggregated value enables us to:
- Form correlations with business metrics.
- Evaluate correlations with other performance metrics. Ideally, our new metric will be sufficiently independent that it adds value to the existing metrics.
- Easily expose values in tooling in ways that are easy to digest.
In order to perform this aggregation we need to solve two questions:
- What numbers do we try to aggregate?
- How do we aggregate those numbers?
We're exploring and evaluating several options. We welcome your thoughts on this aggregation.
One option is to define a budget for the latency of an interaction, which may depend on the type (scroll, keyboard, tap, or drag). So for example if the budget for taps is 100 ms and the latency of a tap is 150 ms then the amount over budget for that interaction would be 50 ms. Then we could compute the maximum amount of latency that goes over the budget for any user interaction in the page.
Another option is to compute the average or median latency of the interactions throughout the life of the page. So if we had latencies of 80 ms, 90 ms, and 100 ms, then the average latency for the page would be 90 ms. We could also consider the average or median "over budget" to account for different expectations depending on the type of interaction.
How does this look like on web performance APIs?
What's missing from Event Timing?
Unfortunately not all of the ideas presented in this post can be captured using the Event Timing
API. In particular, there's no simple way to know the events associated with a given user
interaction with the API. In order to do this, we've proposed adding an interactionID to the
API.
Another shortcoming of the Event Timing API is that there is no way to measure the scroll interaction, so we're working on enabling these measurements (via Event Timing or a separate API).
What can you try right now?
Right now, it is still possible to compute the maximum latency for taps/drags and for keyboard interactions. The following code snippet would produce these two metrics.
let maxTapOrDragDuration = 0;
let maxKeyboardDuration = 0;
const observer = new PerformanceObserver(list => {
  list.getEntries().forEach(entry => {
    switch(entry.name) {
      case "keydown":
      case "keyup":
        maxKeyboardDuration = Math.max(maxKeyboardDuration,
            entry.duration);
        break;
      case "pointerdown":
      case "pointerup":
      case "click":
        maxTapOrDragDuration = Math.max(maxTapOrDragDuration,
            entry.duration);
        break;
    }
  });
});
observer.observe({type: "event", durationThreshold: 16, buffered: true});
// We can report maxTapDragDuration and maxKeyboardDuration when sending
// metrics to analytics.
Feedback
Let us know what you think about these ideas by emailing: web-vitals-feedback@googlegroups.com!


