
Introduction
It doesn’t matter if you’re using a 2D or WebGL context, anyone who has ever worked with the <canvas> element knows that it can be extremely difficult to debug. Working with a canvas usually involves a long and difficult-to-follow list of calls:
function draw() {

  context.clearRect(0, 0, 258, 258);
  context.fillStyle = "#EEEEEE";
  context.beginPath();
  context.arc(129, 129, 127, 0, 6.28, true);
  context.closePath();
  context.fill();

  // … and on and on
}
Sometimes you want to capture the instructions sent to a canvas context and step through them one by one. Fortunately there is a new Canvas Inspection feature in Chrome’s DevTools that lets us do just that!
In this article I will be showing you how to use this feature to start debugging your canvas work. The inspector supports both 2D and WebGL contexts, so no matter which one you're using, you should be able to get useful debugging information straight away.
Getting Started
To get started, go to about:flags in Chrome and toggle on “Enable Developer Tools experiments”

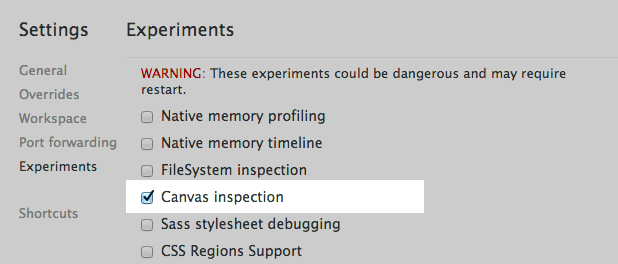
Next, head over to DevTools and hit the cog ![]() in the lower right corner. From there you can go to Experiments and enable Canvas inspection:
in the lower right corner. From there you can go to Experiments and enable Canvas inspection:
For the changes to take effect, you need to close and reopen DevTools (you can use Alt+R or Option+R, a handy alternative).
When DevTools reopens, go to the Profiles section and you'll see a new Canvas Profiler option.
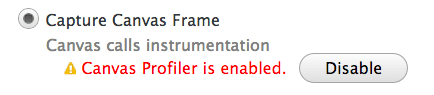
To begin with you will notice that the Canvas Profiler is disabled. Once you have a page that contains a canvas you want to debug simply press Enable and the page will reload ready to capture the <canvas> calls:
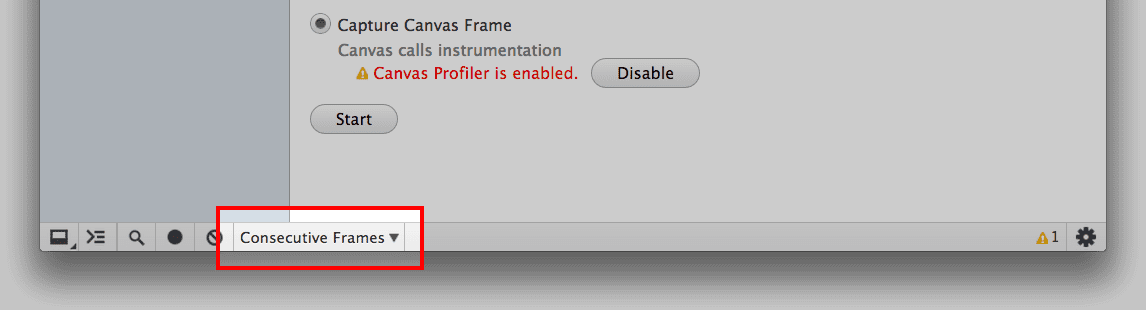
You’ll need to decide whether you would like to capture a single frame, or consecutive frames, where a frame is exactly the same as you would see in the DevTools Timeline.
Single frame captures the calls until the end of the current frame then stops. Consecutive frames, on the other hand, captures all frames of all <canvas> elements until you tell it to stop. Which mode you choose depends on how you're using the <canvas> element. For an ongoing animation, you might want to capture a single frame. For a brief animation that occurs in response to a user event, you may need to capture consecutive frames.
With that we’re all set up and ready to start capturing!
Capturing frames
To capture you simply press Start and then interact with your application as you normally would. After some time head back over to DevTools and, if you’re capturing consecutively, press Stop.
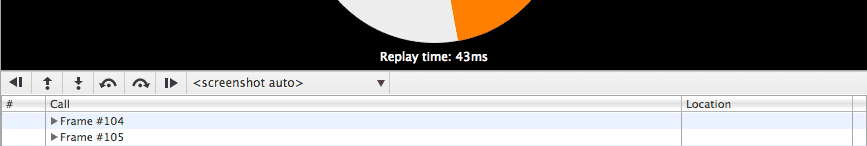
Now you have a shiny new profile in the list on the left, complete with the number of captured context calls across all <canvas> elements. Click on the profile and you’ll see a screen that looks something like this:
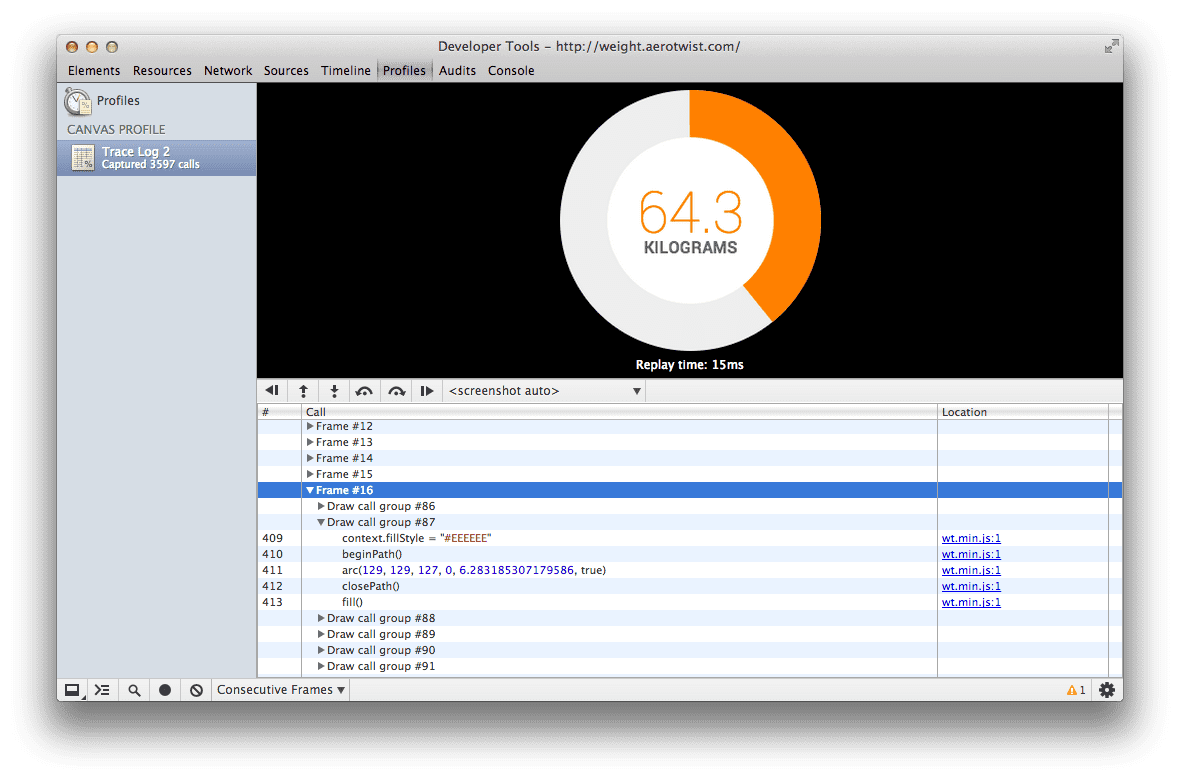
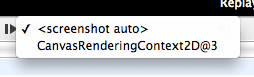
In the lower pane you’ll see a list of all the captured frames you can step through and, as you click on each, the screenshot at the top will show you the <canvas> element’s state at the end of that frame. If you have multiple <canvas> elements you can choose which one is shown using the menu just below the screenshot.
Inside the frame you will see draw call groups. Each draw call group contains a single draw call, which will be the last call in the group. So what’s a draw call? For a 2D context that would be things like clearRect(), drawImage(), fill(), stroke(), putImageData() or any text rendering functions, and for WebGL it would be clear(), drawArrays() or drawElements(). It’s essentially anything that would change the current drawing buffer’s contents. (If you’re not into graphics you can think of a buffer as a bitmap with pixels that we're manipulating.)
Now all you do is step through the list. You can do that at the frame, draw call group or call level. Whichever way you choose to step through the list (and there are buttons just below the screenshot that help you navigate quickly) you’ll see the context at that point, meaning you can quickly find and fix bugs as they crop up.
Spot the difference
Another useful feature is the ability to see which properties and variables have changed between two calls.
To see that you simply click on the sidebar button (![]() ) and a new view will pop out. As you step through the draw calls you will see the properties that have been updated. Any buffers or arrays will display their contents if you hover over them.
) and a new view will pop out. As you step through the draw calls you will see the properties that have been updated. Any buffers or arrays will display their contents if you hover over them.
Be heard!
So now you know how to debug your canvas work in Chrome’s DevTools. If you have feedback on the Canvas Profiler tool, please do file a bug or post to the Chrome DevTools Group. Let us know if you find any bugs or if there’s anything else you would like to see when inspecting a <canvas>, because it’s really only through developer use and feedback that Chrome’s tools get better.