
Finding correlation between site performance and business metrics was the key to driving the success of their optimization efforts.

Swappie is a successful start-up that sells refurbished phones. For a few years they prioritized adding new features over site performance, however when they noticed that business results on the mobile site were lagging behind the desktop version, a shift happened. They focused on optimizing performance and soon saw an uptick in mobile revenue.
42%
Increase in revenue coming from mobile visitors
10pp*
*percentage point Rel mCvR increase
Highlighting the opportunity
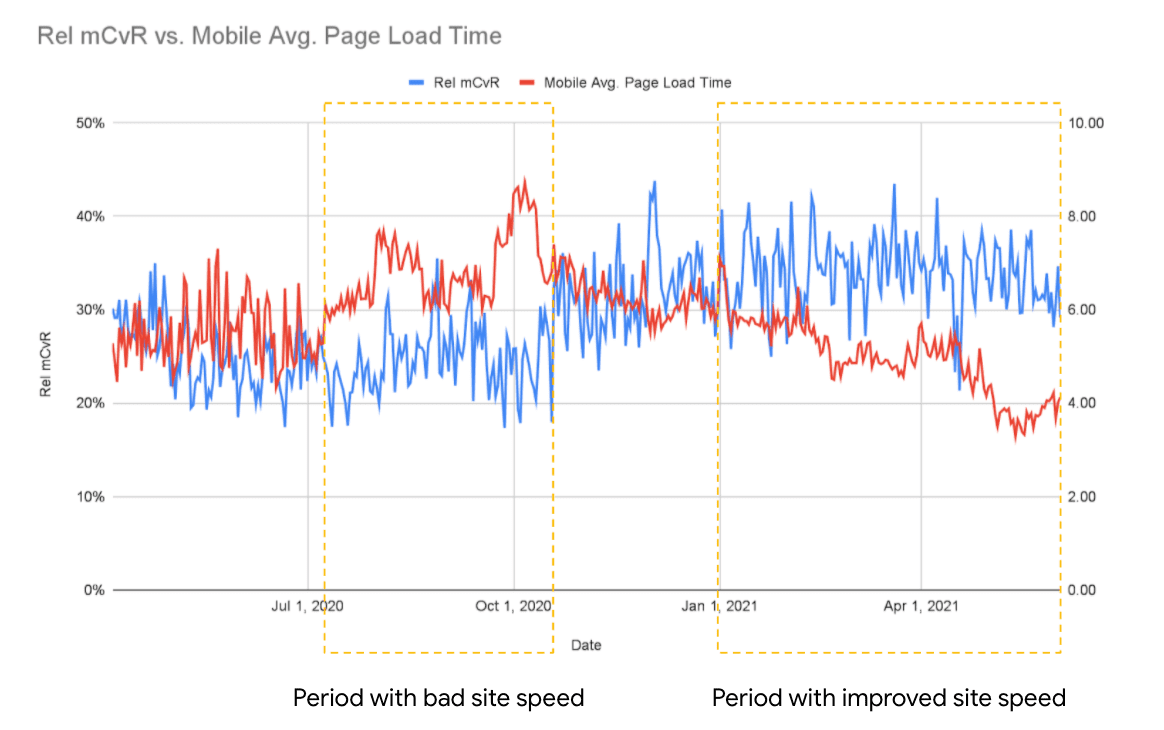
Relative Mobile Conversion Rate (Rel mCvR) is calculated by dividing the Mobile Conversion Rate with the Desktop Conversion Rate. There are many opportunities for tracking speed metrics, but connecting them to business metrics can be quite tricky. Since the same campaigns and seasonalities reach both mobile and desktop, the Rel mCvR metric strips away the influence of these external parameters, and only shows if the mobile site is improving or not.
The average for the ten biggest e-commerce sites in the United States is a Rel mCvR of 50%, but Swappie was at 24%. This indicated that the mobile site had challenges and that the company was missing out on revenue, which led to launching the performance improvement project.
Measuring the impact of performance improvements
Swappie used Google Analytics to set up daily tracking of Rel mCvR and Mobile Average Page Load Time, using this template spreadsheet. (Read the instructions for how to use the spreadsheet.) They also started tracking Core Web Vitals through Google Analytics and BigQuery. With tracking in place, the developers started working on site performance.
After only three months of work, the impact was clear–Rel mCvR went from 24% to 34% and mobile revenue had increased 42%!
23%
Lower average page load time
55%
Lower LCP
91%
Lower CLS
90%
Lower FID
Optimizations
Optimizing for LCP and CLS
Swappie's development team found that there was lots of room for improvement of small things that were overlooked for a long time. Studying the site on different viewports, and in different languages, highlighted issues with LCP and CLS that were easy to solve and had a big impact on overall performance. For example, rendering the LCP element on the server instead of the client when possible led to decreased LCP.
Detecting layout shifts was challenging, since they might vary a lot based on the viewport and connection. After getting Core Web Vitals from users to their analytics, they knew they were on the right track as CLS had decreased.
Images
Images were optimised with preloading, lazy loading and proper sizing. They preload major images (for example LCP), while loading images outside of the viewport only when needed.
Fonts
Swappie optimised fonts by switching providers. This made a big impact as they needed an optimal way to handle typefaces required by different languages.
Third-party scripts
Swappie put a lot of effort into reviewing each third-party script and widget, where it was used, and the functionalities it provided. After discussions with all the stakeholders, they made plans to reduce the scripts' impact on the site, while keeping the functionalities. They removed what was unnecessary and optimized the rest, significantly decreasing the amount of third-party JavaScript on the site.
Removing unused code and optimizing bundling
Optimising imports and removing unused JS and CSS contributed small improvements to Swappie's site performance, however those small improvements add up over time. They also optimised their bundling setup.
Creating a performance culture at Swappie
The result Swappie achieved stems not only from the changes in the code, but also the changes in the organization and its priorities.
The engineering lead, Teemu Huovinen, explains:
You need to link site speed to business metrics to truly highlight the importance of it. It all comes down to prioritisation when you're short on time and resources, which is always the case. Prioritising customer value is the way to go, but it's all too easy to focus on new features and more direct conversion improvements if you see site speed as only improving the "feel" of the site. Linking site speed to business metrics is not always easy, and that's where the calculation with Rel mCvR helped us a lot.
Teemu Huovinen
Once the team of developers was given the opportunity to focus completely on site speed for a quarter, they were more motivated to dive deeper.
Combining our impact with our team's growth is what makes it even more impressive. Four of our seven developers had started within the month when we began working on performance. All credit to the team, it's truly amazing how we were able to rally around the topic and have such great impact.
Teemu Huovinen
Teemu also points out the importance of spending time at the start to make data-informed plans, learning how to use the DevTools Performance tab, and setting up user analytics before making any improvements. Graphs (especially the ones going in the right direction) are a great source of feedback and validation for your work! Looking at Core Web Vitals in the field alongside Lighthouse (lab-based) scores helped them focus on optimizing the right things that would affect the most people.