
A case study of changes GoDaddy implemented to improve website performance for millions of sites, helping them to achieve good PageSpeed Insights and Core Web Vitals scores.

GoDaddy is the world's largest services platform for entrepreneurs around the globe. We're on a mission to empower our worldwide community of over 20 million customers—and entrepreneurs everywhere—by giving them all the help and tools they need to grow online.
In 2019 GoDaddy launched Websites + Marketing with a commitment to deliver tools and services that are easy to use and help business owners achieve their goals. Websites + Marketing integrates website building with marketing and eCommerce tools and pairs them with best-in-class guidance to help customers achieve success with their new ventures.
Since the launch of Websites + Marketing, performance has been an important part of the product and something that has been monitored and worked on actively. In this article, we will review GoDaddy's journey from using lab performance testing to using real world data with Core Web Vitals, and the series of improvements made to the product to get a very high pass rate for our customer's sites.
Tracking performance with Lighthouse
We have relied on Lighthouse data for performance tracking. Every time a website is published on the platform, we measure its performance using our internal tool named "Lighthouse4u", which provides Google Lighthouse as a service https://github.com/godaddy/lighthouse4u. This gave us a good indication of how sites were generally performing in a lab setting.
Because the millions of sites we host on our platform have a wide range of features and content, it was important to combine performance data with metadata about each site being tested (such as template used, type of widgets rendered, and so on). This allowed us to draw conclusions on what website features had lower performance, while also providing insight for where to look for improvements.
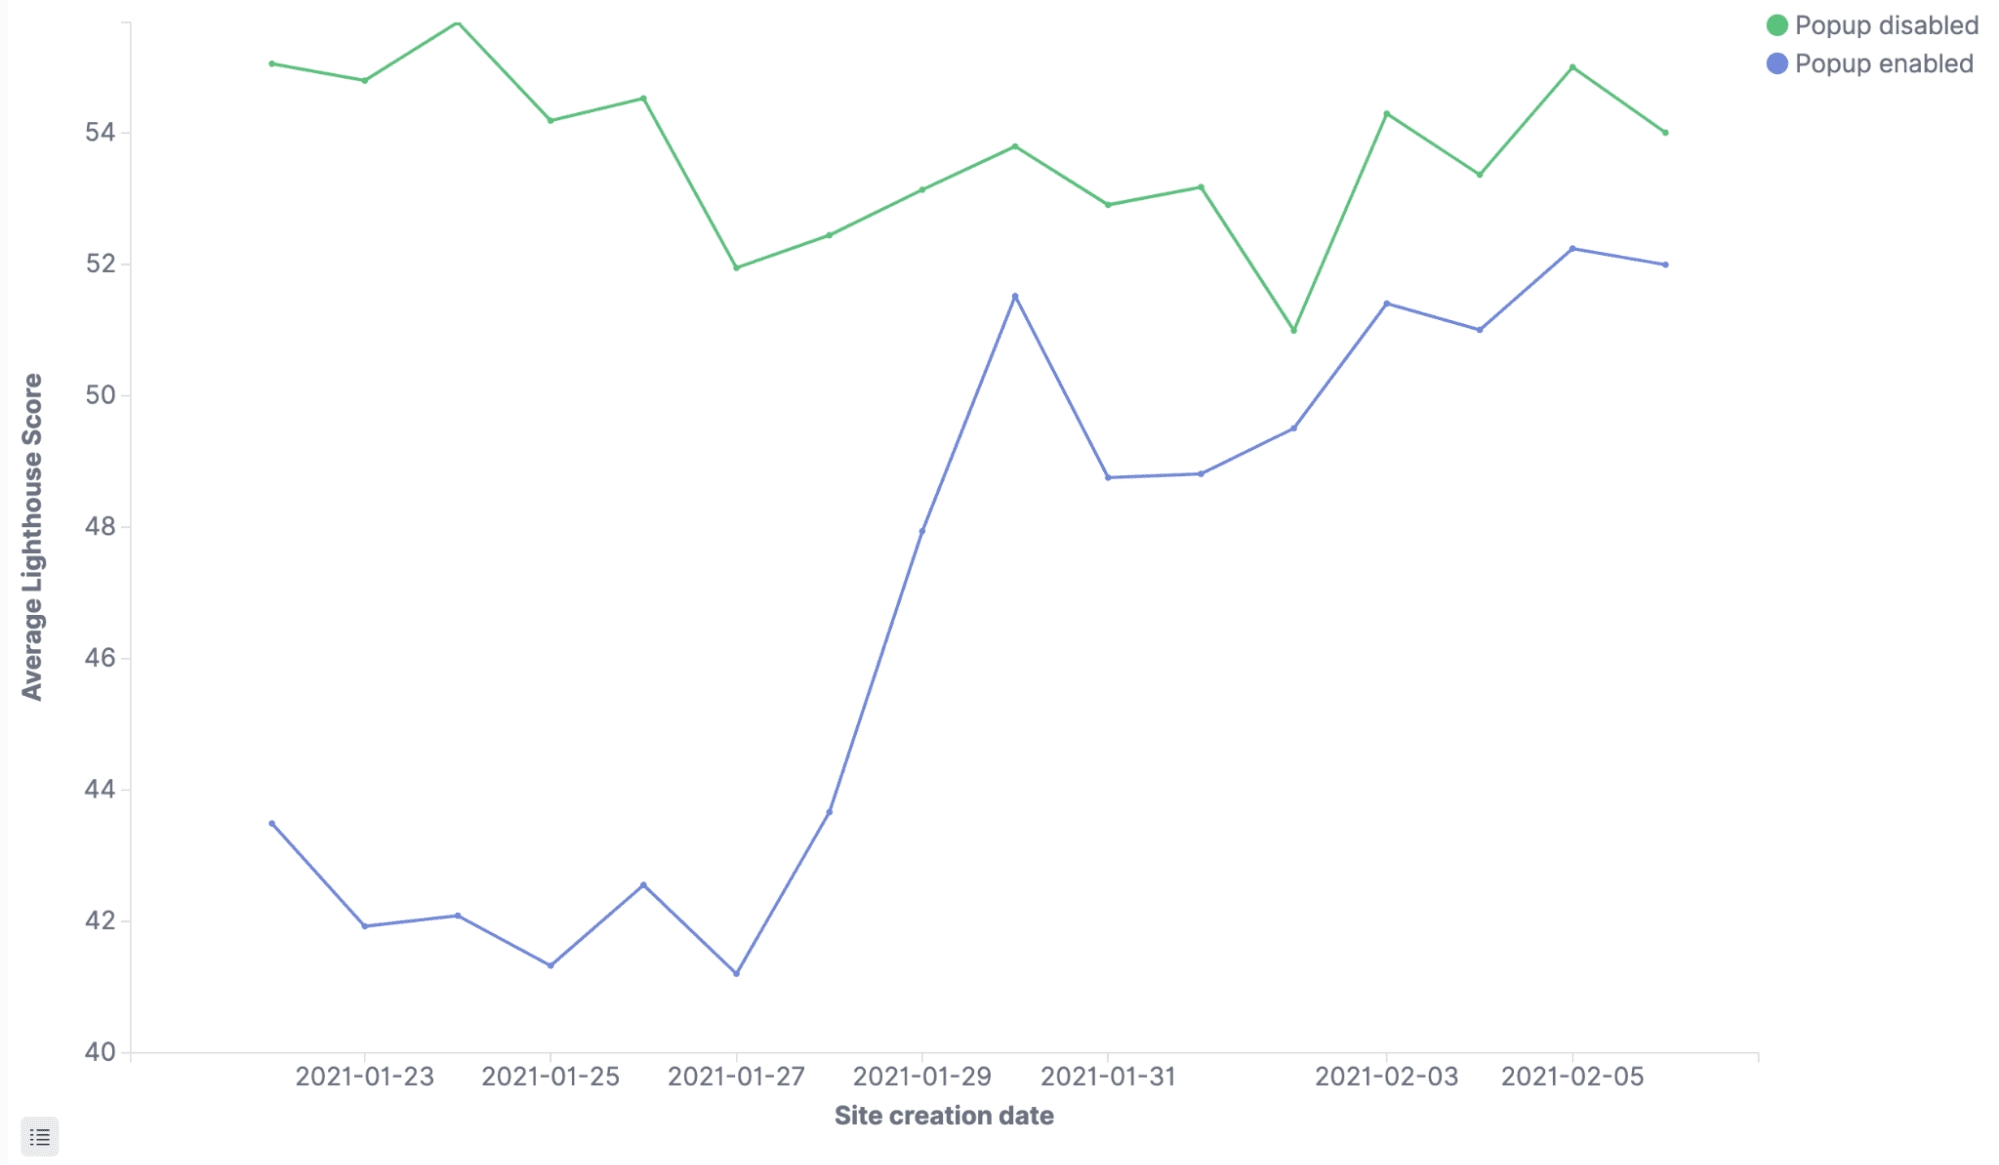
For example, this helped us identify that the "popup modal" was having a negative impact on page speed; sites with the feature performed 12 points lower than without. After making updates to the code to defer loading of JavaScript, we improved our Lighthouse score by 2 points. We were able to apply this learning to other features such as the "cookie banner" that renders soon after page load.
Along with looking at problematic sites based on features, we conducted an analysis of our JavaScript bundle and saw that a large portion of its size came from external dependencies (immutable.js and draft.js). We reduced the bundle size by restructuring consumers to lazy load dependencies on demand. This resulted in over a 50% drop in common JavaScript bundle size, which went from over 200 KB to around 90 KB (minified). The smaller bundle size allowed the browser to load external assets and execute critical scripts earlier in the initial site loading lifecycle, leading to gains in Largest Contentful Paint (LCP) and First Input Delay (FID).
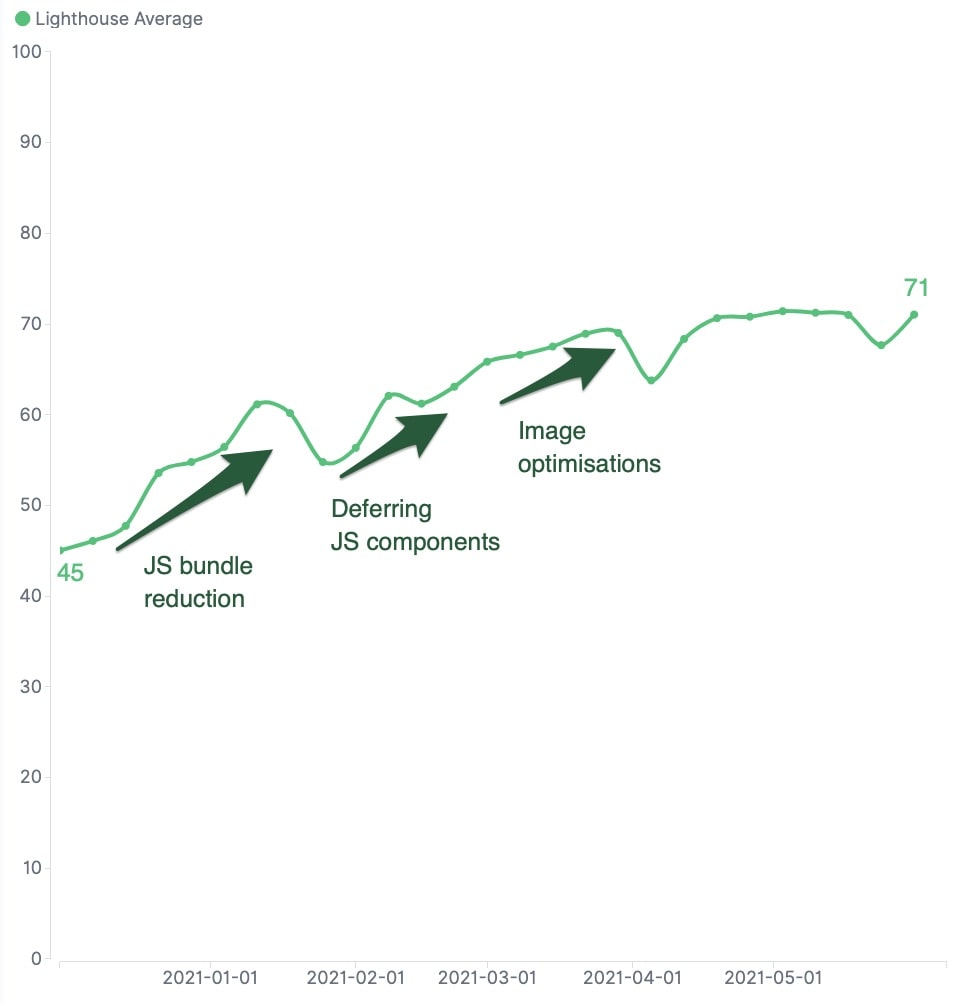
Thanks to our continued efforts, the average customer site Lighthouse score moved from around 40 points in November 2020 to above 70 points in May 2021. However, not all our attempts worked and we were sometimes surprised when the results were not always consistent between what was tested in local test environments and the results we got in the field. Lab results had been really helpful, but it was time to focus on real user experiences observed in the field.
Tracking real user data with Core Web Vitals
After adding the web-vitals library to our customer's sites, we were able to measure data on actual devices from real visitors, where hardware, network speed, user interaction (such as scrolling or clicking) are not at a consistent baseline as in a lab setting using Lighthouse. This was a big step in the right direction, as we now had data that was representative of what our website visitors were experiencing.
Focusing on our weakest link: Cumulative Layout Shift (CLS)
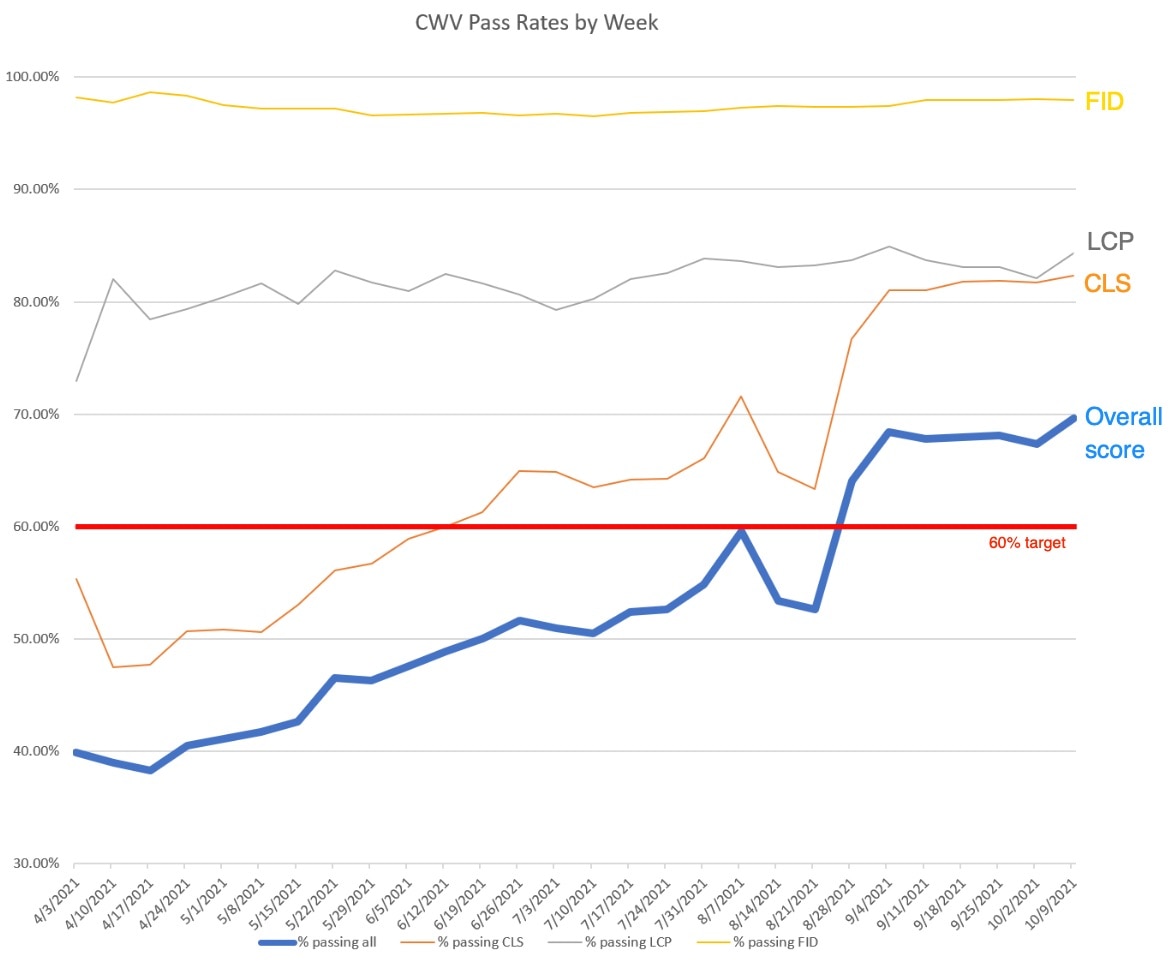
Analyzing new data gave us a new perspective on what had to be done to improve website speed. Because of work done to improve the Lighthouse score, our 75th percentile LCP was 860 ms and our FID at the same threshold was below 10 ms, so we enjoyed a high pass rate for these metrics on our customer's sites: 78% and 98%, respectively. However, the Cumulative Layout Shift (CLS) numbers look quite different from what we were used to with Lighthouse. Our CLS at the 75th percentile was 0.17–above the 0.1 threshold to "pass"–and our pass rate was thus only 47% over all of our sites.
That metric dragged down our overall pass rate to 40%, so we decided to set an ambitious goal to move that number to above 60% by the end of August 2021. To do that, we would have to focus on CLS.
In real life, users interact with the page and scroll past the "above the fold" content, which is something Core Web Vitals captures better. Due to the variability in how users interact with the site while it initially loads, CLS differed from lab and field data.
The road to passing all Core Web Vitals
Improving performance takes trial and error, and every attempt doesn't always work as expected. However, here are a few improvements that helped us achieve our goals.
Reserving space for loading images drastically improved our CLS score as it prevents the content below the images from shifting. We used the CSS aspect-ratio property to address this on browsers which support it. For those that do not, we loaded a transparent placeholder image that was cached and just a few bytes in size, thus loading almost instantaneously.
This generic image behavior allowed us to pre-calculate the final image height during server-side rendering, based on viewport width and image aspect ratio. This resulted in HTML markup with vertical space appropriately reserved for the final image. The improvement was particularly observable on mobile devices, since images are rendered to the full span of mobile viewports.
Certain components on our customers sites have dynamic content (for example, a list of external customer reviews) and could not be converted to pure CSS to leverage performance benefits of server side rendering. These are difficult areas to improve layout shifts because content (thus height) will vary. In those cases, we wrapped the component in a container with a min-height applied, predetermined based on observation of the average height for each of the specific components. The min-height is removed once the inner dynamic component is done rendering. While not perfect, this solution allowed us to reduce layout shift by a lot.
While focusing on CLS improvements, we continued to work on LCP. On many websites, images are the biggest culprit contributing to LCP and for us it was an obvious area of improvement. We had made improvements to lazy load images using IntersectionObserver but realized that image sizes were not set in the most optimal way for each breakpoint (mobile, tablet, desktop, large desktop), so we updated our image generation code to clamp and scale images per breakpoint and then again scale resolution based on pixel density. As an example, this reduced the size of a specific large image from 192 KB to 102 KB.
To quickly render websites on devices with poor network connections, we added code to dynamically scale down image quality based on connection speed. This can be done using the downlink property returned by navigator.connection. We apply URL-based query parameters to reduce image quality through our asset API based on those network conditions.
A number of sections of our customer sites are dynamically loaded. Since we know what sections will be rendered on a given site when it's published, we used the rel=preconnect resource hint to initialize the connection and necessary handshakes ahead of time. We also use resource hints to load fonts and other important resources quickly.
When building their sites, customers add various sections which might have inline scripts to allow different functionalities. Having these scripts inline throughout the HTML page isn't always optimal for performance. We decided to externalize these scripts to allow the browser to load and parse script content asynchronously. Newly externalized scripts could also be shared across pages. This allowed for additional performance gains in the form of browser and CDN caching. We kept critical scripts in-line in order for the browser to parse and execute them faster.
Results
Focusing our effort on CLS paid off, our Core Web Vitals pass rate went from around 40% to almost 70%: an improvement of 75%!
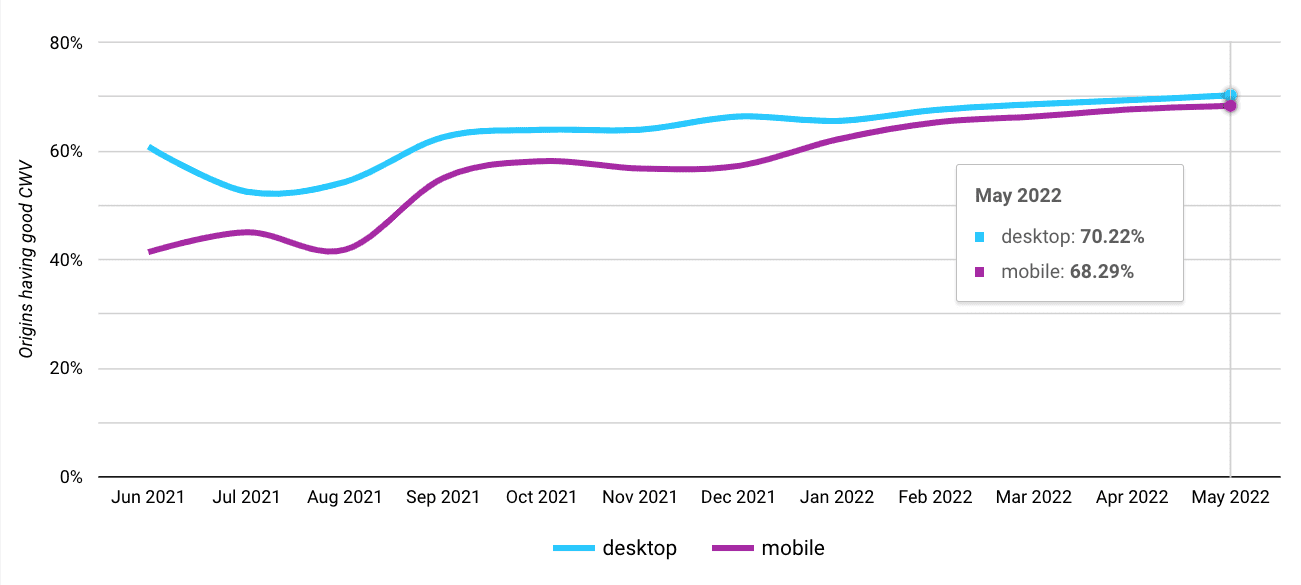
As users come back to our platform to make updates and republish their sites, they get the latest performance improvements and as a result the number of sites with "passing Core Web Vitals" has been steadily growing as shown on the chart below:
Conclusions
Finding areas for performance improvements and successfully tracking progress is highly dependent on what tools are used for measurement. While Lighthouse was useful for measuring above-the-fold performance in a "lab setting", it did not accurately capture performance issues that only occurred from user interactions (such as scrolling through the page).
Tracking real world Core Web Vitals with metadata allowed us to visualize, target, and measure the impact of our improvements. The journey to improve Core Web Vitals scores allowed the team to identify and replace non-performant patterns found throughout our codebase. Sometimes promising changes didn't have nearly the impact we expected, other times the opposite happened. It's not a pristine world out there, so you have to keep trying.