
A project focused on optimizing Core Web Vitals and migrating to Next.js resulted in a 5% increase in conversion rates and a 87% increase in pages per session.

QuintoAndar is a Brazilian proptech company whose products offer digital end-to-end solutions for real estate. This year, we carried out a project focused on improving the performance of a content hub in our app, and had encouraging results in increasing user traffic and conversion metrics.
46%
reduction in bounce rate
87%
increase in pages per session
5%
improvement in conversion during validation phase
Challenges
Our app has a condominium content hub with over 40,000 pages, where users can get information about their properties, check photos of the common areas, read about the neighborhood, and find available listings for rent or sale. These pages are very important for QuintoAndar:
- They are an important source of organic traffic, with a steadily increasing number of users coming from search engine results.
- They have high conversion rates in the medium to long-term compared to other pages.
However, there were challenges when it came to the performance and user experience in these pages:
- Their performance as measured by Core Web Vitals was not optimized, and there were known issues regarding slow page loads, slow responsiveness to user input, and layout instability.
- Their bounce rates were high, even if we expected them to be higher than in other parts of the app.
- The page experience update in Google Search—which, at that time, was not yet released—would include Core Web Vitals into the ranking algorithm, which meant page performance could affect how search results were going to be displayed.
At the same time, we identified some developer experience opportunities that could unlock gains in other projects across the company:
- Our server-side rendering logic—which renders all high-traffic pages, including condominium pages—was created in-house, and became too complex to maintain and onboard new hires.
- Essential features to achieve good app performance, such as code splitting, also required a custom setup plus manual work from the developers.
- QuintoAndar has over 30 React web applications. Delivering updates to these applications and maintaining them in accordance to best practices is an arduous task.
Approach
We began a performance optimization project of the condominium content hub to improve its user experience, as these improvements could lead to conversion gains, better SEO, and better usability. This initiative was also a fitting opportunity to improve the developer experience as well.
Migrating to Next.js
The new version of the condominium page was implemented with Next.js. Being largely independent from other parts of the app, the condominium content hub seemed like a good candidate for trying out a new framework. We would be able to understand the magnitude of migration efforts and evaluate how its features could help without affecting the other React apps in QuintoAndar.
A hard requirement was to ensure pages remained crawlable by search engines. Next.js meets this requirement by supporting server-side rendering out-of-the-box, and removes the need for a custom setup. The documentation makes it much easier to share knowledge on how to do tasks such as data fetching on the server and onboard new developers. Server-side rendering is also known to improve performance metrics such as First Contentful Paint (FCP).
The framework provides other performance-friendly features such as automatic code splitting and prefetching. Even though the existing structure already provided such features, the additional work required from developers stalled their adoption. For example, code splitting at page or component-level had to be done manually.
Optimizing JavaScript resources
The first step was to remove unused code. We looked at the Webpack Bundle Analyzer reports, which shows the contents of each JS bundle, and carefully reviewed all third-party scripts. As a result, we were able to clean up some tracking libraries that were not used in this specific page.
Our team went further and evaluated the performance cost of existing features. For instance, the "like" button required quite a lot of JS to work. However, in the condominium page, less than 0.5% of the users interacted with the button, which is available and used more frequently in other parts of our app. After a discussion involving both Engineering and Product, we decided to remove this feature.
Other JS optimizations were already in place, such as static compression with Brotli, which was done at build time using BrotliWebpackPlugin, and was also applied to other types of static resources. At first, we were relying on the compression provided by the CDN, and Brotli reduced JS size by 18% compared to gzip. But then, we switched to Brotli compression at build time, and were able to achieve a 24% reduction.
Optimizing image resources
There is a hero image occupying most of the area above the fold in the mobile version. It also happens to be the Largest Contentful Paint (LCP) of the page.

Previously, all images already had srcset and sizes attributes to serve responsive images. We also used Thumbor to resize images on-demand and configured our CDN to cache them efficiently.
Modern mobile devices have displays with very high pixel density, meaning the browser would render 3x or 4x versions of the image, if available. As resolution increases, it gets harder for the human eye to perceive the differences, but file sizes will increase regardless. Capping the maximum image resolution improved image size without compromising the user experience. We limited the hero image to serve its 2x version at most, which is approximately 35% smaller than the 3x version and 50% smaller than the 4x one.
To finish, we used a preloading strategy to download and display it as soon as possible, looking forward to improving the LCP metric.
<link rel="preload" href="/img/450x450/892847321-143.0038687080606IMG20180420WA0037.jpg" as="image">
The Next.js built-in image component includes many of these optimizations such as responsive resizing and prioritized loading. During this project, we did not migrate the existing images to use this component, but we are planning to adopt it in new features.
Reducing layout shift
The condominium page had a few issues with Cumulative Layout Shift (CLS). The elements responsible for the layout shifts were rendered only in the client—for instance, hydrating server-side markup with client-rendered components, or images without defined width and height attributes.
To solve these problems, we set exact dimensions for these elements when possible, or estimated values with min-height. There are more options, such as using the aspect-ratio CSS property. We also created placeholders to prevent dynamically rendered components from causing layout shifts.

Progressively rolling out changes
Our team wanted to validate that the optimized version of the condominium hub page to make sure the user experience would be better. To achieve this, we adopted a progressive rollout strategy:
- In the first phase, the new version was published for a few hand-picked URLs, so only a few hundreds of users per day would see them;
- In the second phase, it was published for more pages, accounting to a few thousand users per day;
- In the third and final phase, it was published for all pages, and the roll-out was completed for all users.
During this period, the engineering team continuously measured page performance in production and kept working on improvements. Additionally, the team compared business metrics between the new and previous versions. The results in this validation period were promising.
Results
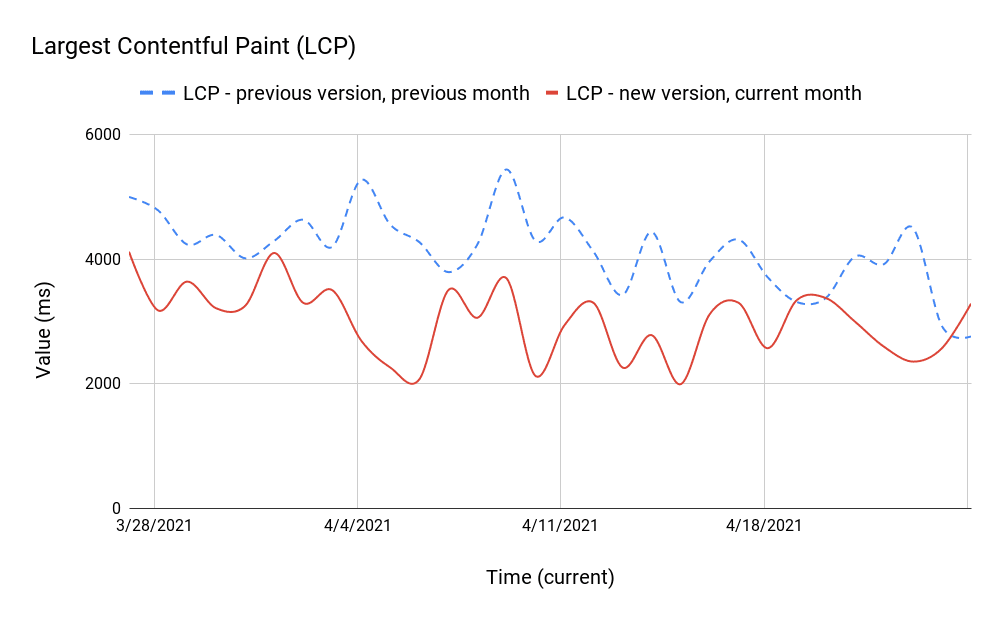
The team used SpeedCurve to continuously run lab tests against the condominium page. These are the results for the mobile version:
| Lab metric | Before | After | Difference |
|---|---|---|---|
| Largest Contentful Paint (LCP) | 2.41 seconds | 1.48 seconds | -39% |
| Time to Interactive (TTI) | 12.16 seconds | 7.48 seconds | -39% |
| Total Blocking Time (TBT) | 1124 milliseconds | 1056 milliseconds | -4% |
| Cumulative Layout Shift (CLS) | 0.0402 | 0.0093 | -77% |
We also wanted to check the impact on our real users. Using field data collected with Instana Website Monitoring, we looked at the 1-month period before and after the roll-out. Comparing the 75th percentile for mobile users, we found that LCP decreased by 26%, and FID decreased by 72%.

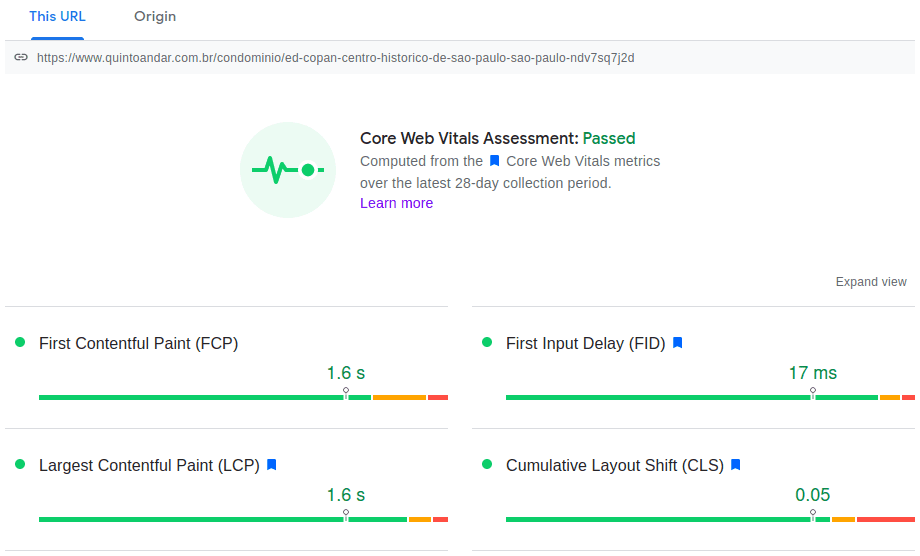
PageSpeed Insights provides a field data report for the last 28 days. The most accessed condominium page alone had enough data to generate a report for mobile users. As of November 2021, all Core Web Vitals are in the "good" bucket.
During the progressive roll-out, we noticed a drop in bounce rates. By the time we had finished the release for all pages, Google Analytics showed a 46% decrease in bounce rate, a 87% increase in pages per session, and a 49% increase in average session duration. The bounce rate reduction was even bigger for paid searches, reaching a 59% drop — a positive sign when it comes to the investments in pay-per click (PPC) ads.

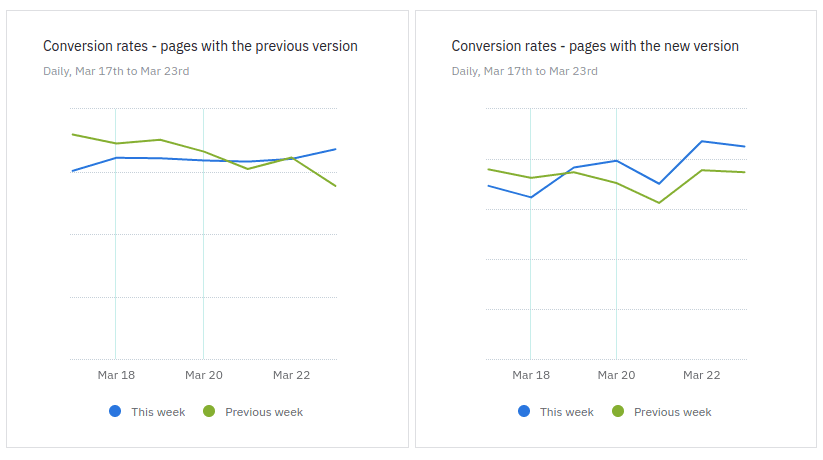
As for the impact in business metrics, we analyzed conversion rates for transactions like scheduling a tour and applying to rent or buy an estate. While improvements were still being rolled out, our team compared the conversion between the previous and new versions. In the same week, the group of pages with the new version showed a 5% conversion increase, while the other pages had a slight decrease in the same metric.
Conclusion
This project is the first part of a long-term migration effort from framework-less React to Next.js. The teams who worked on the condominium page since then gave positive feedback about the improved developer experience. Other teams who had to bootstrap new web apps have already done so with Next.js. We believe Next.js will simplify maintenance efforts and establish a common ground between different apps.
Overall, the condominium content hub has been continuously growing in terms of absolute number of users and transactions. In the long-term analysis, there are many factors contributing to this, like the expansion of QuintoAndar’s operation and SEO initiatives such as improved page indexing. During this project, we have seen that page performance is also one of these factors with great potential for positive conversion impact.
Special thanks to Pedro Carmo, Product Manager of the SEO team, for diving into the user data and creating all the conversion analysis seen in this case study.