


This guide teaches you how to create high-performance CSS animations.
See Why are some animations slow? to learn the theory behind these recommendations.
Browser compatibility
All the CSS properties that this guide recommends have good cross-browser support.
transform
' d='M96 183a64 64 0 0 1-23-23L17 64a128 128 0 0 0 111 192l55-96a64 64 0 0 1-87 23Z'/%3E%3Cpath fill='url(%23b)' d='M192 128a64 64 0 0 1-9 32l-55 96A128 128 0 0 0 239 64H128a64 64 0 0 1 64 64Z'/%3E%3Ccircle cx='128' cy='128' r='52' fill='%231a73e8'/%3E%3Cpath fill='url(%23c)' d='M96 73a64 64 0 0 1 32-9h111a128 128 0 0 0-222 0l56 96a64 64 0 0 1 23-87Z'/%3E%3C/svg%3E)
' xlink:href='%23A'%3E%3Cstop offset='.76' stop-opacity='0'/%3E%3Cstop offset='.95' stop-opacity='.5'/%3E%3Cstop offset='1'/%3E%3C/radialGradient%3E%3CradialGradient id='F' cx='2523' cy='4680' r='20243' gradientTransform='matrix(-.03715 .99931 -2.12836 -.07913 13579 3530)' xlink:href='%23A'%3E%3Cstop offset='0' stop-color='%2335c1f1'/%3E%3Cstop offset='.11' stop-color='%2334c1ed'/%3E%3Cstop offset='.23' stop-color='%232fc2df'/%3E%3Cstop offset='.31' stop-color='%232bc3d2'/%3E%3Cstop offset='.67' stop-color='%2336c752'/%3E%3C/radialGradient%3E%3CradialGradient id='G' cx='24247' cy='7758' r='9734' gradientTransform='matrix(.28109 .95968 -.78353 .22949 24510 -16292)' xlink:href='%23A'%3E%3Cstop offset='0' stop-color='%2366eb6e'/%3E%3Cstop offset='1' stop-color='%2366eb6e' stop-opacity='0'/%3E%3C/radialGradient%3E%3Cpath id='H' d='M24105 20053a9345 9345 0 01-1053 472 10202 10202 0 01-3590 646c-4732 0-8855-3255-8855-7432 0-1175 680-2193 1643-2729-4280 180-5380 4640-5380 7253 0 7387 6810 8137 8276 8137 791 0 1984-230 2704-456l130-44a12834 12834 0 006660-5282c220-350-168-757-535-565z'/%3E%3Cpath id='I' d='M11571 25141a7913 7913 0 01-2273-2137 8145 8145 0 01-1514-4740 8093 8093 0 013093-6395 8082 8082 0 011373-859c312-148 846-414 1554-404a3236 3236 0 012569 1297 3184 3184 0 01636 1866c0-21 2446-7960-8005-7960-4390 0-8004 4166-8004 7820 0 2319 538 4170 1212 5604a12833 12833 0 007684 6757 12795 12795 0 003908 610c1414 0 2774-233 4045-656a7575 7575 0 01-6278-803z'/%3E%3Cpath id='J' d='M16231 15886c-80 105-330 250-330 566 0 260 170 512 472 723 1438 1003 4149 868 4156 868a5954 5954 0 003027-839 6147 6147 0 001133-850 6180 6180 0 001910-4437c26-2242-796-3732-1133-4392-2120-4141-6694-6525-11668-6525-7011 0-12703 5635-12798 12620 47-3654 3679-6605 7996-6605 350 0 2346 34 4200 1007 1634 858 2490 1894 3086 2921 618 1067 728 2415 728 2952s-271 1333-780 1990z'/%3E%3Cuse fill='url(%23B)' xlink:href='%23H'/%3E%3Cuse fill='url(%23D)' opacity='.35' xlink:href='%23H'/%3E%3Cuse fill='url(%23C)' xlink:href='%23I'/%3E%3Cuse fill='url(%23E)' opacity='.4' xlink:href='%23I'/%3E%3Cuse fill='url(%23F)' xlink:href='%23J'/%3E%3Cuse fill='url(%23G)' xlink:href='%23J'/%3E%3C/svg%3E)
' gradientUnits='userSpaceOnUse'%3E%3Cstop offset='.2' stop-color='%239059ff' stop-opacity='0'/%3E%3Cstop offset='.3' stop-color='%238c4ff3' stop-opacity='.1'/%3E%3Cstop offset='.8' stop-color='%237716a8' stop-opacity='.5'/%3E%3Cstop offset='1' stop-color='%236e008b' stop-opacity='.6'/%3E%3C/radialGradient%3E%3CradialGradient id='ff-g' cx='239.1' cy='34.6' r='171.6' gradientUnits='userSpaceOnUse'%3E%3Cstop offset='0' stop-color='%23ffe226'/%3E%3Cstop offset='.1' stop-color='%23ffdb27'/%3E%3Cstop offset='.3' stop-color='%23ffc82a'/%3E%3Cstop offset='.5' stop-color='%23ffa930'/%3E%3Cstop offset='.7' stop-color='%23ff7e37'/%3E%3Cstop offset='.8' stop-color='%23ff7139'/%3E%3C/radialGradient%3E%3CradialGradient id='ff-h' cx='374' cy='-74.3' r='732.2' gradientUnits='userSpaceOnUse'%3E%3Cstop offset='.1' stop-color='%23fff44f'/%3E%3Cstop offset='.5' stop-color='%23ff980e'/%3E%3Cstop offset='.6' stop-color='%23ff5634'/%3E%3Cstop offset='.7' stop-color='%23ff3647'/%3E%3Cstop offset='.9' stop-color='%23e31587'/%3E%3C/radialGradient%3E%3CradialGradient id='ff-i' cx='304.6' cy='7.1' r='536.4' gradientTransform='rotate(84 303 4)' gradientUnits='userSpaceOnUse'%3E%3Cstop offset='0' stop-color='%23fff44f'/%3E%3Cstop offset='.1' stop-color='%23ffe847'/%3E%3Cstop offset='.2' stop-color='%23ffc830'/%3E%3Cstop offset='.3' stop-color='%23ff980e'/%3E%3Cstop offset='.4' stop-color='%23ff8b16'/%3E%3Cstop offset='.5' stop-color='%23ff672a'/%3E%3Cstop offset='.6' stop-color='%23ff3647'/%3E%3Cstop offset='.7' stop-color='%23e31587'/%3E%3C/radialGradient%3E%3CradialGradient id='ff-j' cx='235' cy='98.1' r='457.1' gradientUnits='userSpaceOnUse'%3E%3Cstop offset='.1' stop-color='%23fff44f'/%3E%3Cstop offset='.5' stop-color='%23ff980e'/%3E%3Cstop offset='.6' stop-color='%23ff5634'/%3E%3Cstop offset='.7' stop-color='%23ff3647'/%3E%3Cstop offset='.9' stop-color='%23e31587'/%3E%3C/radialGradient%3E%3CradialGradient id='ff-k' cx='355.7' cy='124.9' r='500.3' gradientUnits='userSpaceOnUse'%3E%3Cstop offset='.1' stop-color='%23fff44f'/%3E%3Cstop offset='.2' stop-color='%23ffe141'/%3E%3Cstop offset='.5' stop-color='%23ffaf1e'/%3E%3Cstop offset='.6' stop-color='%23ff980e'/%3E%3C/radialGradient%3E%3ClinearGradient id='ff-a' x1='446.9' y1='76.8' x2='47.9' y2='461.8' gradientUnits='userSpaceOnUse'%3E%3Cstop offset='.1' stop-color='%23fff44f'/%3E%3Cstop offset='.1' stop-color='%23ffe847'/%3E%3Cstop offset='.2' stop-color='%23ffc830'/%3E%3Cstop offset='.4' stop-color='%23ff980e'/%3E%3Cstop offset='.4' stop-color='%23ff8b16'/%3E%3Cstop offset='.5' stop-color='%23ff672a'/%3E%3Cstop offset='.5' stop-color='%23ff3647'/%3E%3Cstop offset='.7' stop-color='%23e31587'/%3E%3C/linearGradient%3E%3ClinearGradient id='ff-l' x1='442.1' y1='74.8' x2='102.6' y2='414.3' gradientUnits='userSpaceOnUse'%3E%3Cstop offset='.2' stop-color='%23fff44f' stop-opacity='.8'/%3E%3Cstop offset='.3' stop-color='%23fff44f' stop-opacity='.6'/%3E%3Cstop offset='.5' stop-color='%23fff44f' stop-opacity='.2'/%3E%3Cstop offset='.6' stop-color='%23fff44f' stop-opacity='0'/%3E%3C/linearGradient%3E%3C/defs%3E%3Cpath d='M479 166c-11-25-32-52-49-60a249 249 0 0 1 25 73c-27-68-73-95-111-155a255 255 0 0 1-8-14 44 44 0 0 1-4-9 1 1 0 0 0 0-1 1 1 0 0 0-1 0c-60 35-81 101-83 134a120 120 0 0 0-66 25 71 71 0 0 0-6-5 111 111 0 0 1-1-58c-25 11-44 29-58 44-9-12-9-52-8-60l-8 4a175 175 0 0 0-24 21 210 210 0 0 0-22 26 203 203 0 0 0-32 73l-1 2-2 15a229 229 0 0 0-4 34v1a240 240 0 0 0 477 40l1-9c5-41 0-84-15-121zM202 355l3 1-3-1zm55-145zm198-31z' fill='url(%23ff-a)'/%3E%3Cpath d='M479 166c-11-25-32-52-49-60 14 26 22 53 25 72v1a207 207 0 0 1-206 279c-113-3-212-87-231-197-3-17 0-26 2-40-2 11-3 14-4 34v1a240 240 0 0 0 477 40l1-9c5-41 0-84-15-121z' fill='url(%23ff-b)'/%3E%3Cpath d='M479 166c-11-25-32-52-49-60 14 26 22 53 25 72v1a207 207 0 0 1-206 279c-113-3-212-87-231-197-3-17 0-26 2-40-2 11-3 14-4 34v1a240 240 0 0 0 477 40l1-9c5-41 0-84-15-121z' fill='url(%23ff-c)'/%3E%3Cpath d='m362 195 1 1a130 130 0 0 0-22-29C266 92 322 5 331 0c-60 35-81 101-83 134l9-1c45 0 84 25 105 62z' fill='url(%23ff-d)'/%3E%3Cpath d='M257 210c-1 6-22 26-29 26-68 0-80 41-80 41 3 35 28 64 57 79l4 2 7 3a107 107 0 0 0 31 6c120 6 143-143 57-186 22-4 45 5 58 14-21-37-60-62-105-62l-9 1a120 120 0 0 0-66 25l17 16c16 16 58 33 58 35z' fill='url(%23ff-e)'/%3E%3Cpath d='M257 210c-1 6-22 26-29 26-68 0-80 41-80 41 3 35 28 64 57 79l4 2 7 3a107 107 0 0 0 31 6c120 6 143-143 57-186 22-4 45 5 58 14-21-37-60-62-105-62l-9 1a120 120 0 0 0-66 25l17 16c16 16 58 33 58 35z' fill='url(%23ff-f)'/%3E%3Cpath d='m171 151 5 3a111 111 0 0 1-1-58c-25 11-44 29-58 44 1 0 36 0 54 11z' fill='url(%23ff-g)'/%3E%3Cpath d='M18 261a242 242 0 0 0 231 197 207 207 0 0 0 206-279c8 56-20 110-64 146-86 71-169 43-186 31l-3-1c-50-24-71-70-67-110-42 0-57-35-57-35s38-28 89-4c46 22 90 4 90 4 0-2-42-19-58-35l-17-16a71 71 0 0 0-6-5l-5-3c-18-11-52-11-54-11-9-12-9-51-8-60l-8 4a175 175 0 0 0-24 21 210 210 0 0 0-22 26 203 203 0 0 0-32 73c0 1-9 38-5 57z' fill='url(%23ff-h)'/%3E%3Cpath d='M341 167a130 130 0 0 1 22 29 46 46 0 0 1 4 3c55 50 26 121 24 126 44-36 72-90 64-146-27-68-73-95-111-155a255 255 0 0 1-8-14 44 44 0 0 1-4-9 1 1 0 0 0 0-1 1 1 0 0 0-1 0c-9 5-65 92 10 167z' fill='url(%23ff-i)'/%3E%3Cpath d='M367 199a46 46 0 0 0-4-3l-1-1c-13-9-36-18-58-15 86 44 63 193-57 187a107 107 0 0 1-31-6 131 131 0 0 1-11-5c17 12 99 39 186-31 2-5 31-76-24-126z' fill='url(%23ff-j)'/%3E%3Cpath d='M148 277s12-41 80-41c7 0 28-20 29-26s-44 18-90-4c-51-24-89 4-89 4s15 35 57 35c-4 40 16 85 67 110l3 1c-29-15-54-44-57-79z' fill='url(%23ff-k)'/%3E%3Cpath d='M479 166c-11-25-32-52-49-60a249 249 0 0 1 25 73c-27-68-73-95-111-155a255 255 0 0 1-8-14 44 44 0 0 1-4-9 1 1 0 0 0 0-1 1 1 0 0 0-1 0c-60 35-81 101-83 134l9-1c45 0 84 25 105 62-13-9-36-18-58-14 86 43 63 192-57 186a107 107 0 0 1-31-6 131 131 0 0 1-11-5l-3-1 3 1c-29-15-54-44-57-79 0 0 12-41 80-41 7 0 28-20 29-26 0-2-42-19-58-35l-17-16a71 71 0 0 0-6-5 111 111 0 0 1-1-58c-25 11-44 29-58 44-9-12-9-52-8-60l-8 4a175 175 0 0 0-24 21 210 210 0 0 0-22 26 203 203 0 0 0-32 73l-1 2-2 15a279 279 0 0 0-4 34v1a240 240 0 0 0 477 40l1-9c5-41 0-84-15-121zm-24 13z' fill='url(%23ff-l)'/%3E%3C/svg%3E)
' xlink:href='%23s-b'%3E%3Cstop offset='0' stop-color='%2324a5f3' stop-opacity='0' /%3E%3Cstop offset='1' stop-color='%231e8ceb' /%3E%3C/radialGradient%3E%3CradialGradient id='s-j' cx='109.3' cy='13.8' r='93.1' gradientTransform='matrix(-.02 1.1 -1.04 -.02 137 -115)' xlink:href='%23s-b'%3E%3Cstop offset='0' stop-opacity='0' /%3E%3Cstop offset='1' stop-color='%235488d6' stop-opacity='0' /%3E%3Cstop offset='1' stop-color='%235d96eb' /%3E%3C/radialGradient%3E%3C/defs%3E%3Crect width='220' height='220' x='22' y='-107' fill='url(%23s-a)' ry='49' transform='matrix(.57 0 0 .57 187 256)' /%3E%3Cg transform='translate(194 190)'%3E%3Ccircle cx='67.8' cy='67.7' fill='url(%23s-c)' paint-order='stroke fill markers' r='54' /%3E%3Ccircle cx='-69.9' cy='69.3' fill='url(%23s-i)' transform='translate(138 -2)' r='54' /%3E%3C/g%3E%3Cellipse cx='120' cy='14.2' fill='url(%23s-j)' rx='93.1' ry='93.7' transform='matrix(.58 0 0 .58 192 250)' /%3E%3Cg transform='matrix(.58 0 0 .57 197 182)'%3E%3Cpath fill='%23cac7c8' d='M46 192h1l72-48-7-9-66 57Z' /%3E%3Cpath fill='%23fbfffc' d='M46 191v1l66-57-7-9-59 65Z' /%3E%3Cpath fill='url(%23s-d)' d='m119 144-7-9 66-57-59 66Z' /%3E%3Cpath fill='%23fb645c' d='m105 126 7 9 66-57-1-1-72 49Z' /%3E%3C/g%3E%3Cpath stroke='%23fff' stroke-linecap='round' stroke-miterlimit='1' stroke-width='1.3' d='m287 278 3-2m-12-17 8-2m-8-3h4m-4-13 8 2m-8 3h4m-1-13 7 3m-4-11 7 4m-2-11 6 6m0-12 6 7m1-11 4 6m4-10 3 7m5-9 2 7m15-7-1 7m10-5-3 7m11-4-4 7m11-2-5 6m16 7-7 4m10 4-7 3m10 6-8 1m8 16-8-2m5 10-7-3m4 11-7-4m2 11-6-5m0 11-5-6m-2 11-4-7m-4 11-3-8m-6 10-1-8m-16 8 2-8m-10 5 3-7m-11 4 4-7m-11 2 5-6m-8 3 3-3m4 8 2-3m5 8 2-4m6 7 1-4m8 5v-4m8 4v-4m9 3-1-4m9 1-2-4m9 0-2-4m9-2-3-3m8-4-3-2m8-5-4-2m7-6-4-1m5-8h-4m4-8h-4m3-9-4 1m1-9-4 2m-1-9-3 2m-2-9-3 3m-4-8-2 3m-5-8-2 4m-6-6-1 3m-8-5v4m-8-4v4m-9-2 1 3m-9 0 2 3m-9 1 2 3m-9 2 3 3m-8 4 3 2m-8 5 4 2m-7 6 4 1m-4 25 4-1m-2 5 7-3m-6 7 4-2m-2 6 7-4m-13-21h8m41-41v-8m0 99v-8m49-42h-8' transform='translate(-65 8)' /%3E%3C/svg%3E)
opacity
will-change
Move an element
To move an element, use the translate or rotation keyword values of the
transform property.
For example, to slide an item into view, use translate.
.animate {
  animation: slide-in 0.7s both;
}

@keyframes slide-in {
  0% {
    transform: translateY(-1000px);
  }
  100% {
    transform: translateY(0);
  }
}
Use rotate to rotate elements. The following example rotates an element
360 degrees.
.animate {
  animation: rotate 0.7s ease-in-out both;
}

@keyframes rotate {
  0% {
    transform: rotate(0);
  }
  100% {
    transform: rotate(360deg);
  }
}
Resize an element
To resize an element, use the scale keyword value of the
transform property.
.animate {
  animation: scale 1.5s both;
}

@keyframes scale {
  50% {
    transform: scale(0.5);
  }
  100% {
    transform: scale(1);
  }
}
Change an element's visibility
To show or hide an element, use opacity.
.animate {
  animation: opacity 2.5s both;
}

@keyframes opacity {
  0% {
    opacity: 1;
  }
  50% {
    opacity: 0;
  }
  100% {
    opacity: 1;
  }
}
Avoid properties that trigger layout or paint
Before using any CSS property for animation (other than transform and opacity),
determine the property's impact on the rendering pipeline.
Avoid any property that triggers layout or paint unless it's absolutely necessary.
Force layer creation
As explained in Why are some animations slow?, placing elements on a new layer lets the browser repaint them without needing to repaint the rest of the layout.
Browsers can usually make good decisions about which items should be placed on a
new layer, but you can manually force layer creation with the
will-change property.
As the name suggests, this property tells the browser that this element is going
to be changed in some way.
In CSS, you can apply will-change to any selector:
body > .sidebar {
  will-change: transform;
}
However, the specification
suggests that you should only add this to elements that are always about to
change. For example, this could be used for a sidebar the user can slide in and
out. If the element doesn't change frequently, apply will-change using
JavaScript when a change is likely to happen. Make sure to give the browser
enough time to perform the necessary optimizations, and remove the property
when the change has stopped.
To force layer creation in a browser without support for will-change, you can
set transform: translateZ(0).
Debug slow or glitchy animations
Chrome DevTools and Firefox DevTools can help you figure out why your animations are slow or glitchy.
Check whether an animation triggers layout
An animation that moves an element using something other than transform is
likely to be slow. The following example compares an animation using transform
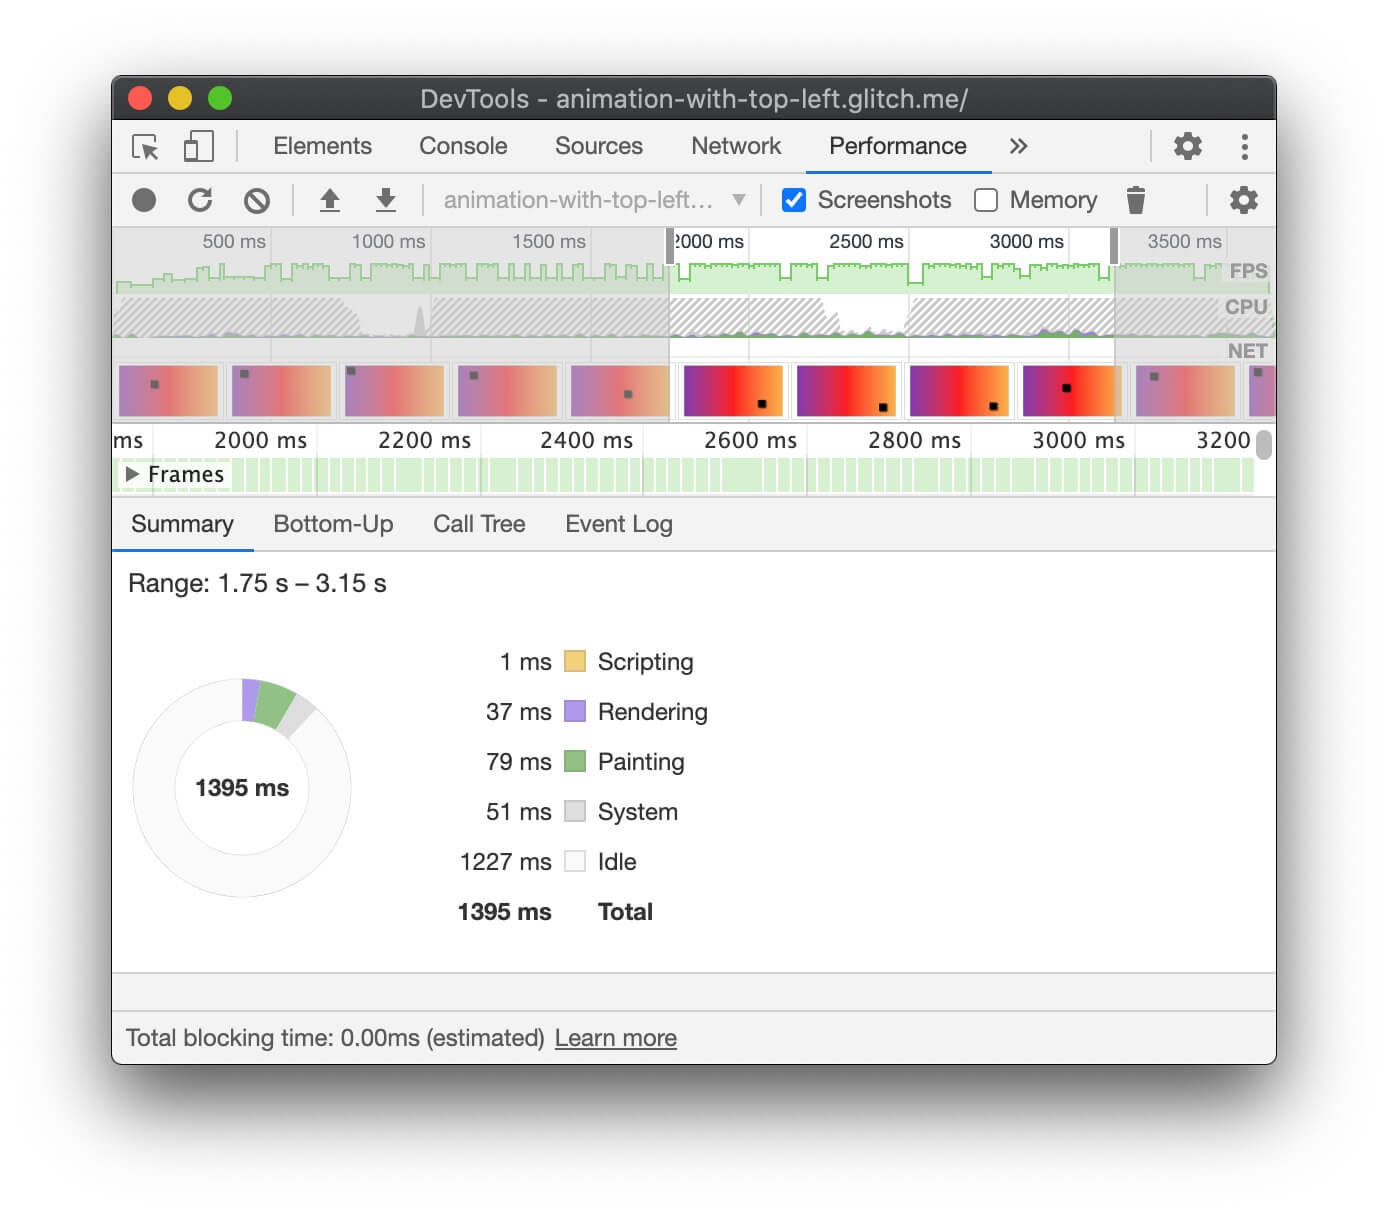
to an animation using top and left.
.box {
  position: absolute;
  top: 10px;
  left: 10px;
  animation: move 3s ease infinite;
}

@keyframes move {
  50% {
     top: calc(90vh - 160px);
     left: calc(90vw - 200px);
  }
}
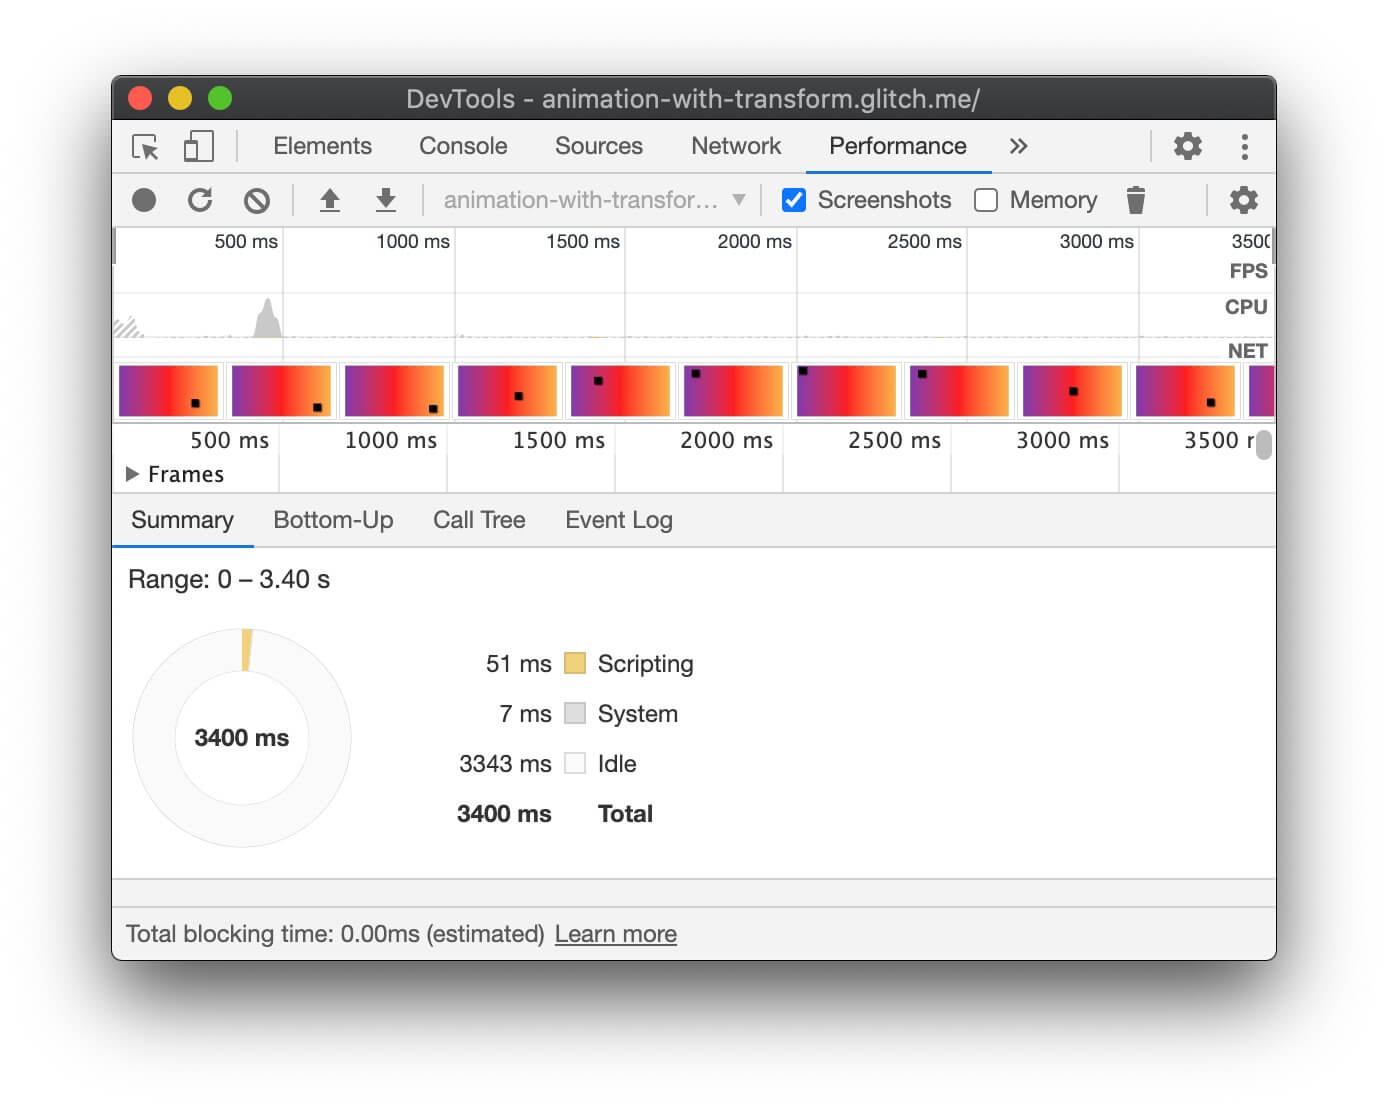
.box {
  position: absolute;
  top: 10px;
  left: 10px;
  animation: move 3s ease infinite;
}

@keyframes move {
  50% {
     transform: translate(calc(90vw - 200px), calc(90vh - 160px));
  }
}
You can test this in the following two examples and explore performance using DevTools.
Chrome DevTools
- Open the Performance panel.
- Record runtime performance while your animation is happening.
- Inspect the Summary tab.
If you see a nonzero value for Rendering in the Summary tab, it might mean your animation is making the browser do layout work.
Firefox DevTools
In Firefox DevTools the Waterfall can help you understand where the browser is spending time.
- Open the Performance panel.
- Start recording performance while your animation is happening.
- Stop the recording and inspect the Waterfall tab.
If you see entries for Recalculate Style, that means the browser has to return to the start of the rendering waterfall to render the animation.
Check for dropped frames
- Open the Rendering tab in Chrome DevTools.
- Enable the FPS meter checkbox.
- Watch the values while your animation runs.
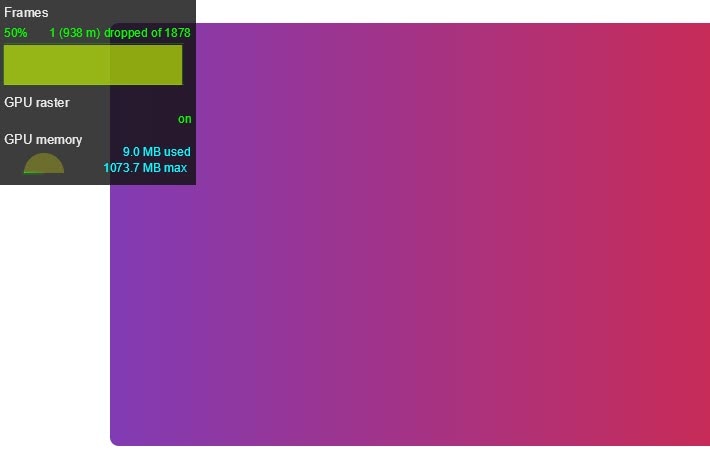
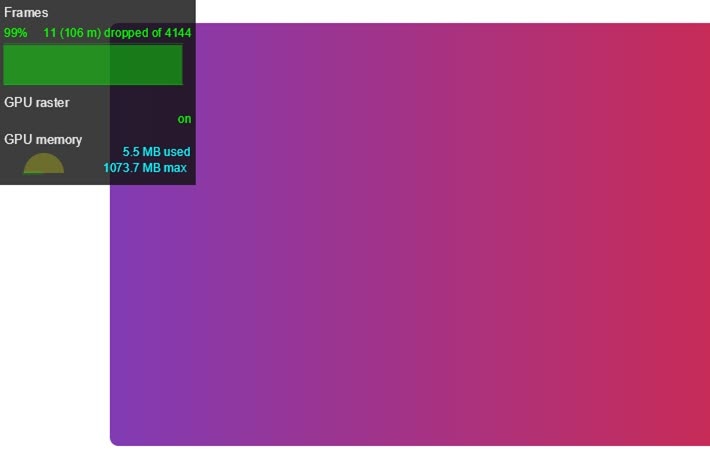
Pay attention to the Frames label at the top of the FPS meter UI.
This shows values like 50% 1 (938 m) dropped of 1878. A high-performance
animation has a high percentage, such as 99%, meaning that few frames are
being dropped and the animation looks smooth.
Check whether an animation triggers paint
Some properties are more expensive for the browser to paint than others. For example, anything that involves a blur (like a shadow, for example) takes longer to paint than drawing a red box. These differences aren't always obvious in the CSS, but browser DevTools can help you to identify which areas need to be repainted, as well as other painting-related performance issues.
Chrome DevTools
- Open the Rendering tab in Chrome DevTools.
- Select Paint Flashing.
- Move the pointer around the screen.

If you see the whole screen flashing, or areas highlighted that you don't think should change, investigate further.
If you need to determine whether a particular property is causing painting-related performance issues, the paint profiler in Chrome DevTools can help.
Firefox DevTools
- Open Settings and add a Toolbox button for Toggle paint flashing.
- On the page you want to inspect, toggle the button on and move your mouse or scroll to see highlighted areas.
Animate at the composite stage
Where possible, restrict animations to opacity and transform to keep
animations on the compositing stage of the rendering path. Use DevTools to check
which stage of the path is being affected by your animations.
Use the paint profiler to see if any paint operations are particularly expensive. If you find anything, check whether a different CSS property gives the same look and feel with better performance.
Use the will-change property sparingly, and only if you encounter
a performance issue.