Published: March 31, 2014
The foundation of every solid performance strategy is good measurement and instrumentation. You can't optimize what you can't measure. This guide explains different approaches for measuring critical rendering path (CRP) performance.
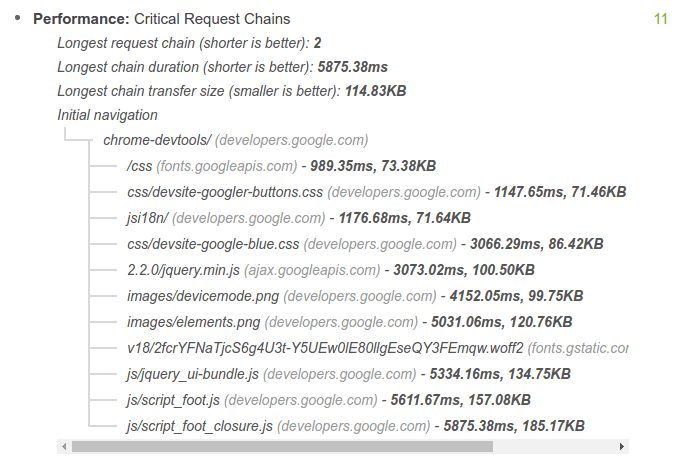
- The Lighthouse approach runs a series of automated tests against a page, and then generates a report on the page's CRP performance. This approach provides a quick and basic high-level overview of CRP performance of a particular page loaded in your browser, allowing you to rapidly test, iterate, and improve its performance.
- The Navigation Timing API approach captures Real User Monitoring (RUM) metrics. As the name implies, these metrics are captured from real user interactions with your site and provide an accurate view into real-world CRP performance, as experienced by your users across a variety of devices and network conditions.
In general, a good approach is to use Lighthouse to identify obvious CRP optimization opportunities, and then to instrument your code with the Navigation Timing API to monitor how your app performs out in the wild.
Audit a page with Lighthouse
Lighthouse is a web app auditing tool that runs a series of tests against a given page, and then displays the page's results in a consolidated report. You can run Lighthouse as a Chrome Extension or NPM module, which is useful for integrating Lighthouse with continuous integration systems.
Read Auditing Web Apps With Lighthouse to get started.

Instrument your code with the Navigation Timing API
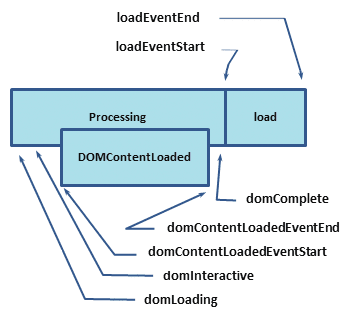
The combination of the Navigation Timing API and other browser events emitted as the page loads lets you capture and record the real-world CRP performance of any page.

So, what do these timestamps mean?
domLoading: this is the starting timestamp of the entire process, the browser is about to start parsing the first received bytes of the HTML document.domInteractive: marks the point when the browser has finished parsing all of the HTML and DOM construction is complete.domContentLoaded: marks the point when both the DOM is ready and there are no stylesheets that are blocking JavaScript execution—meaning we can now (potentially) construct the render tree.- Many JavaScript frameworks wait for this event before they start executing
their own logic. For this reason the browser captures the
EventStartandEventEndtimestamps to allow us to track how long this execution took.
- Many JavaScript frameworks wait for this event before they start executing
their own logic. For this reason the browser captures the
domComplete: as the name implies, all of the processing is complete and all of the resources on the page (images, etc.) have finished downloading—in other words, the loading spinner has stopped spinning.loadEvent: as a final step in every page load the browser fires anonloadevent which can trigger additional application logic.
The HTML specification dictates specific conditions for each and every event: when it should be fired, which conditions should be met, and other important considerations
For our purposes, we focus on a few key milestones for CRP:
domInteractivemarks when DOM is ready.domContentLoadedtypically marks when both the DOM and CSSOM are ready.- If there is no parser blocking JavaScript then
DOMContentLoadedfires immediately afterdomInteractive.
- If there is no parser blocking JavaScript then
domCompletemarks when the page and all of its subresources are ready.
<!DOCTYPE html>
<html>
  <head>
    <title>Critical Path: Measure</title>
    <meta name="viewport" content="width=device-width,initial-scale=1" />
    <link href="style.css" rel="stylesheet" />
    <script>
      function measureCRP() {
        var t = window.performance.timing,
          interactive = t.domInteractive - t.domLoading,
          dcl = t.domContentLoadedEventStart - t.domLoading,
          complete = t.domComplete - t.domLoading;
        var stats = document.createElement('p');
        stats.textContent =
          'interactive: ' +
          interactive +
          'ms, ' +
          'dcl: ' +
          dcl +
          'ms, complete: ' +
          complete +
          'ms';
        document.body.appendChild(stats);
      }
    </script>
  </head>
  <body onload="measureCRP()">
    <p>Hello <span>web performance</span> students!</p>
    <div><img src="awesome-photo.jpg" /></div>
  </body>
</html>
In this example, the Navigation Timing API captures all the relevant timestamps.
Our code waits for the onload event to fire, which is after domInteractive, domContentLoaded and domComplete. It then computes the difference between
the various timestamps.

We now have some specific milestones to track and a basic function to output these measurements. You can modify this code to send these metrics to an analytics server instead of printing the results. Then you can keep track of your page performance and identify pages that can benefit from optimization.
What about DevTools?
Although these docs sometimes use the Chrome DevTools Network panel to illustrate CRP concepts, DevTools is not well-suited for CRP measurements because it does not have a built-in mechanism for isolating critical resources. Run a Lighthouse audit to help identify such resources.

