
Learn how to attribute your performance data with debug information to help you identify and fix real-user issues with analytics

Google provides two categories of tools to measure and debug performance:
- Lab tools: Tools such as Lighthouse, where your page is loaded in a simulated environment that can mimic various conditions (for example, a slow network and a low-end mobile device).
- Field tools: Tools such as Chrome User Experience Report (CrUX), which is based on aggregate, real-user data from Chrome. (Note that the field data reported by tools such as PageSpeed Insights and Search Console is sourced from CrUX data.)
While field tools offer more accurate data—data which actually represents what real users experience—lab tools are often better at helping you identify and fix issues.
CrUX data is more representative of your page's real performance, but knowing your CrUX scores is unlikely to help you figure out how to improve your performance.
Lighthouse, on the other hand, will identify issues and make specific suggestions for how to improve. However, Lighthouse will only make suggestions for performance issues it discovers at page load time. It does not detect issues that only manifest as a result of user interaction such as scrolling or clicking buttons on the page.
This raises an important question: how can you capture debug information for Core Web Vitals or other performance metrics from real users in the field?
This post will explain in detail what APIs you can use to collect additional debugging information for each of the current Core Web Vitals metrics and give you ideas for how to capture this data in your existing analytics tool.
APIs for attribution and debugging
Cumulative Layout Shift (CLS)
Of all the Core Web Vitals metrics, CLS is perhaps the one for which collecting debug information in the field is the most important. CLS is measured throughout the entire lifespan of the page, so the way a user interacts with the page—how far they scroll, what they click, and so on—can have a significant impact on whether there are layout shifts and which elements are shifting.
Consider the following report from PageSpeed Insights:
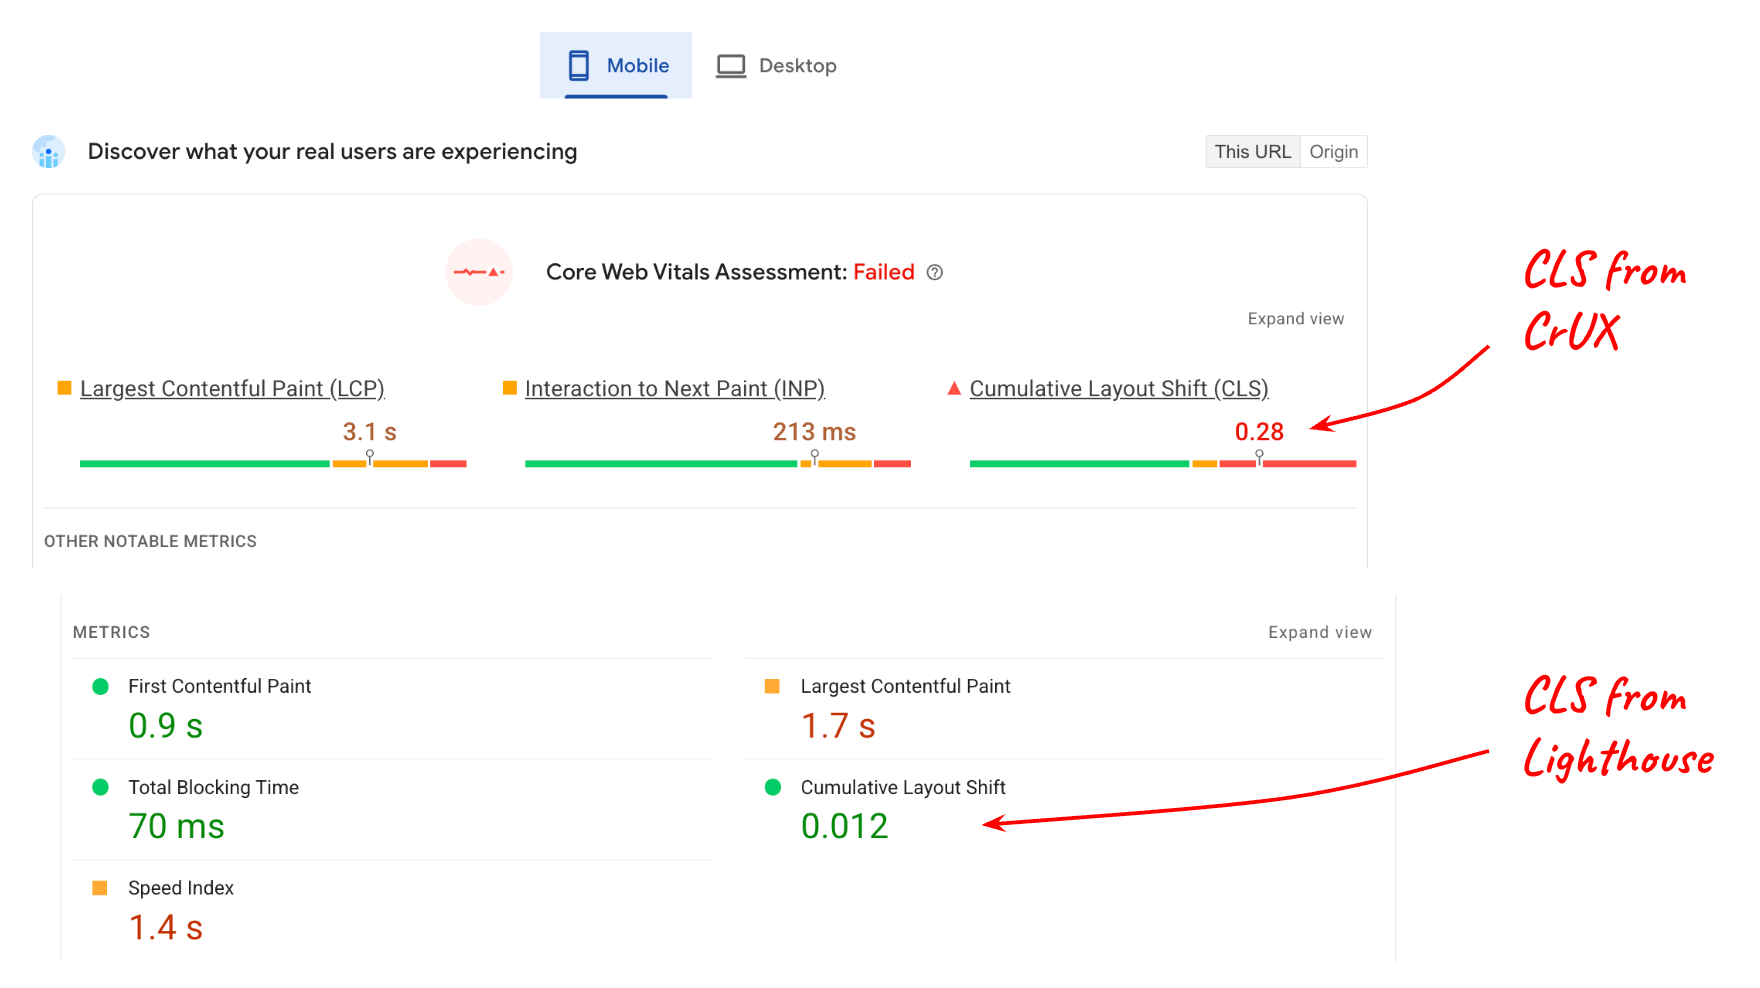
The value reported for CLS from the lab (Lighthouse) compared to the CLS from the field (CrUX data) are quite different, and this makes sense if you consider that the page may have a lot of interactive content that is not being used when tested in Lighthouse.
But even if you understand that user interaction affects field data, you still need to know what elements on the page are shifting to result in a score of 0.28 at the 75th percentile. The LayoutShiftAttribution interface makes that possible.
Get layout shift attribution
The LayoutShiftAttribution
interface is exposed on each layout-shift entry that Layout Instability
API emits.
For a detailed explanation of both of these interfaces, see Debug layout shifts. For the purposes of this post, the main thing you need to know is that, as a developer, you are able to observe every layout shift that happens on the page as well as what elements are shifting.
Here's some example code that logs each layout shift as well as the elements that shifted:
new PerformanceObserver((list) => {
  for (const {value, startTime, sources} of list.getEntries()) {
    // Log the shift amount and other entry info.
    console.log('Layout shift:', {value, startTime});
    if (sources) {
      for (const {node, curRect, prevRect} of sources) {
        // Log the elements that shifted.
        console.log('  Shift source:', node, {curRect, prevRect});
      }
    }
  }
}).observe({type: 'layout-shift', buffered: true});
It's probably not practical to measure and send data to your analytics tool for every single layout shift that occurs; however, by monitoring all shifts, you can keep track of the worst shifts and just report information about those.
The goal isn't to identify and fix every single layout shift that occurs for every user; the goal is to identify the shifts that affect the largest number of users and thus contribute the most to your page's CLS at the 75th percentile.
Also, you don't need to compute the largest source element every time there's a shift, you only need to do so when you're ready to send the CLS value to your analytics tool.
The following code takes a list of layout-shift entries that have contributed
to CLS and returns the largest source element from the largest shift:
function getCLSDebugTarget(entries) {
  const largestEntry = entries.reduce((a, b) => {
    return a && a.value > b.value ? a : b;
  });
  if (largestEntry && largestEntry.sources && largestEntry.sources.length) {
    const largestSource = largestEntry.sources.reduce((a, b) => {
      return a.node && a.previousRect.width * a.previousRect.height >
          b.previousRect.width * b.previousRect.height ? a : b;
    });
    if (largestSource) {
      return largestSource.node;
    }
  }
}
Once you've identified the largest element contributing to the largest shift, you can report that to your analytics tool.
The element contributing the most to CLS for a given page will likely vary from user to user, but if you aggregate those elements across all users, you'll be able to generate a list of shifting elements affecting the most number of users.
After you've identified and fixed the root cause of the shifts for those elements, your analytics code will start reporting smaller shifts as the "worst" shifts for your pages. Eventually, all reported shifts will be small enough that your pages are well within the "good" threshold of 0.1!
Some other metadata that may be useful to capture along with the largest shift source element is:
- The time of the largest shift
- The URL path at the time of the largest shift (for sites that dynamically update the URL, such as Single Page Applications).
Largest Contentful Paint (LCP)
To debug LCP in the field, the primary information you need is which particular element was the largest element (the LCP candidate element) for that particular page load.
Note that it's entirely possible—in fact, it's quite common—that the LCP candidate element will be different from user to user, even for the exact same page.
This can happen for several reasons:
- User devices have different screen resolutions, which results in different page layouts and thus different elements being visible within the viewport.
- Users don't always load pages scrolled to the very top. Oftentimes links will contain fragment identifiers or even text fragments, which means it's possible for your pages to be loaded and displayed at any scroll position on the page.
- Content may be personalized for the current user, so the LCP candidate element could vary wildly from user to user.
This means you cannot make assumptions about which element or set of elements will be the most common LCP candidate element for a particular page. You have to measure it based on real-user behavior.
Identify the LCP candidate element
To determine the LCP candidate element in JavaScript you can use the Largest Contentful Paint API, the same API you use to determine the LCP time value.
When observing largest-contentful-paint entries, you can determine the
current LCP candidate element by looking at the element property of the last entry:
new PerformanceObserver((list) => {
  const entries = list.getEntries();
  const lastEntry = entries[entries.length - 1];

  console.log('LCP element:', lastEntry.element);
}).observe({type: 'largest-contentful-paint', buffered: true});
Once you know the LCP candidate element, you can send it to your analytics tool along with the metric value. As with CLS, this will help you identify which elements are most important to optimize first.
In addition to the LCP candidate element, it may also be useful to measure the LCP sub-part times, which can be useful in determining what specific optimization steps are relevant for your site.
Interaction to Next Paint (INP)
The most important bits of information to capture in the field for INP are:
- What element was interacted with
- Why type of interaction it was
- When that interaction took place
A major cause of slow interactions is a blocked main thread, which can be common while JavaScript is loading. Knowing whether most slow interactions occur during page load is helpful in determining what needs to be done to fix the problem.
The INP metric considers the full latency of an interaction—including the time it takes to run any registered event listeners as well as the time it takes to paint the next frame after all events listeners have run. This means that for INP it's really useful to know which target elements tend to result in slow interactions, and what types of interactions those are.
The following code logs the target element and time of the INP entry.
function logINPDebugInfo(inpEntry) {
  console.log('INP target element:', inpEntry.target);
  console.log('INP interaction type:', inpEntry.name);
  console.log('INP time:', inpEntry.startTime);
}
Note that this code doesn't show how to determine which event entry is the INP
entry, as that logic is more involved. However, the following section explains
how to get this information using the
web-vitals JavaScript library.
Usage with the web-vitals JavaScript library
The previous sections offer some general suggestions and code examples to capture debug info to include in the data you send to your analytics tool.
Since version 3, the web-vitals JavaScript library includes an attribution build that surfaces all of this information, and a few additional signals as well.
The following code example shows how you could set an additional event parameter (or custom dimension) containing a debug string useful for helping to identify the root cause of performance issues.
import {onCLS, onINP, onLCP} from 'web-vitals/attribution';

function sendToGoogleAnalytics({name, value, id, attribution}) {
  const eventParams = {
    metric_value: value,
    metric_id: id,
  }

  switch (name) {
    case 'CLS':
      eventParams.debug_target = attribution.largestShiftTarget;
      break;
    case 'LCP':
      eventParams.debug_target = attribution.element;
      break;
    case 'INP':
      eventParams.debug_target = attribution.interactionTarget;
      break;
  }

  // Assumes the global `gtag()` function exists, see:
  // https://developers.google.com/analytics/devguides/collection/ga4
  gtag('event', name, eventParams);
}

onCLS(sendToGoogleAnalytics);
onLCP(sendToGoogleAnalytics);
onINP(sendToGoogleAnalytics);
This code is specific to Google Analytics, but the general idea should translate to other analytics tools as well.
This code also just shows how to report on a single debug signal, but it is useful to be able to collect and report on multiple different signals per metric.
For example, to debug INP you might want to collect the element being interacted with, the interaction type, the time, the loadState, the interaction phases and more (such as Long Animation Frame data).
The web-vitals attribution build exposes additional attribution information,
as shown in the following example for INP:
import {onCLS, onINP, onLCP} from 'web-vitals/attribution';

function sendToGoogleAnalytics({name, value, id, attribution}) {
  const eventParams = {
    metric_value: value,
    metric_id: id,
  }

  switch (name) {
    case 'INP':
      eventParams.debug_target = attribution.interactionTarget;
      eventParams.debug_type = attribution.interactionType;
      eventParams.debug_time = attribution.interactionTime;
      eventParams.debug_load_state = attribution.loadState;
      eventParams.debug_interaction_delay = Math.round(attribution.inputDelay);
      eventParams.debug_processing_duration = Math.round(attribution.processingDuration);
      eventParams.debug_presentation_delay =  Math.round(attribution.presentationDelay);
      break;

    // Additional metric logic...
  }

  // Assumes the global `gtag()` function exists, see:
  // https://developers.google.com/analytics/devguides/collection/ga4
  gtag('event', name, eventParams);
}

onCLS(sendToGoogleAnalytics);
onLCP(sendToGoogleAnalytics);
onINP(sendToGoogleAnalytics);
Refer to the web-vitals attribution documentation for the complete list of debug signals exposed.
Report and visualize the data
Once you've started collecting debug information along with the metric values, the next step is aggregating the data across all your users to start looking for patterns and trends.
As mentioned previously, you don't necessarily need to address every single issue your users are encountering, you want to address—especially at first—the issues that are affecting the largest number of users, which should also be the issues that have the largest negative impact on your Core Web Vitals scores.
For GA4 see the dedicated article on how to query and visualize the data using BigQuery.
Summary
Hopefully this post has helped outline the specific ways you can use the
existing performance APIs and the web-vitals library to get debug information
to help diagnose performance based on real users visits in the field. While this
guide is focused on the Core Web Vitals, the concepts also apply to debugging
any performance metric that's measurable in JavaScript.
If you're just getting started measuring performance, and you're already a Google Analytics user, the Web Vitals Report tool may be a good place to start because it already supports reporting debug information for the Core Web Vitals metrics.
If you're an analytics vendor and you're looking to improve your products and provide more debugging information to your users, consider some of the techniques described here but don't limit yourself to just the ideas presented here. This post is intended to be generally applicable to all analytics tools; however, individual analytics tools likely can (and should) capture and report even more debug information.
Lastly, if you feel there are gaps in your ability to debug these metrics due to missing features or information in the APIs themselves send your feedback to web-vitals-feedback@googlegroups.com.