
Learn how to take your field data into the lab to reproduce and identify the causes behind slow interactions through manual testing.

Published: May 9, 2023
A challenging part of optimizing Interaction to Next Paint (INP) is figuring out what's causing poor INP. There's a lot of potential causes, such as third-party scripts that schedule many tasks on the main thread, large DOM sizes, expensive event callbacks, and other culprits.
Improving INP can be difficult. To start, you have to know which interactions tend to be responsible for a page's INP. If you don't know which interactions on your website tend to be the slowest from a real user perspective, read Find slow interactions in the field. Once you have field data to guide you, you can test those specific interactions manually in lab tools to figure out why those interactions are slow.
What if you don't have field data?
Having field data is vital, as it saves you lots of time trying to figure out which interactions need to be optimized. You might be in a position where you don't have field data, though. If that describes your situation, it's still possible to find interactions to improve, although it requires a bit more effort and a different approach.
Total Blocking Time (TBT) is a lab metric that assesses page responsiveness during load, and it correlates well with INP. If your page has a high TBT, that's a potential signal that your page may not be very responsive to user interactions as the page loads.
To figure out your page's TBT, you can use either Lighthouse. If a page's TBT is high, there's a chance that the main thread is too busy during page load, and that can affect how responsive a page is during that crucial time in the page lifecycle.
To find slow interactions after the page has loaded, you might need other types of data, such as common user flows that you may already have identified in your website's analytics. If you work on an ecommerce website, for example, a common user flow would be the actions users take when they're adding items to an online shopping cart and checking out.
Whether or not you have field data, the next step is to manually test and reproduce slow interactions—because it's only when you're able to reproduce a slow interaction that you can fix it.
Reproduce slow interactions in the lab
There are a number of ways you can reproduce slow interactions in the lab through manual testing, but the following is a framework you can try.
DevTools Performance panel live metrics
The DevTools performance profiler is the recommended approach to diagnosing interactions known to be slow, but it can take time to identify slow interactions when you don't know which interactions are your problematic ones.
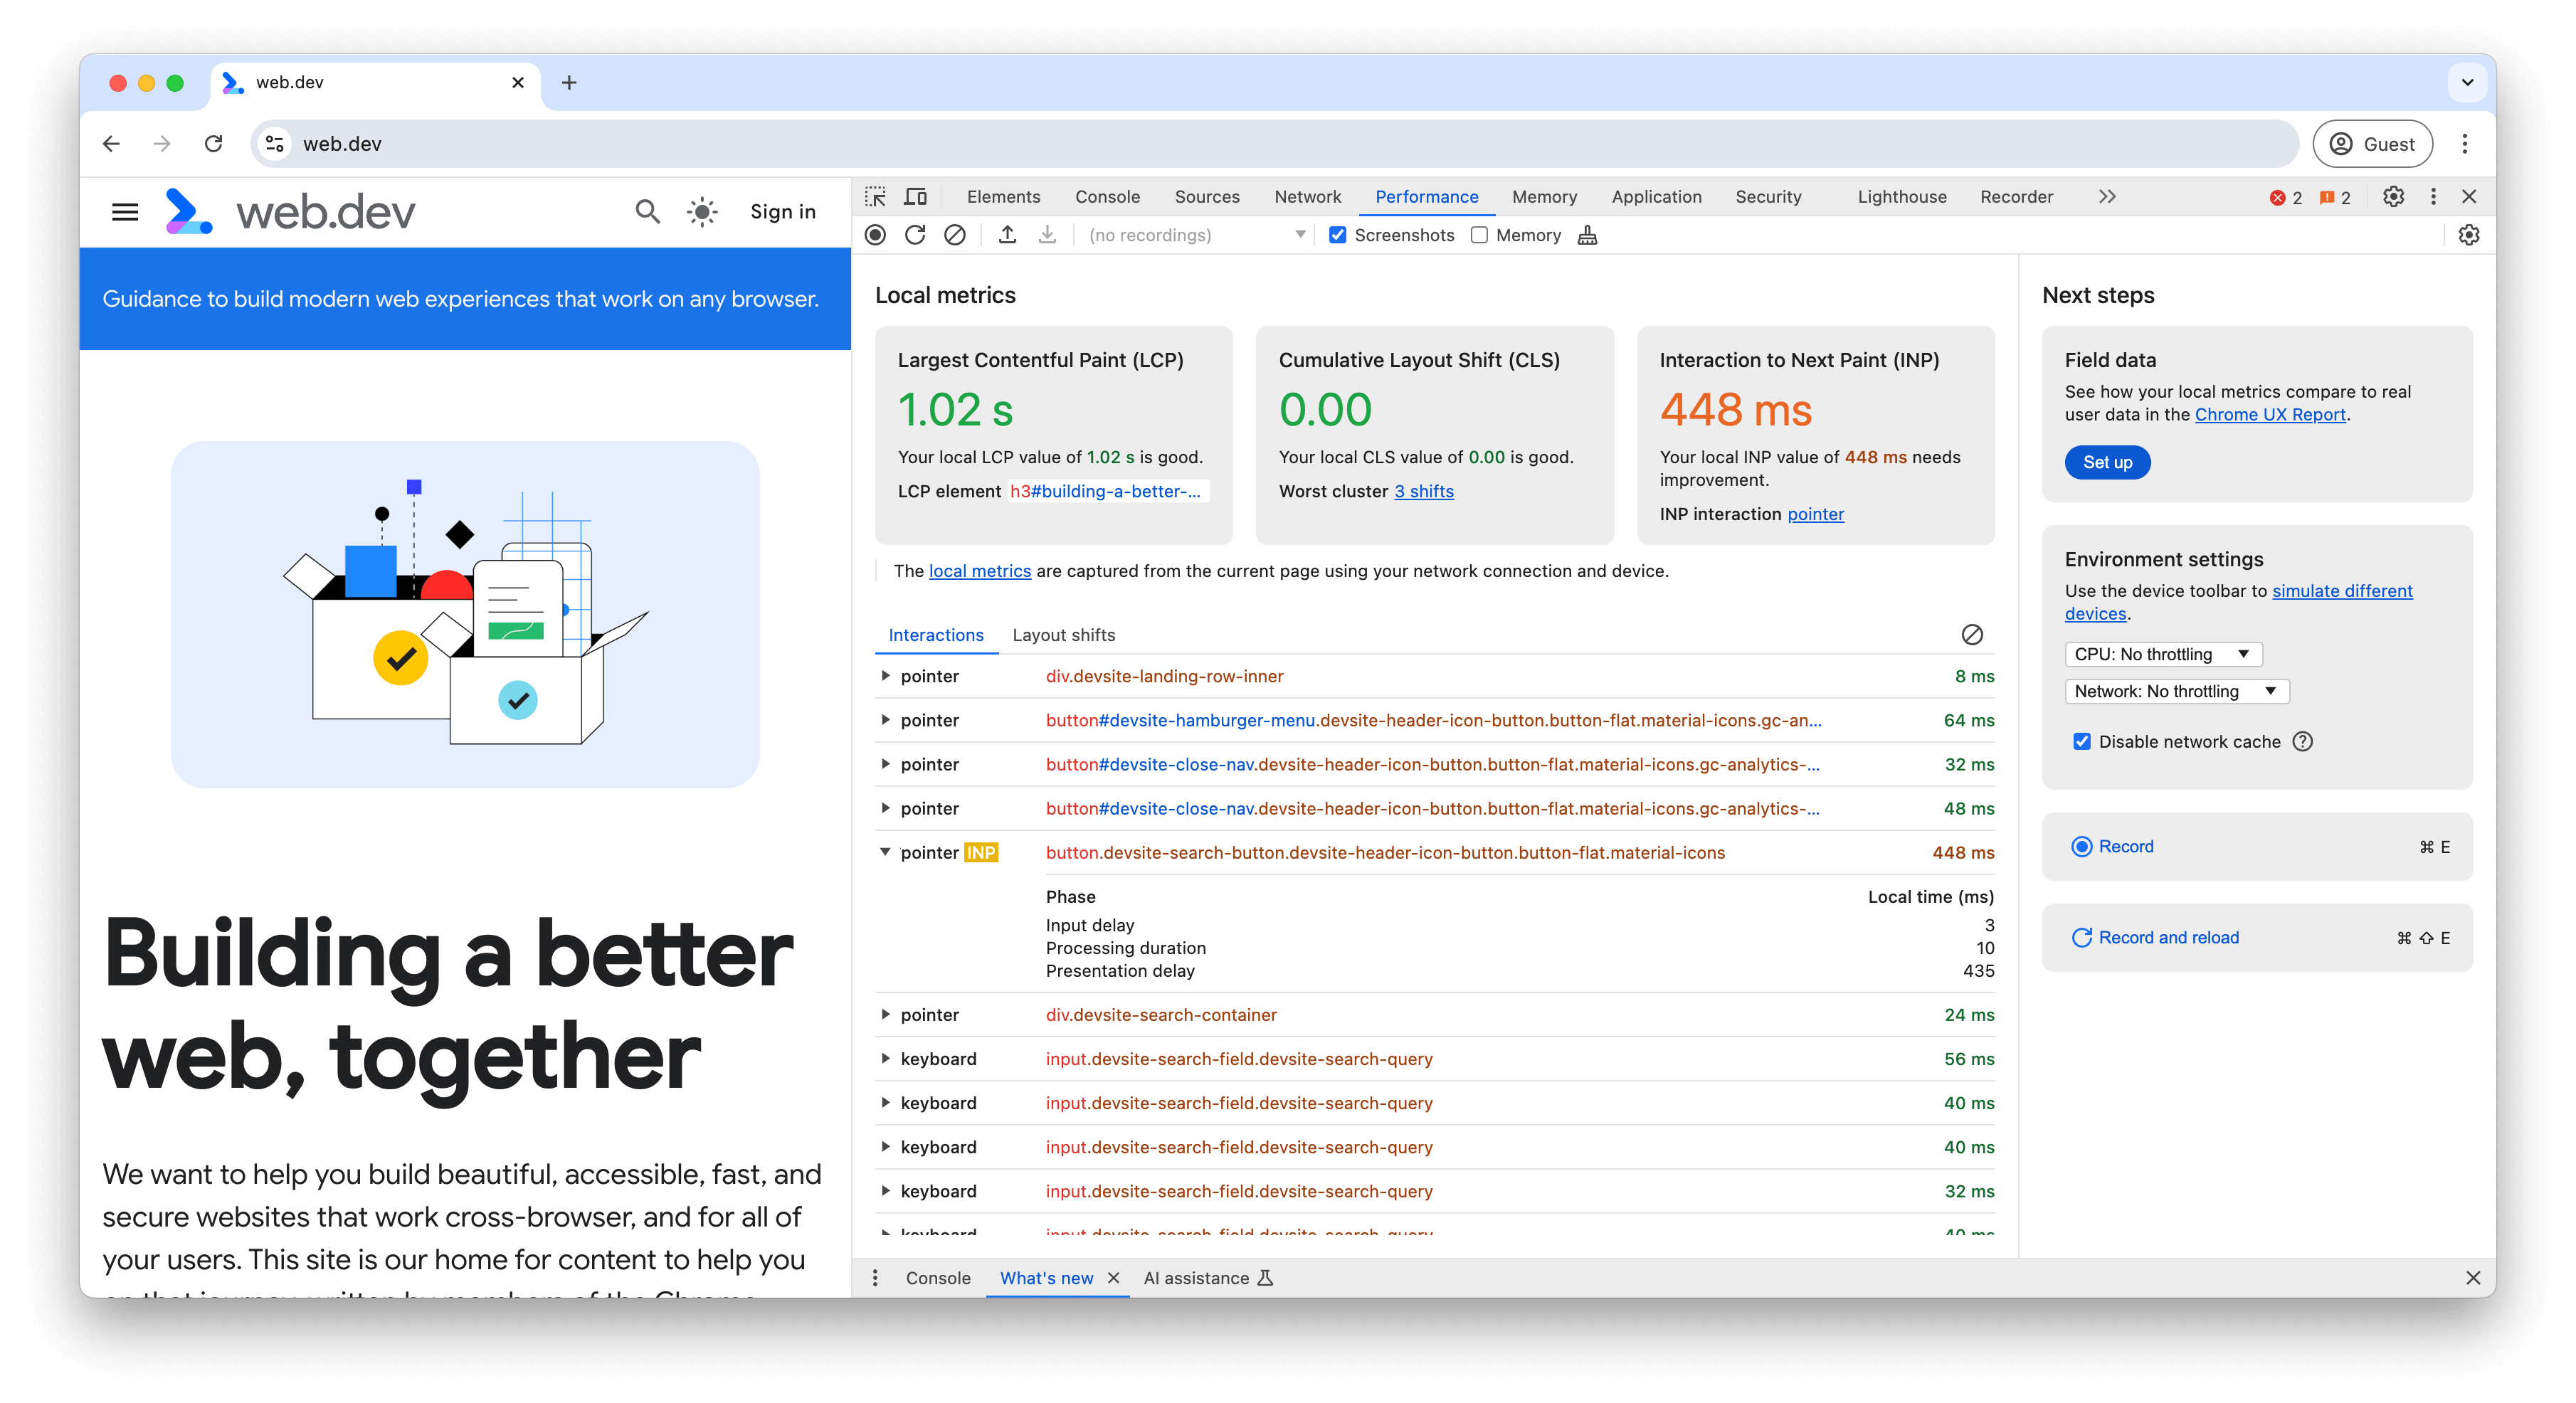
When you first open the Performance panel you will see a live metrics view. This can be used to quickly try out a number of interactions to find the problematic ones, before you move into the more detailed performance profiler. As you interact, diagnostic data will appear in the Interactions log (with the INP interaction highlighted). These interactions can be expanded to get the phase breakdowns:
While the live metrics view helps identify slow interactions, and provides some details to help you debug INP, you may still need to use the performance profiler to diagnose slow interactions, as it provides the detailed data you'll need to navigate through your website's production code to find the causes behind slow interactions.
Record a trace
Chrome's performance profiler is the recommended tool for diagnosing and troubleshooting slow interactions. To profile an interaction in Chrome's performance profiler, follow these steps:
- Have the page you want to test open.
- Open Chrome DevTools and go to the Performance panel.
- Click the Record button at the upper left of the panel to start tracing.
- Perform the interaction(s) you want to troubleshoot.
- Click the Record button again to stop tracing.
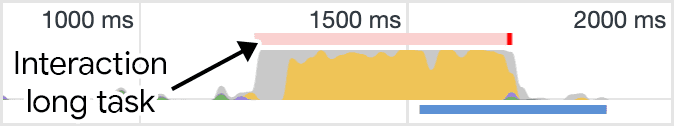
When the profiler populates, the first place to look should be the activity summary at the top of the profiler. The activity summary shows red bars at the top where long tasks occurred in the recording. This lets you quickly zoom in on problem areas.
You can quickly focus on problem areas by dragging and selecting a region in the activity summary. You can optionally use the breadcrumbs feature in the profiler to help you narrow the timeline down and ignore unrelated activity.
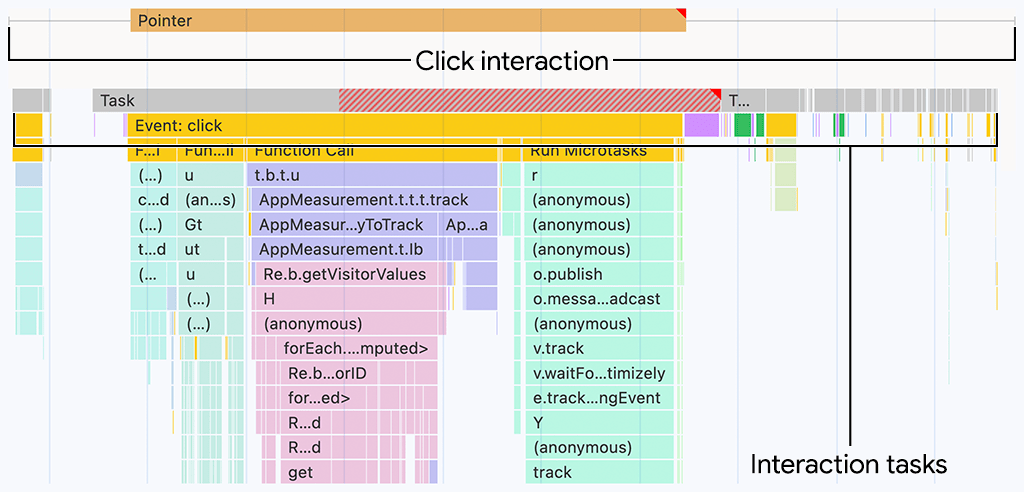
Once you've focused to where the interaction occurred, the Interactions track helps you line up the interaction and the activity that occurred in the main thread track beneath it:
You can get additional details on which part of the interaction was longest by hovering over the interaction in the interactions track:
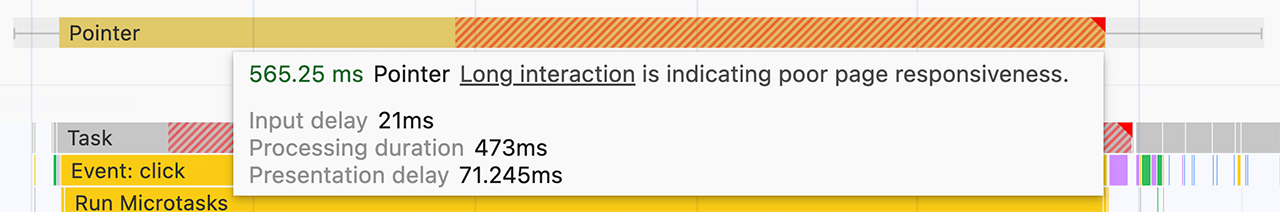
The striped portion of the interaction represents how much time of the interaction exceeded 200 milliseconds, which is the upper limit of the "good" threshold for a page's INP. The portions of the interaction listed are:
- The input delay—visualized by the left whisker.
- The processing duration—visualized by the solid block between the left and right whiskers.
- The presentation delay—visualized by the right whisker.
From here, it's a matter of digging deeper into the problem(s) causing the slow interaction, which is covered later on in this guide.
How to identify which part of an interaction is slow
Interactions consist of three parts: the input delay, the processing duration, and the presentation delay. How you optimize an interaction to lower a page's INP depends on which part of it taking the most time.
How to identify long input delays
Input delays can cause high interaction latency. The input delay is the first part of an interaction. This is the period of time from when the user action is first received by the operating system to the point at which the browser is able to start processing that interaction's first event handler callback.
Identifying input delays in Chrome's performance profiler can be done by locating the interaction in the interactions track. The length of the left whisker indicates the portion of the interaction's input delay, and the precise value can be found in a tooltip by hovering over the interaction in the performance profiler.
Input delays can never be zero, but you do have some control over how long the input delay is. The key is to figure out if there is work running on the main thread that's preventing your callbacks from running as soon as they should.
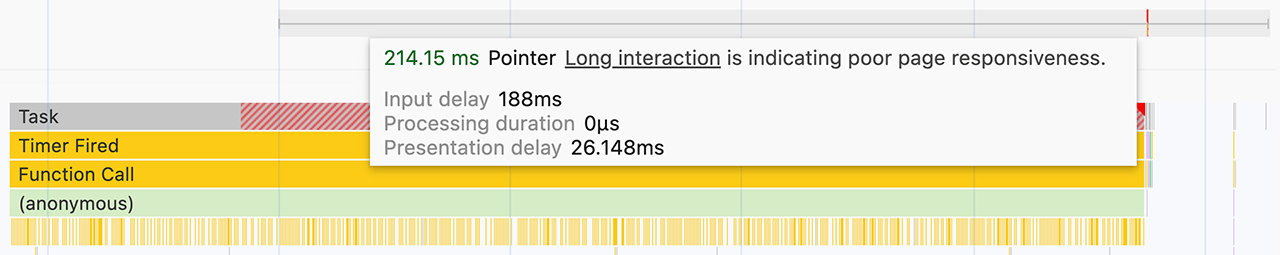
In the previous figure, a task from a third-party script is running as the user attempts to interact with the page, and therefore extends the input delay. The extended input delay affects the interaction's latency, and could therefore affect the page's INP.
How to identify long processing durations
Event callbacks run immediately after the input delay, and the time they take to complete is known as the processing duration. If event callbacks run for too long, they delay the browser from presenting the next frame, and can add significantly to an interaction's total latency. Long processing durations can be the result of computationally expensive first-party or third-party JavaScript—and in some cases, both. In the performance profiler, this is represented by the solid portion of the interaction in the interactions track.
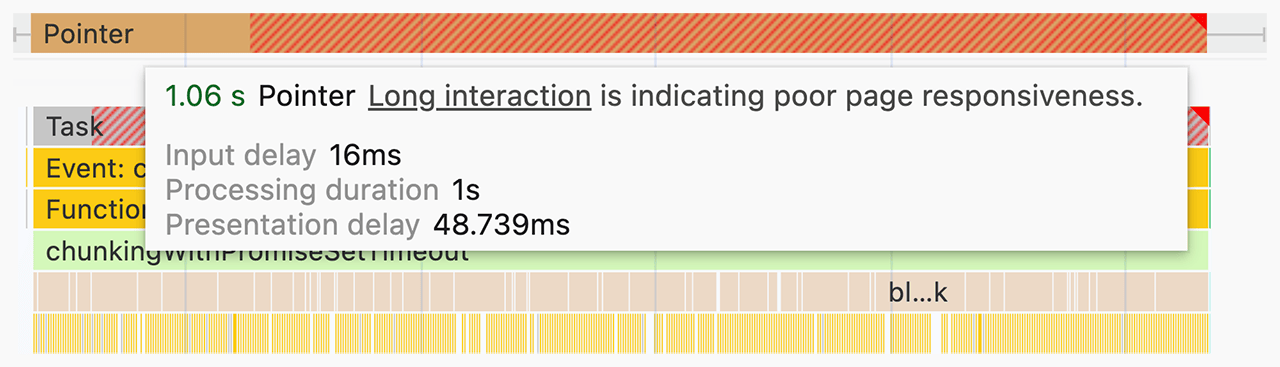
Finding expensive event callbacks can be done by observing the following in a trace for a specific interaction:
- Determine whether the task associated with the event callbacks is a long task. To reveal long tasks in a lab setting more reliably, you may need to enable CPU throttling in the performance panel, or connect a low to mid-tier Android device and use remote debugging.
- If the task that runs the event callbacks is a long task, look for event handler entries—for example,entries with names such as Event: click—in the call stack that have a red triangle at the upper right corner of the entry.
You can try one of the following strategies to reduce an interaction's processing duration:
- Do as little work as possible. Is everything that happens in an expensive event callback strictly necessary? If not, consider removing that code altogether if possible, or deferring its execution to a later point in time if you can't. You can also take advantage of framework features to help. For example, React's memoization feature can skip unnecessary rendering work for a component when its props haven't changed.
- Defer non-rendering work in the event callback to a later point in time. Long tasks can be broken up by yielding to the main thread. Whenever you yield to the main thread, you're ending execution of the current task and breaking up the remainder of the work into a separate task. This gives the renderer a chance to process updates to the user interface that were performed earlier in the event callback. If you happen to be using React, its transitions feature can do this for you.
These strategies should be able to help you optimize event callbacks so that they're taking less time to run.
How to identify presentation delays
Long input delays and processing durations aren't the only causes of poor INP. Sometimes the rendering updates that occur in response to even small amounts of event callback code can be expensive. The time it takes for the browser to render visual updates to the user interface to reflect the result of an interaction is known as presentation delay.
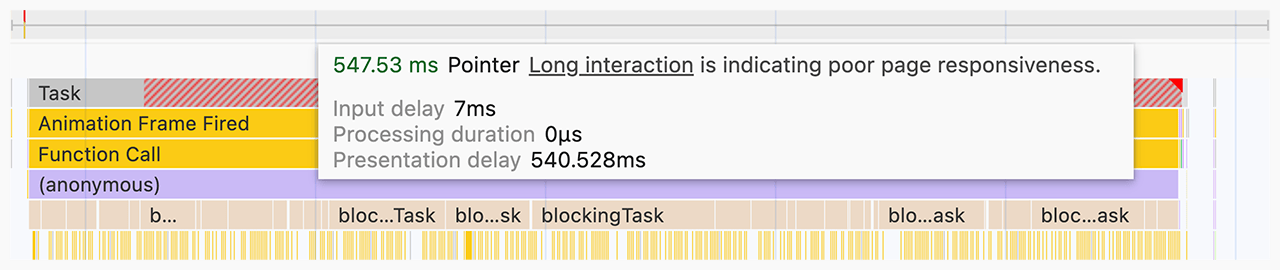
Rendering work most often consists of tasks such as style recalculation, layout, paint, and composite, and are represented by purple and green blocks in the profiler's flame chart. The total presentation delay is represented by the interaction's right whisker in the interactions track.
Of all the possible causes of high interaction latency, presentation delays can be the most difficult to troubleshoot and fix. Excessive rendering work can be caused by any of the following:
- Large DOM sizes. The rendering work required to update a page's presentation often increases along with the size of the page's DOM. For more information, read How large DOM sizes affect interactivity—and what you can do about it.
- Forced reflows. This happens when you apply style changes to elements in JavaScript, and then immediately query the results of that work. The result is that the browser has to perform the layout work before doing anything else, so that the browser can return the updated styles. For more information and tips on avoiding forced reflows, read Avoid large, complex layouts and layout thrashing.
- Excessive or unnecessary work in
requestAnimationFramecallbacks.requestAnimationFrame()callbacks are run during the rendering phase of the event loop, and must complete before the next frame can be presented. If you're usingrequestAnimationFrame()to do work that doesn't involve changes to the user interface, understand that you could be delaying the next frame. ResizeObservercallbacks. Such callbacks run prior to rendering, and may delay presentation of the next frame if the work in them is expensive. As with event callbacks, defer any logic not needed for the next frame.
What if you can't reproduce a slow interaction?
What if your field data suggests a particular interaction is slow, but you can't manually reproduce the problem the lab? There are some reasons why this could be the case, but one important reason is that your circumstances as you test interactions are dependent on the your hardware and network connection. You may be using a fast device on a fast connection—but that doesn't mean your users are. You can do try one of three things if this applies to you:
- If you have a physical Android device, use remote debugging to open a Chrome DevTools instance on your host machine and try to reproduce slow interactions there. Mobile devices are often not as fast as laptops or desktop machines, so slow interactions may be more readily observed on these devices.
- If you don't have a physical device, enable the CPU throttling feature in Chrome DevTools.
- It could be that you're waiting for a page to load before interacting with it, but your users aren't. If you're on a fast network, simulate slower network conditions by enabling network throttling, then interact with the page as soon as it paints. You should do this because the main thread is often busiest during startup, and testing during that period of time may reveal what your users are experiencing.
Troubleshooting INP is an iterative process
Finding out what's causing high interaction latency that contributes to poor INP takes a lot of work—but if you can pin down the causes, you're halfway there. By following a methodical approach to troubleshooting poor INP, you can reliably pin down what's causing a problem, and arrive more quickly to the right fix. To review:
- Rely on field data to find slow interactions.
- Manually test problematic field interactions in the lab to see if they're reproducible.
- Identify whether the cause is due to long input delay, expensive event callbacks, or expensive rendering work.
- Repeat.
The last of these is the most important. Like most other work you do to improve page performance, troubleshooting and improving INP is a cyclical process. When you fix one slow interaction, move onto the next, and repeat until you start to see results.