As we build sites more heavily reliant on JavaScript, we sometimes pay for what we send down in ways that we can’t always easily see. In this article, we’ll cover why a little discipline can help if you’d like your site to load and be interactive quickly on mobile devices. Delivering less JavaScript can mean less time in network transmission, less spent decompressing code and less time parsing and compiling this JavaScript.
Network
When most developers think about the cost of JavaScript, they think about it in terms of the download and execution cost. Sending more bytes of JavaScript over the wire takes longer the slower a user’s connection is.
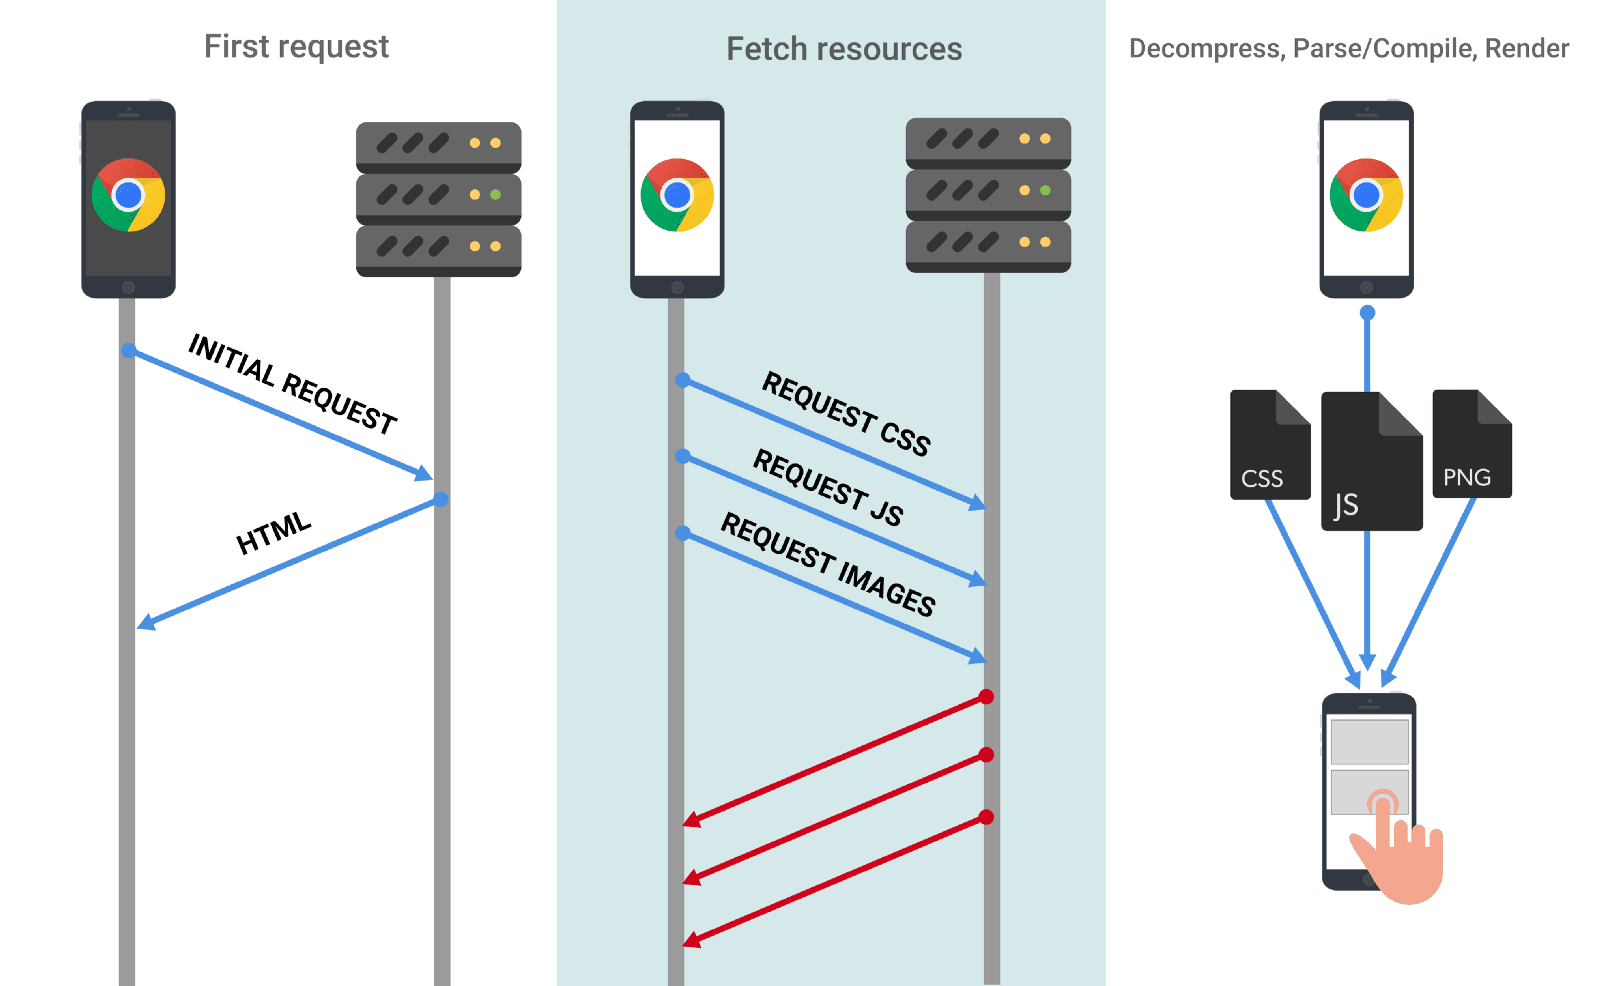
This can be a problem, as the effective network connection type a user has might not actually be 3G, 4G or Wi-Fi. You can be on coffee-shop Wi-Fi but connected to a cellular hotspot with 2G speeds.
You can reduce the network transfer cost of JavaScript through:
- Only sending the code a user needs.
- Use code-splitting to break up your JavaScript into what is critical and what is not. Module bundlers like webpack support code-splitting.
- Lazily loading in code that is non-critical.
- Minification
- Use UglifyJS for minifying ES5 code.
- Use babel-minify or uglify-es to minify ES2015+.
- Compression
- Removing unused code.
- Identify opportunities for code that can be removed or lazily loaded in with DevTools code coverage.
- Use babel-preset-env and browserlist to avoid transpiling features already in modern browsers. Advanced developers may find careful analysis of their webpack bundles helps identify opportunities to trim unneeded dependencies.
- For stripping code, see tree-shaking, Closure Compiler’s advanced optimizations and library trimming plugins like lodash-babel-plugin or webpack’s ContextReplacementPlugin for libraries like Moment.js.
- Caching code to minimize network trips.
- Use HTTP caching to ensure browsers cache responses effectively. Determine optimal lifetimes for scripts (max-age) and supply validation tokens (ETag) to avoid transferring unchanged bytes.
- Service Worker caching can make your app network resilient and give you eager access to features like V8’s code cache.
- Use long-term caching to avoid having to re-fetch resources that haven't changed. If using Webpack, see filename hashing.
Parse/Compile
Once downloaded, one of JavaScript’s heaviest costs is the time for a JS engine to parse/compile this code. In Chrome DevTools, parse and compile are part of the yellow "Scripting" time in the Performance panel.

The Bottom-Up and Call Tree tabs show you exact Parse/compile timings:

But, why does this matter?

Spending a long time parsing/compiling code can heavily delay how soon a user can interact with your site. The more JavaScript you send, the longer it will take to parse and compile it before your site is interactive.
Byte-for-byte, JavaScript is more expensive for the browser to process than the equivalently sized image or Web Font — Tom Dale
Compared to JavaScript, there are numerous costs involved in processing equivalently sized images (they still have to be decoded!) but on average mobile hardware, JS is more likely to negatively impact a page’s interactivity.
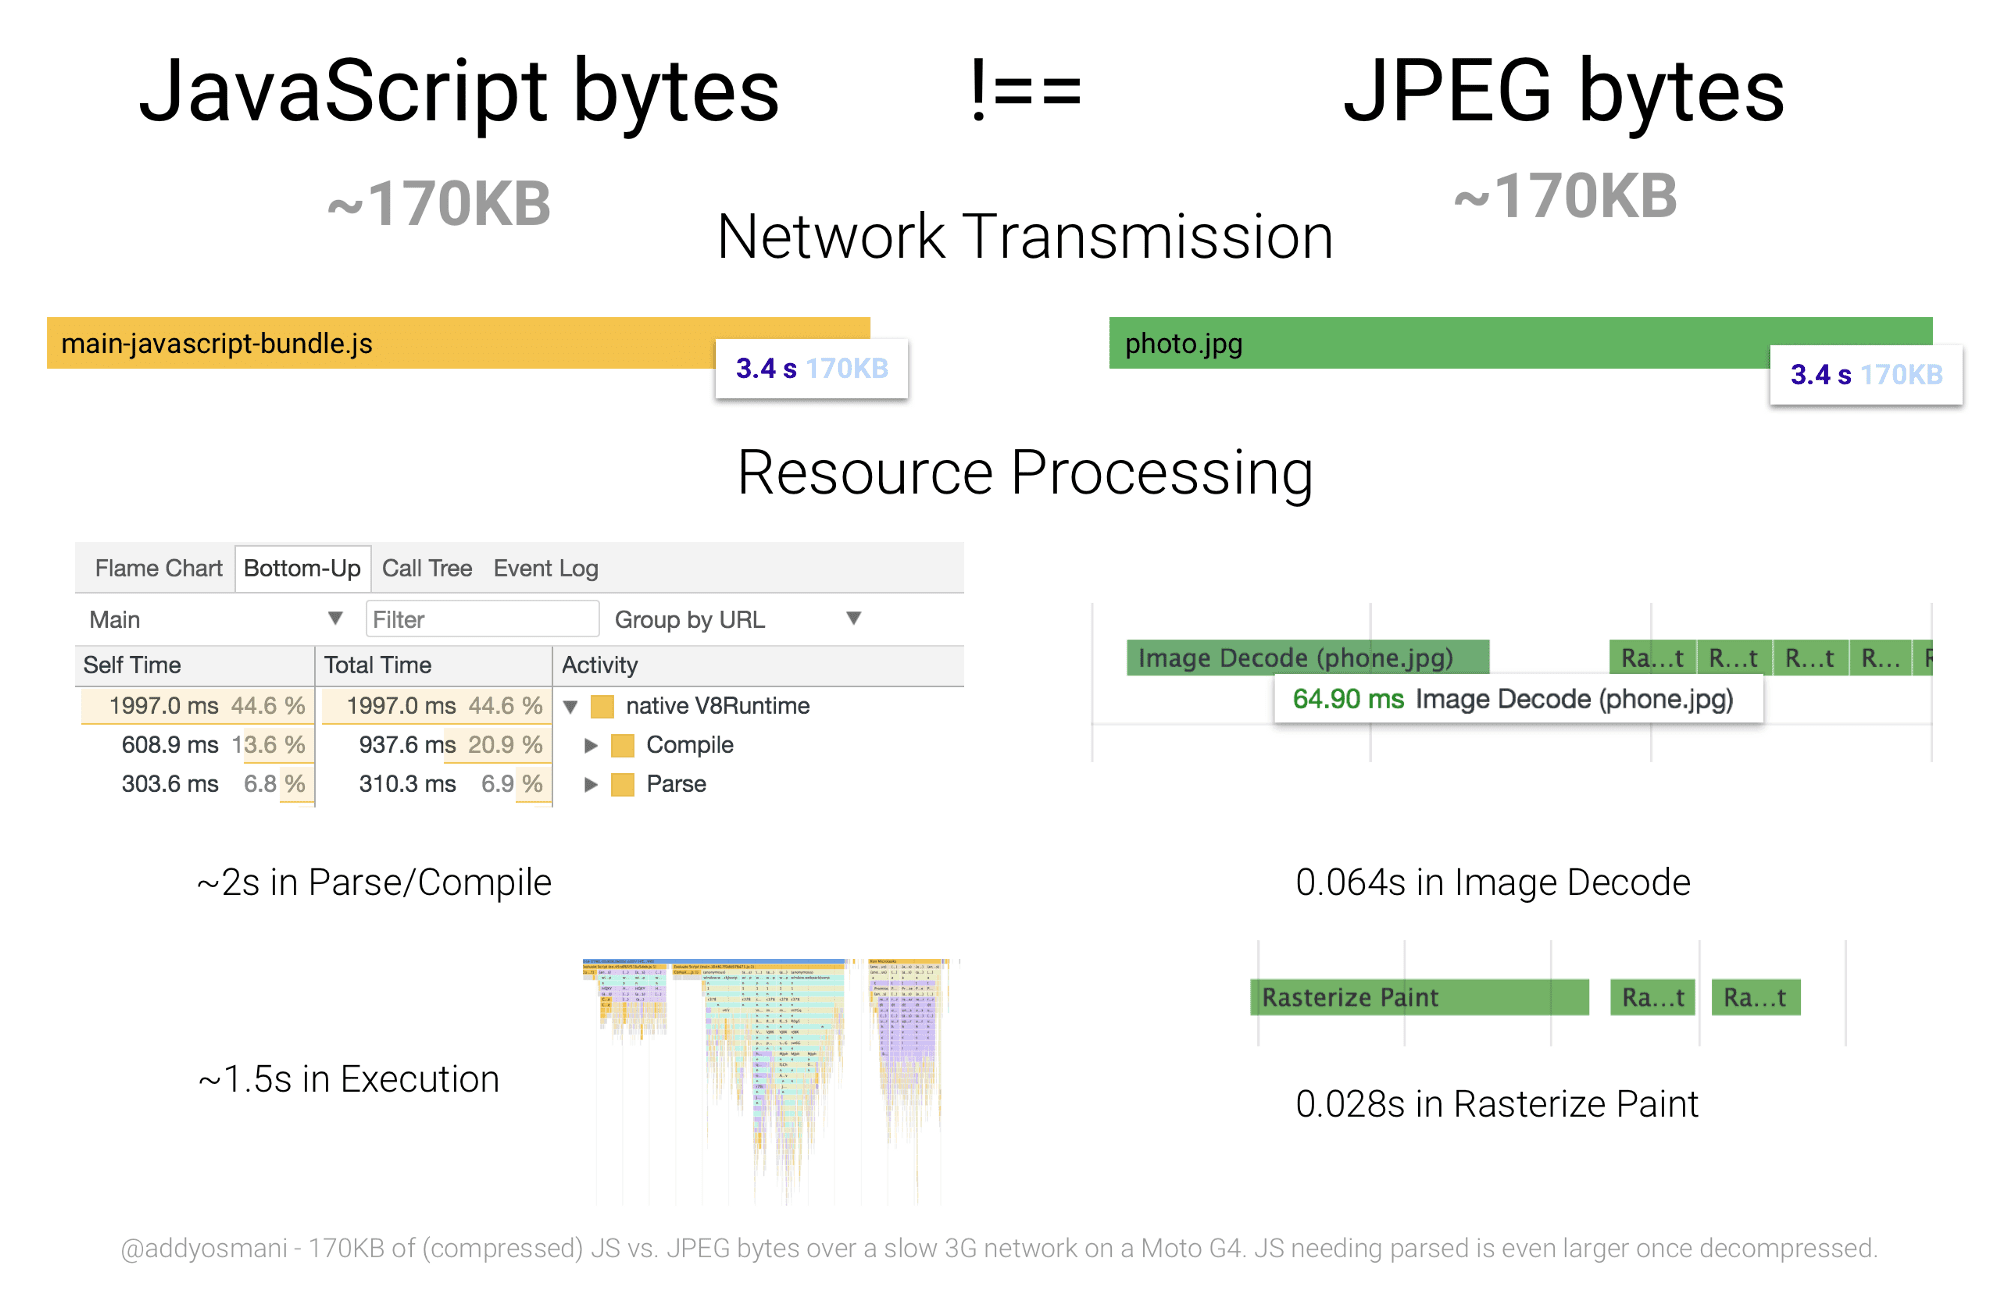
When we talk about parse and compile being slow; context is important — we’re talking about average mobile phones here. Average users can have phones with slow CPUs and GPUs, no L2/L3 cache and which may even be memory constrained.
Network capabilities and device capabilities don’t always match up. A user with an amazing Fiber connection doesn’t necessarily have the best CPU to parse and evaluate JavaScript sent to their device. This is also true in reverse… a terrible network connection, but a blazing fast CPU. — Kristofer Baxter, LinkedIn
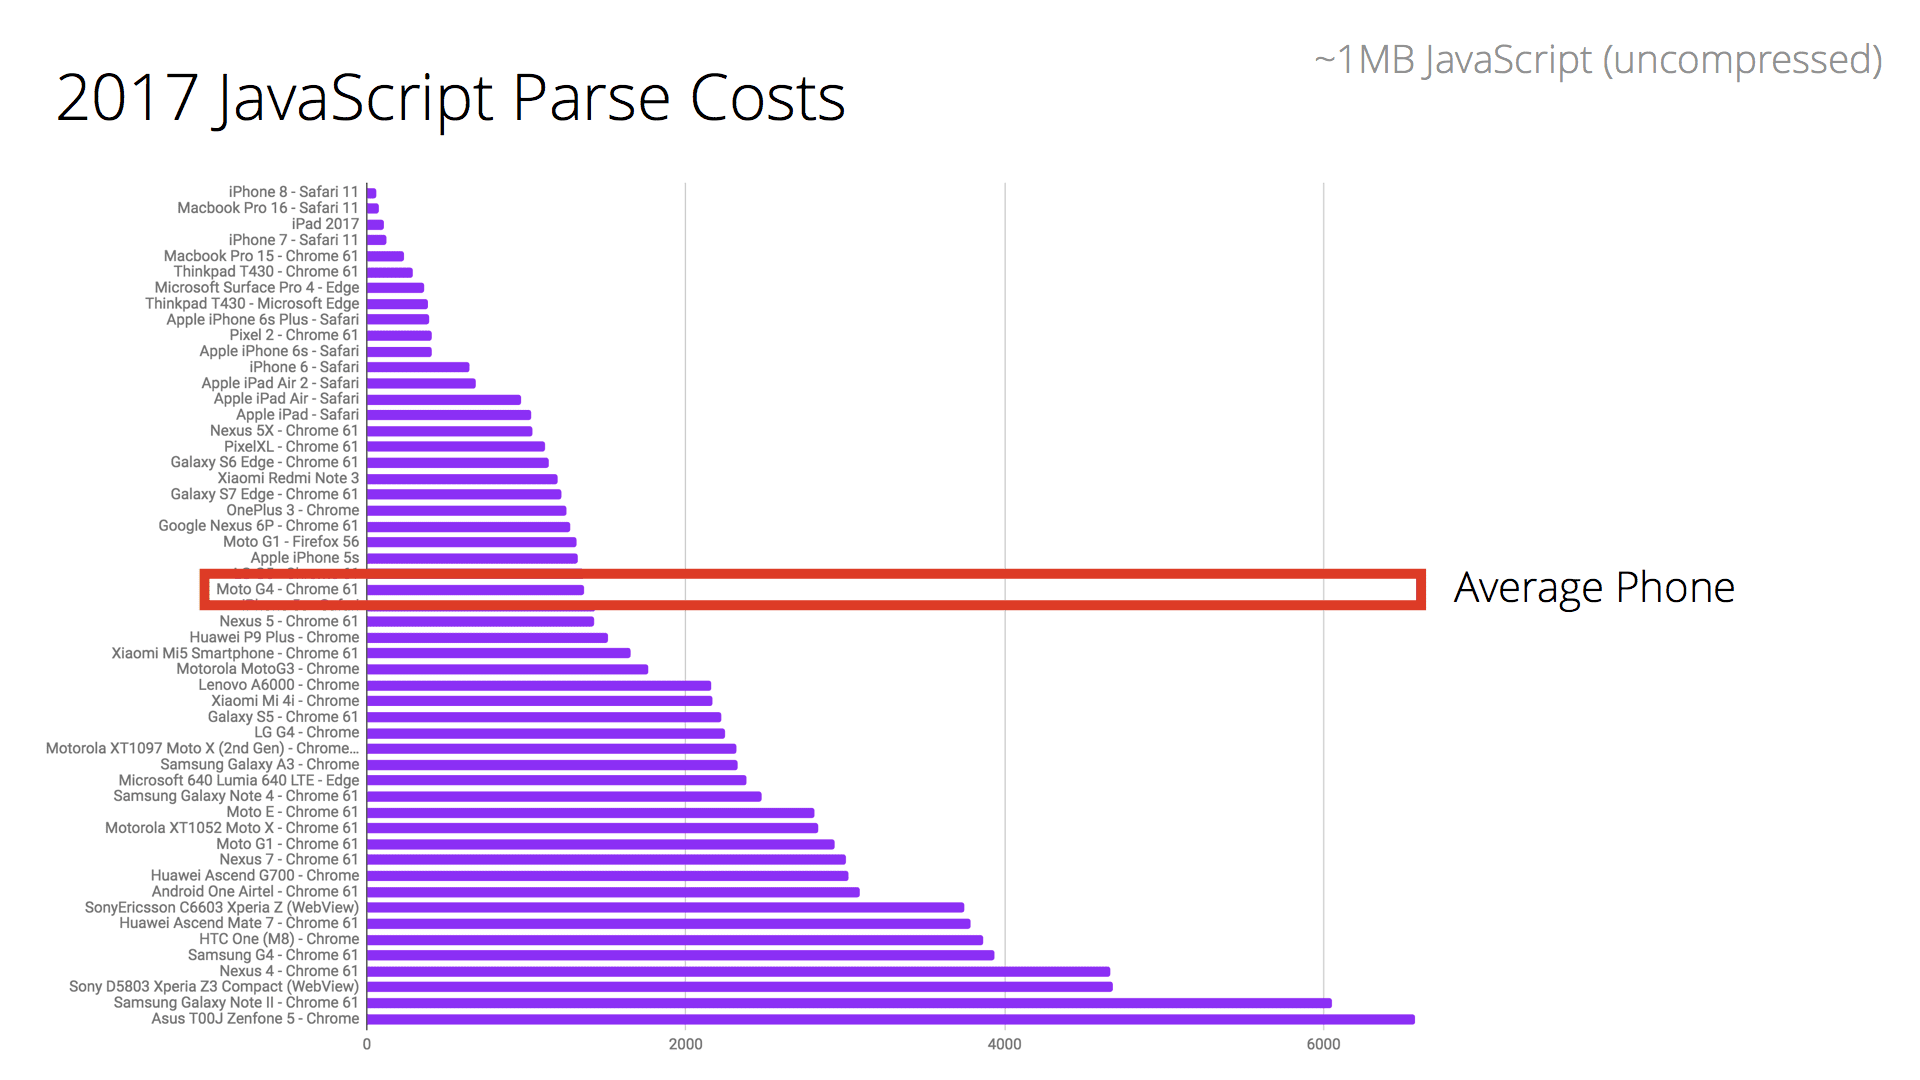
Below we can see the cost of parsing ~1MB of decompressed (simple) JavaScript on low and high-end hardware. There is a 2–5x difference in time to parse/compile code between the fastest phones on the market and average phones.
What about a real-world site, like CNN.com?
On the high-end iPhone 8 it takes just ~4s to parse/compile CNN’s JS compared to ~13s for an average phone (Moto G4). This can significantly impact how quickly a user can fully interact with this site.
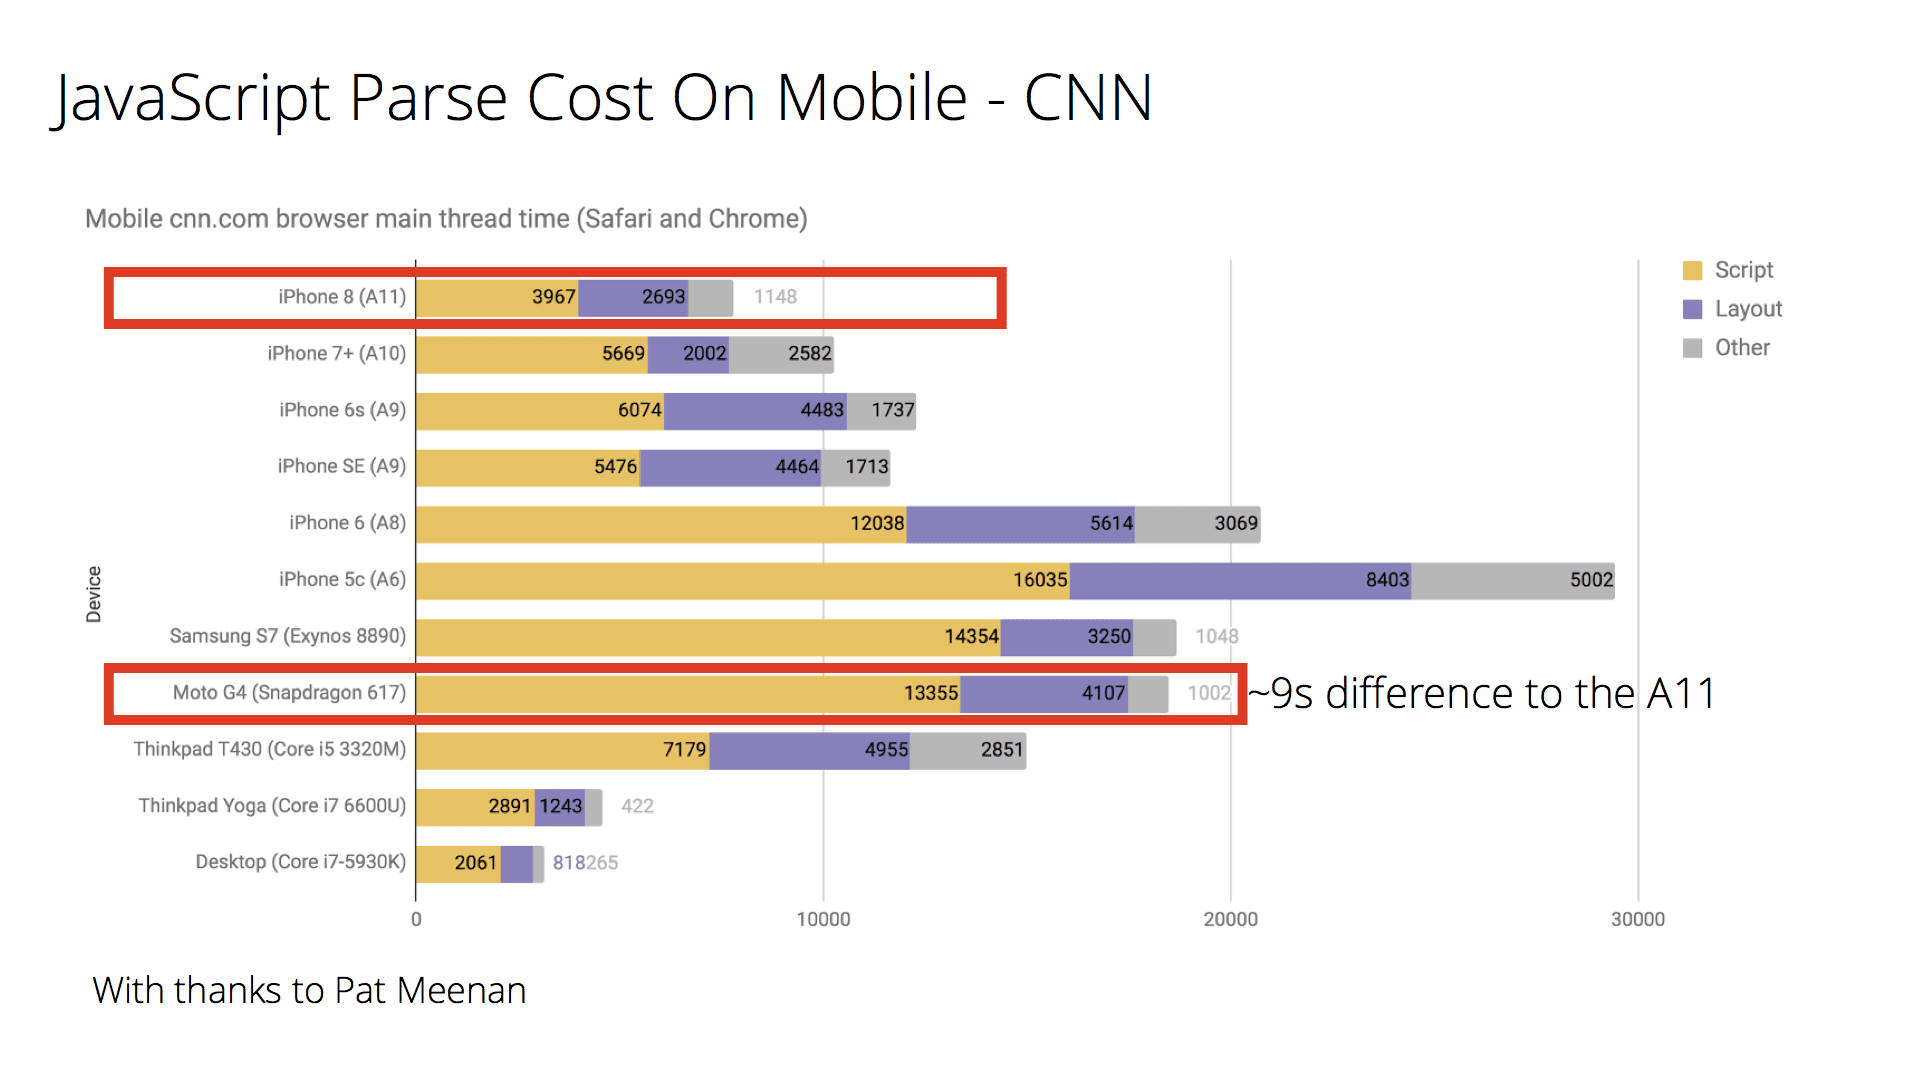
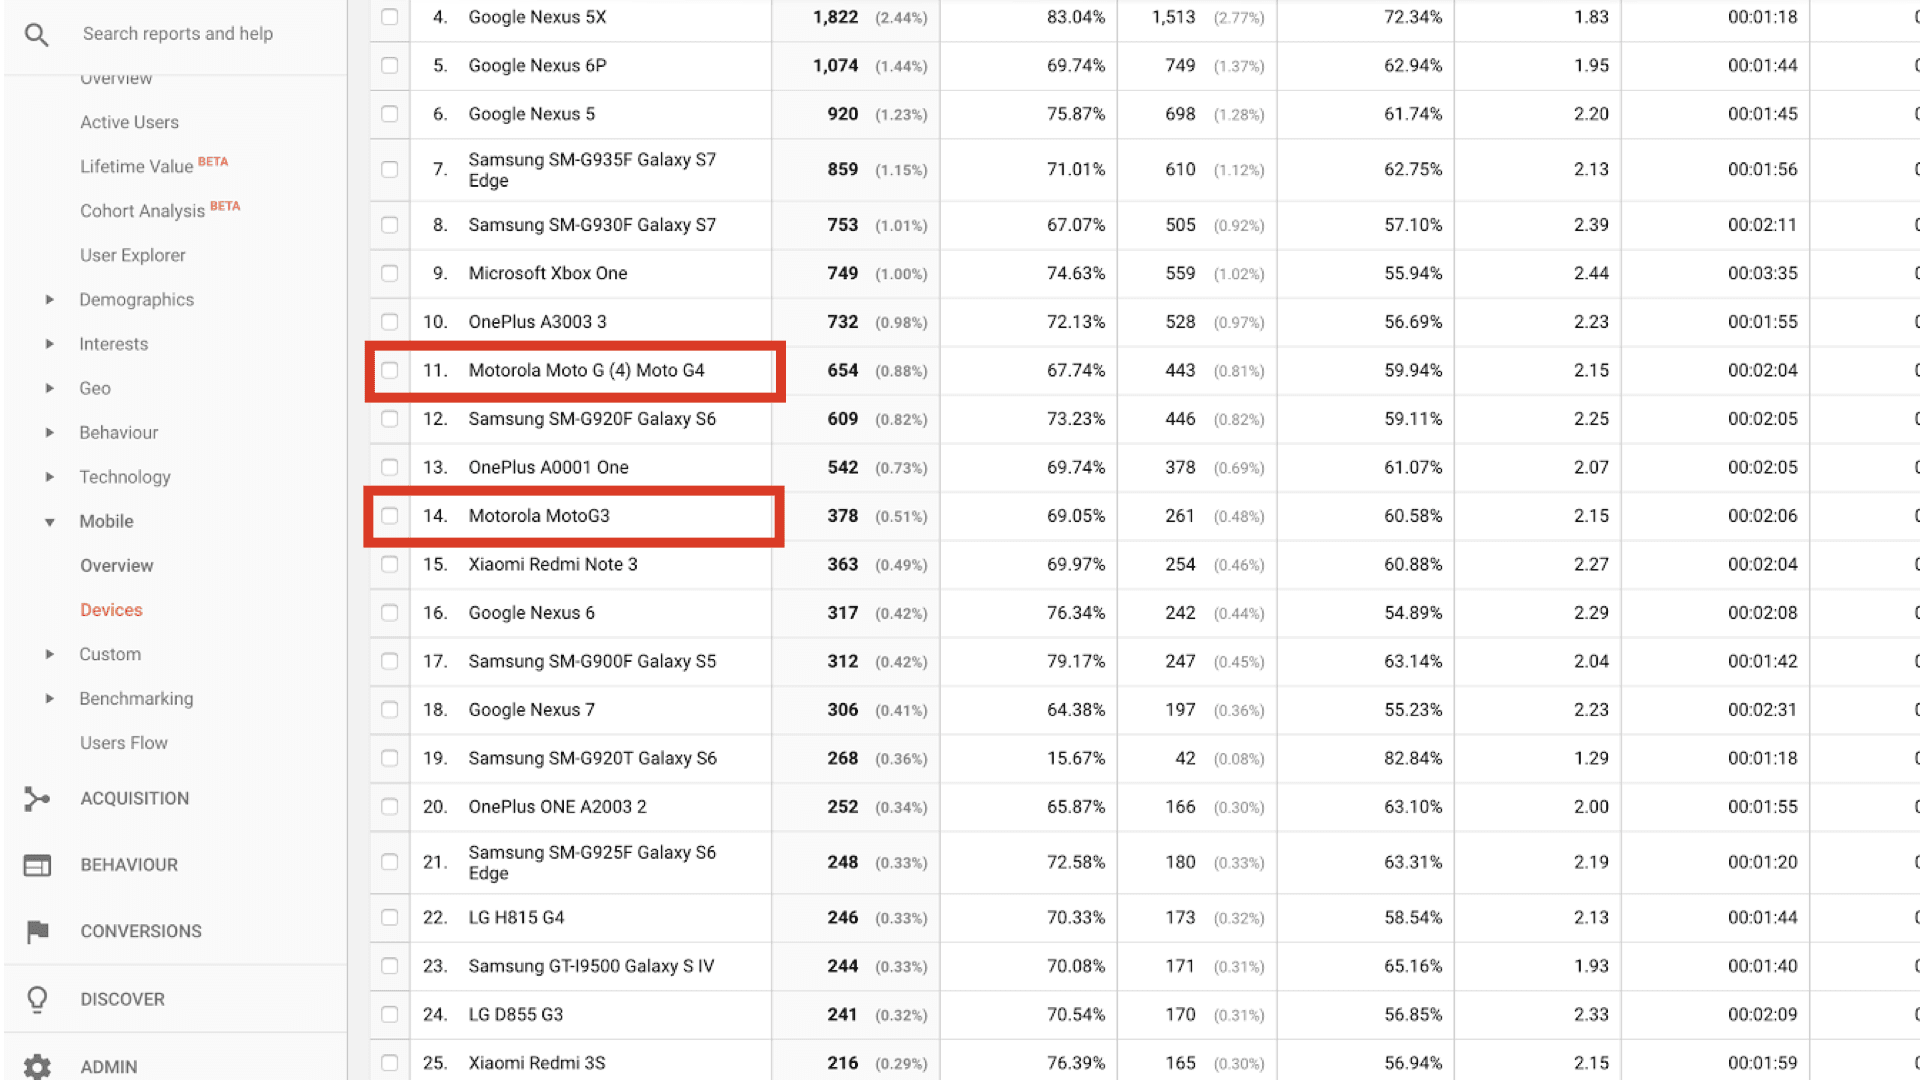
This highlights the importance of testing on average hardware (like the Moto G4) instead of just the phone that might be in your pocket. Context matters however: optimize for the device and network conditions your users have.
Are we really sending down too much JavaScript? Err, possibly :)
Using HTTP Archive (top ~500K sites) to analyze the state of JavaScript on mobile, we can see that 50% of sites take over 14 seconds to get interactive. These sites spend up to 4 seconds just parsing and compiling JS.
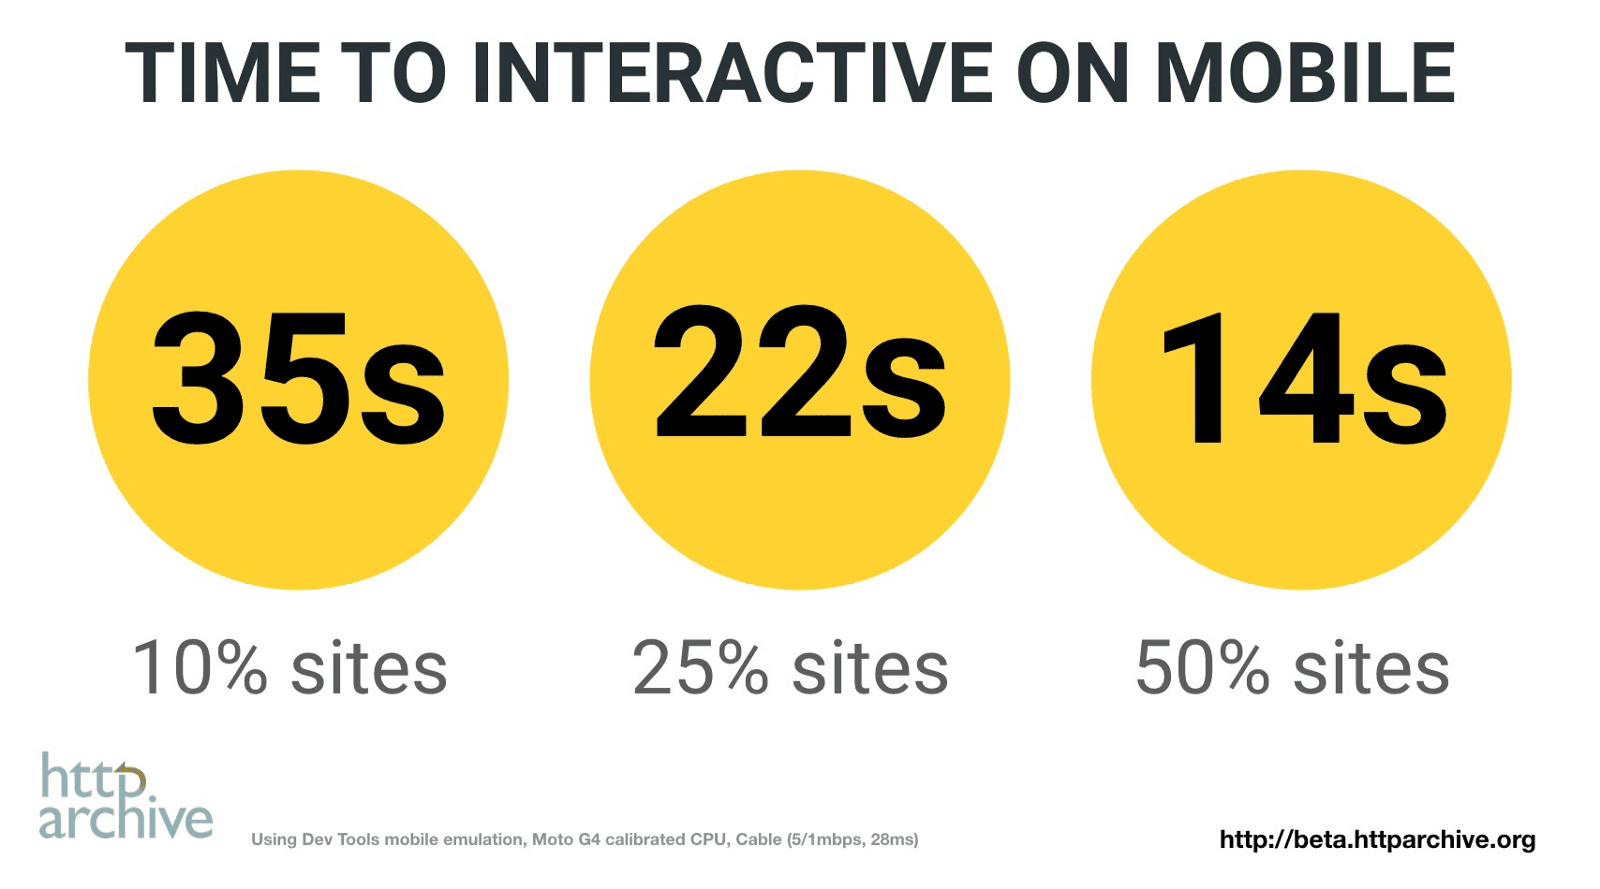
Factor in the time it takes to fetch and process JS and other resources and it’s perhaps not surprising that users can be left waiting a while before feeling pages are ready to use. We can definitely do better here.
Removing non-critical JavaScript from your pages can reduce transmission times, CPU-intensive parsing and compiling and potential memory overhead. This also helps get your pages interactive quicker.
Execution time
It’s not just parse and compile that can have a cost. JavaScript execution (running code once parsed/compiled) is one of the operations that has to happen on the main thread. Long execution times can also push out how soon a user can interact with your site.
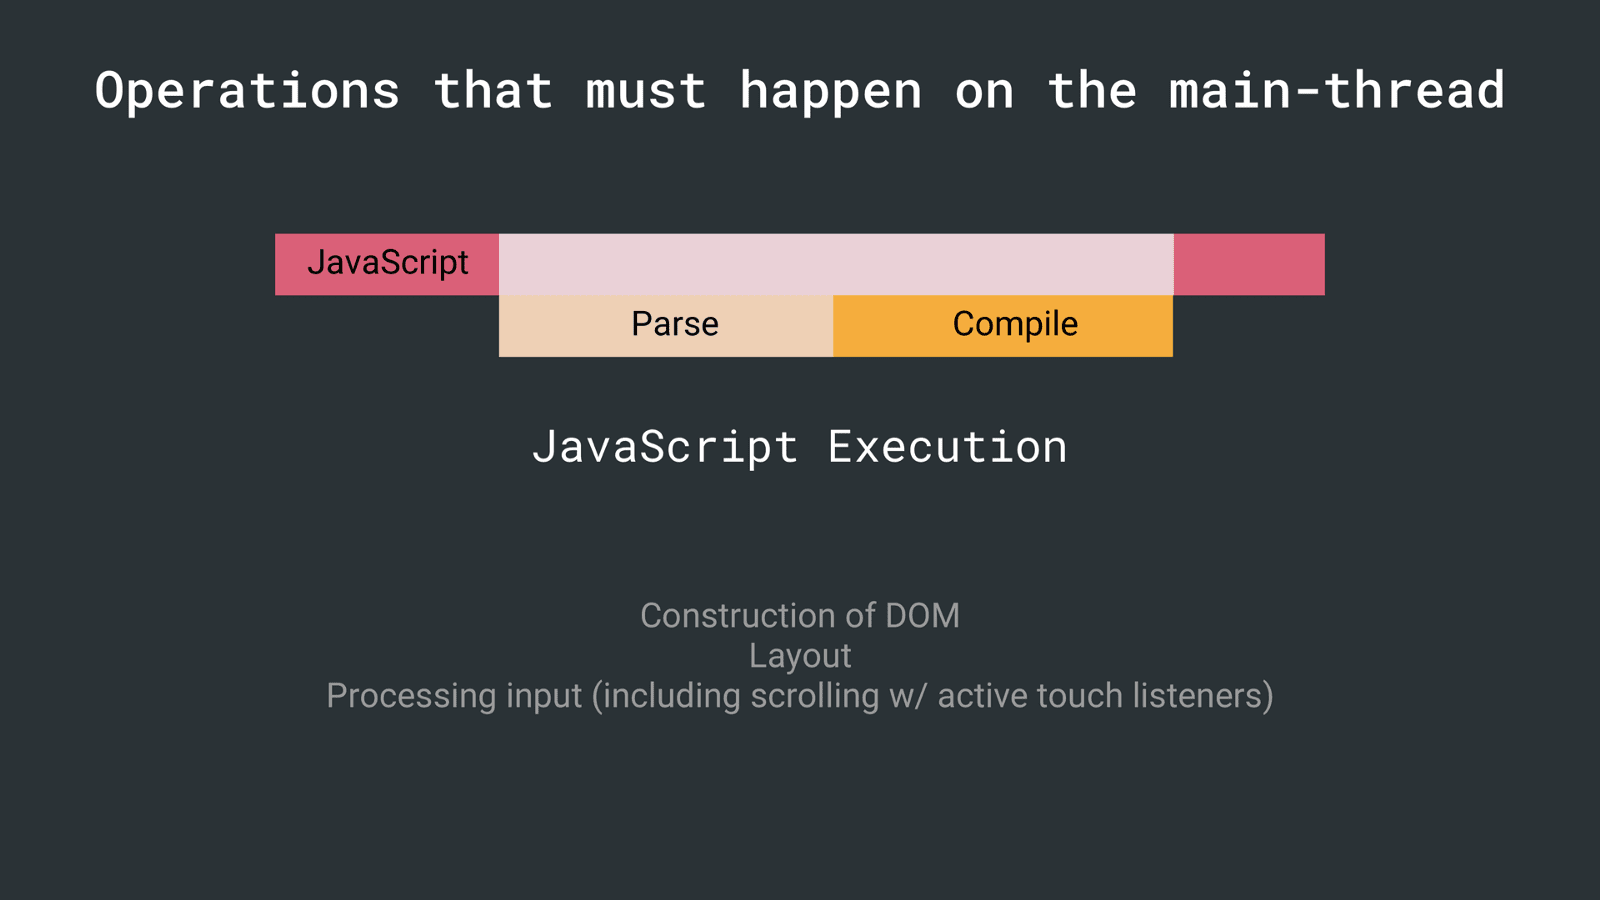
If script executes for more than 50ms, time-to-interactive is delayed by the entire amount of time it takes to download, compile, and execute the JS — Alex Russell
To address this, JavaScript benefits from being in small chunks to avoid locking up the main thread. Explore if you can reduce how much work is being done during execution.
Other costs
JavaScript can impact page performance in other ways:
- Memory. Pages can appear to jank or pause frequently due to GC (garbage collection). When a browser reclaims memory, JS execution is paused so a browser frequently collecting garbage can pause execution more frequently than we may like. Avoid memory leaks and frequent gc pauses to keep pages jank free.
- During runtime, long-running JavaScript can block the main-thread causing
pages that are unresponsive. Chunking up work into smaller pieces (using
requestAnimationFrame()orrequestIdleCallback()for scheduling) can minimize responsiveness issues which can help improve Interaction to Next Paint (INP).
Patterns for reducing JavaScript delivery cost
When you’re trying to keep parse/compile and network transmit times for JavaScript slow, there are patterns that can help like route-based chunking or PRPL.
PRPL
PRPL (Push, Render, Pre-cache, Lazy-load) is a pattern that optimizes for interactivity through aggressive code-splitting and caching:
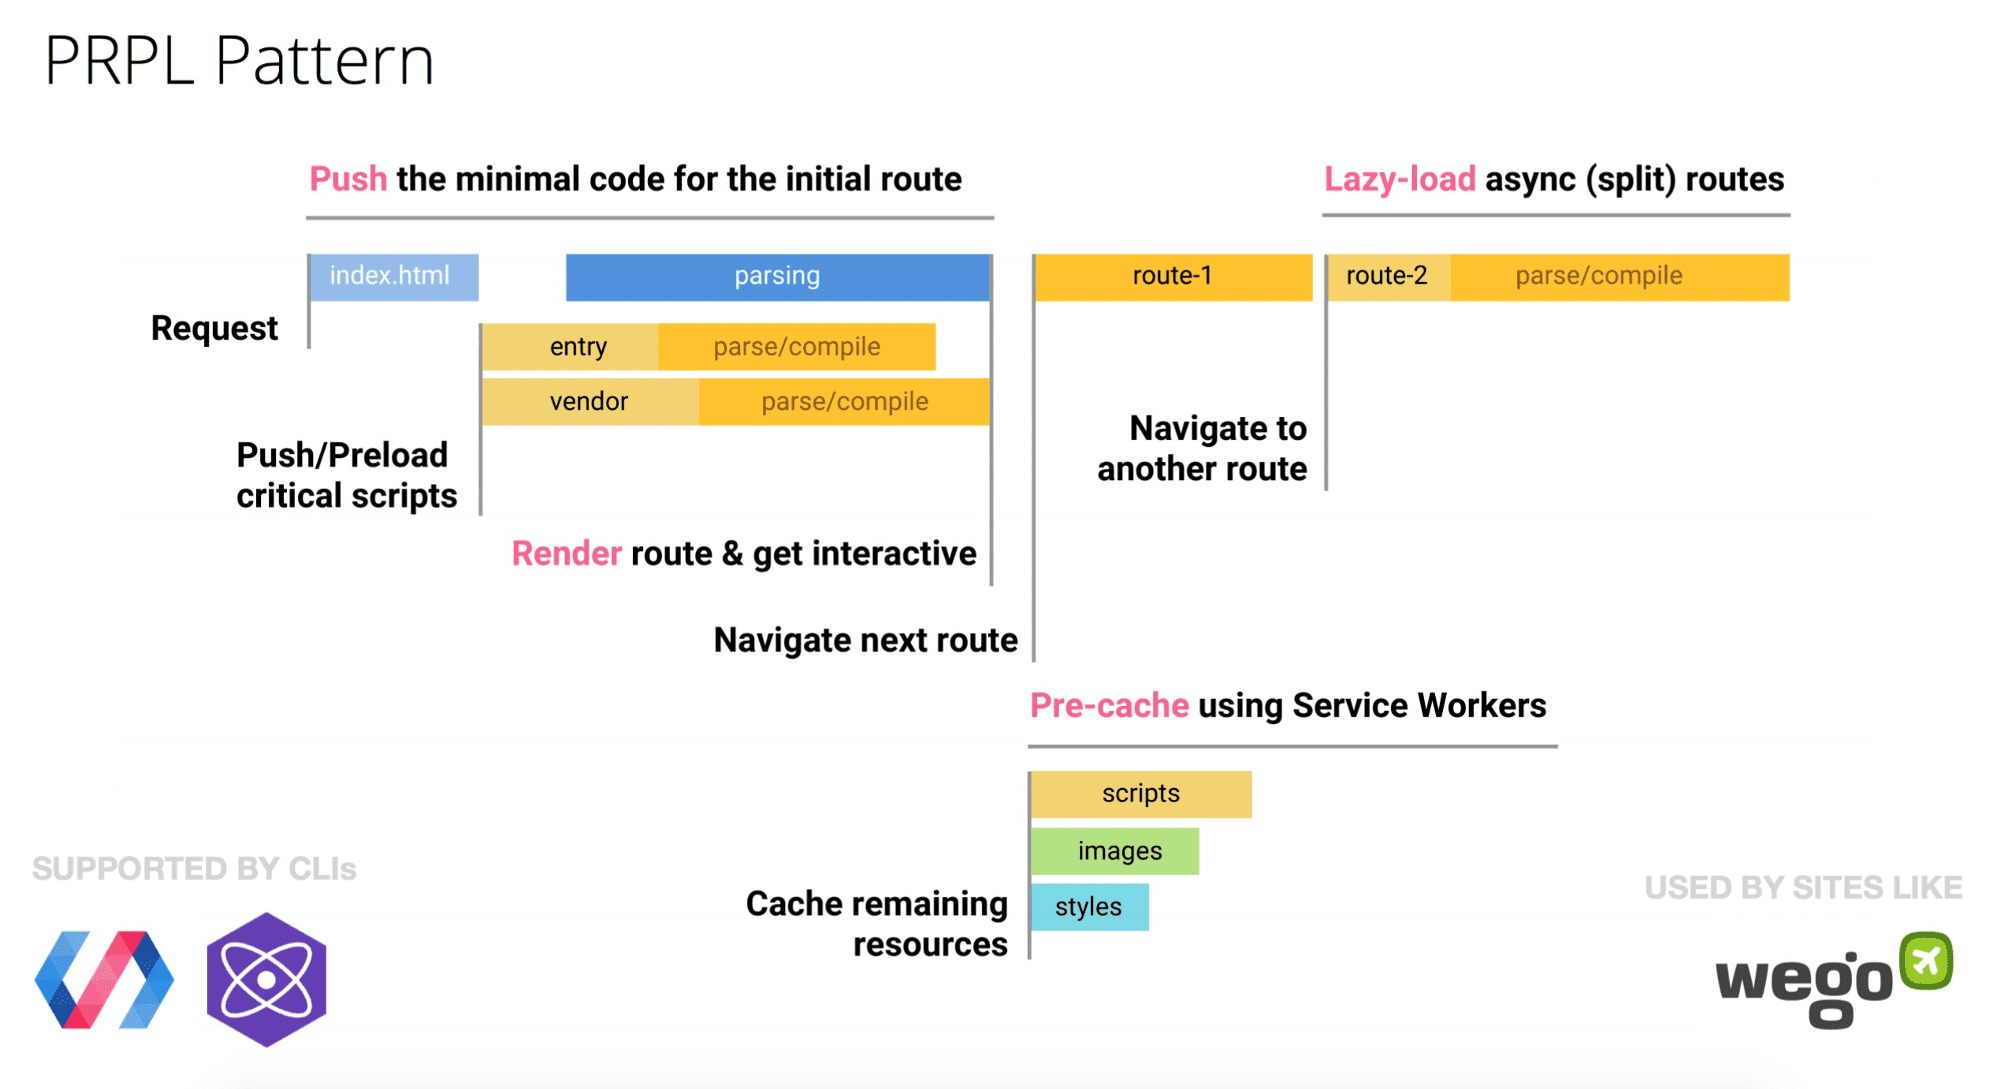
Let’s visualize the impact it can have.
We analyze the load-time of popular mobile sites and Progressive Web Apps using V8’s Runtime Call Stats. As we can see, parse time (shown in orange) is a significant portion of where many of these sites spend their time:
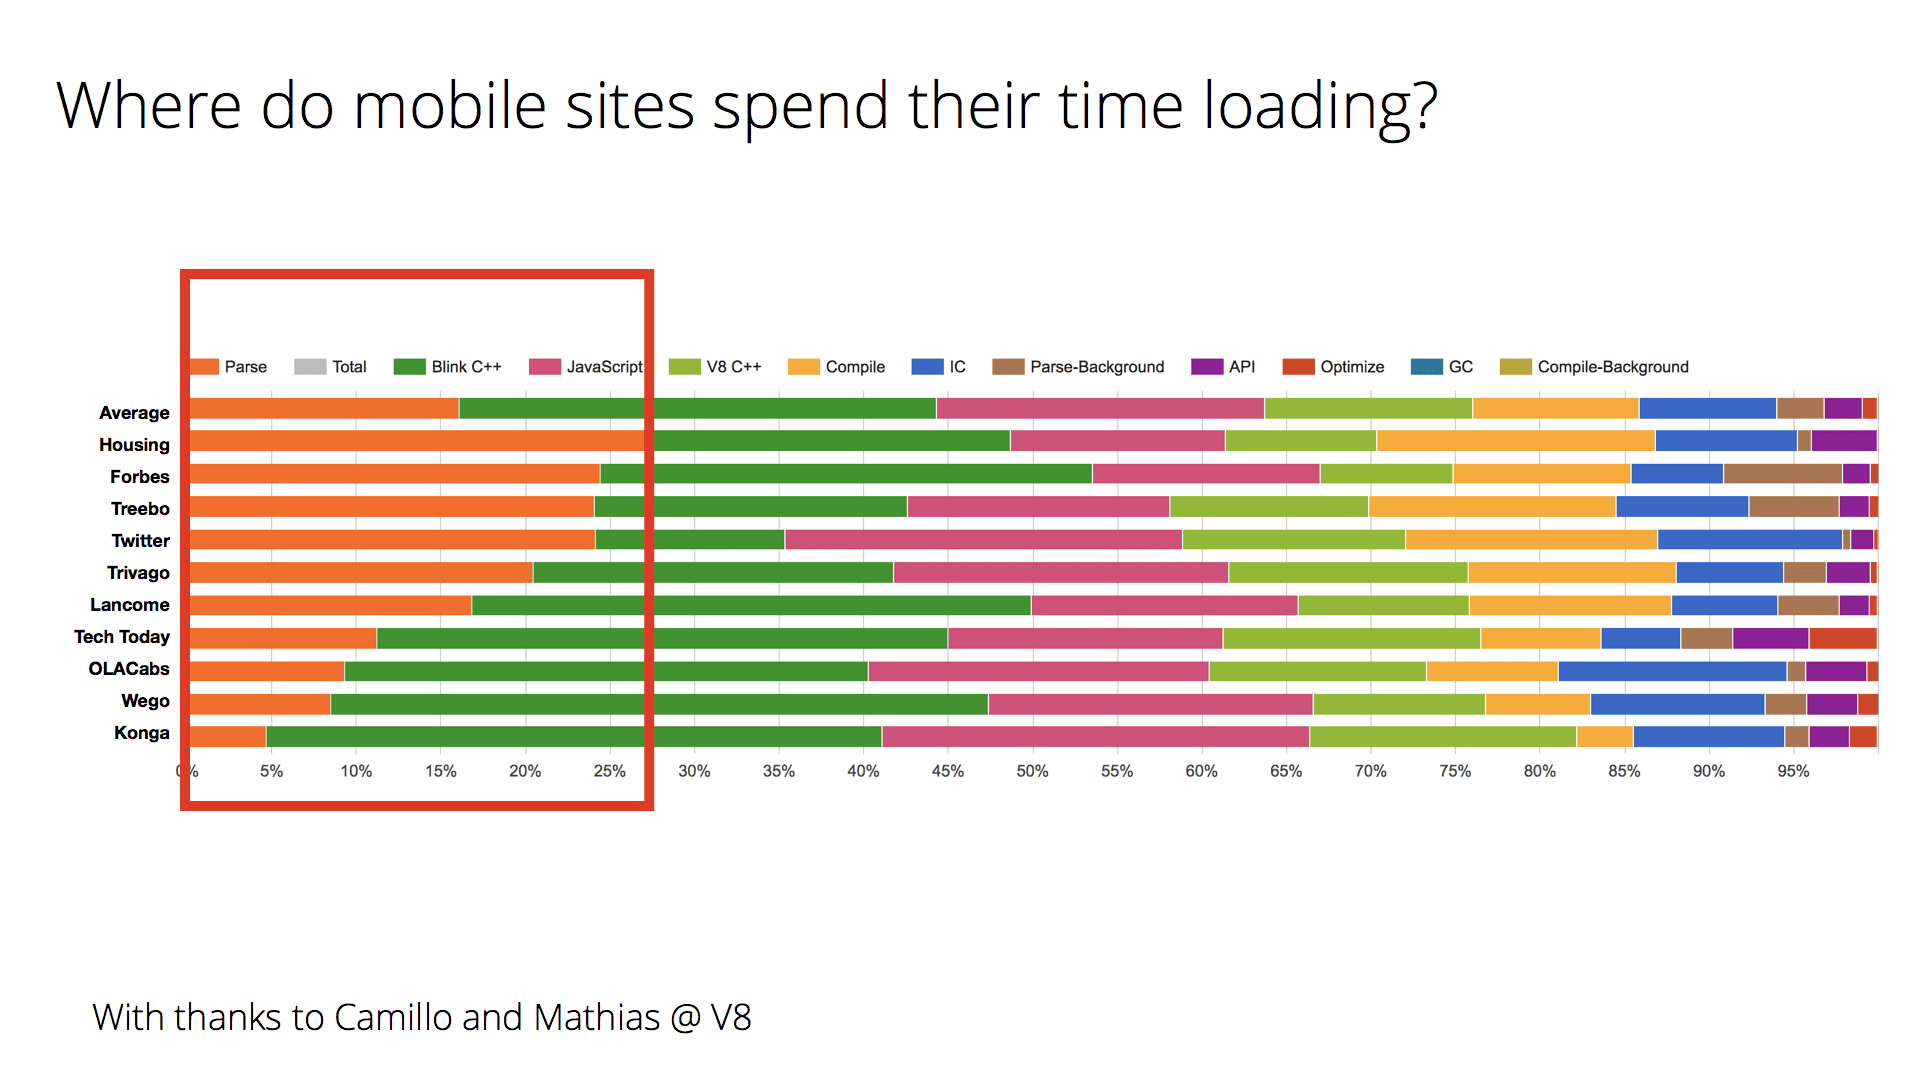
Wego, a site that uses PRPL, manages to maintain a low parse time for their routes, getting interactive very quickly. Many of the other sites above adopted code-splitting and performance budgets to try lowering their JS costs.
Progressive Bootstrapping
Many sites optimize content visibility at the expensive of interactivity. To get a fast first paint when you do have large JavaScript bundles, developers sometimes employ server-side rendering; then "upgrade" it to attach event handlers when the JavaScript finally gets fetched.
Be careful — this has its own costs. You 1) generally send down a larger HTML response which can push our interactivity, 2) can leave the user in an uncanny valley where half the experience can’t actually be interactive until JavaScript finishes processing.
Progressive Bootstrapping may be a better approach. Send down a minimally functional page (composed of just the HTML/JS/CSS needed for the current route). As more resources arrive, the app can lazy-load and unlock more features.
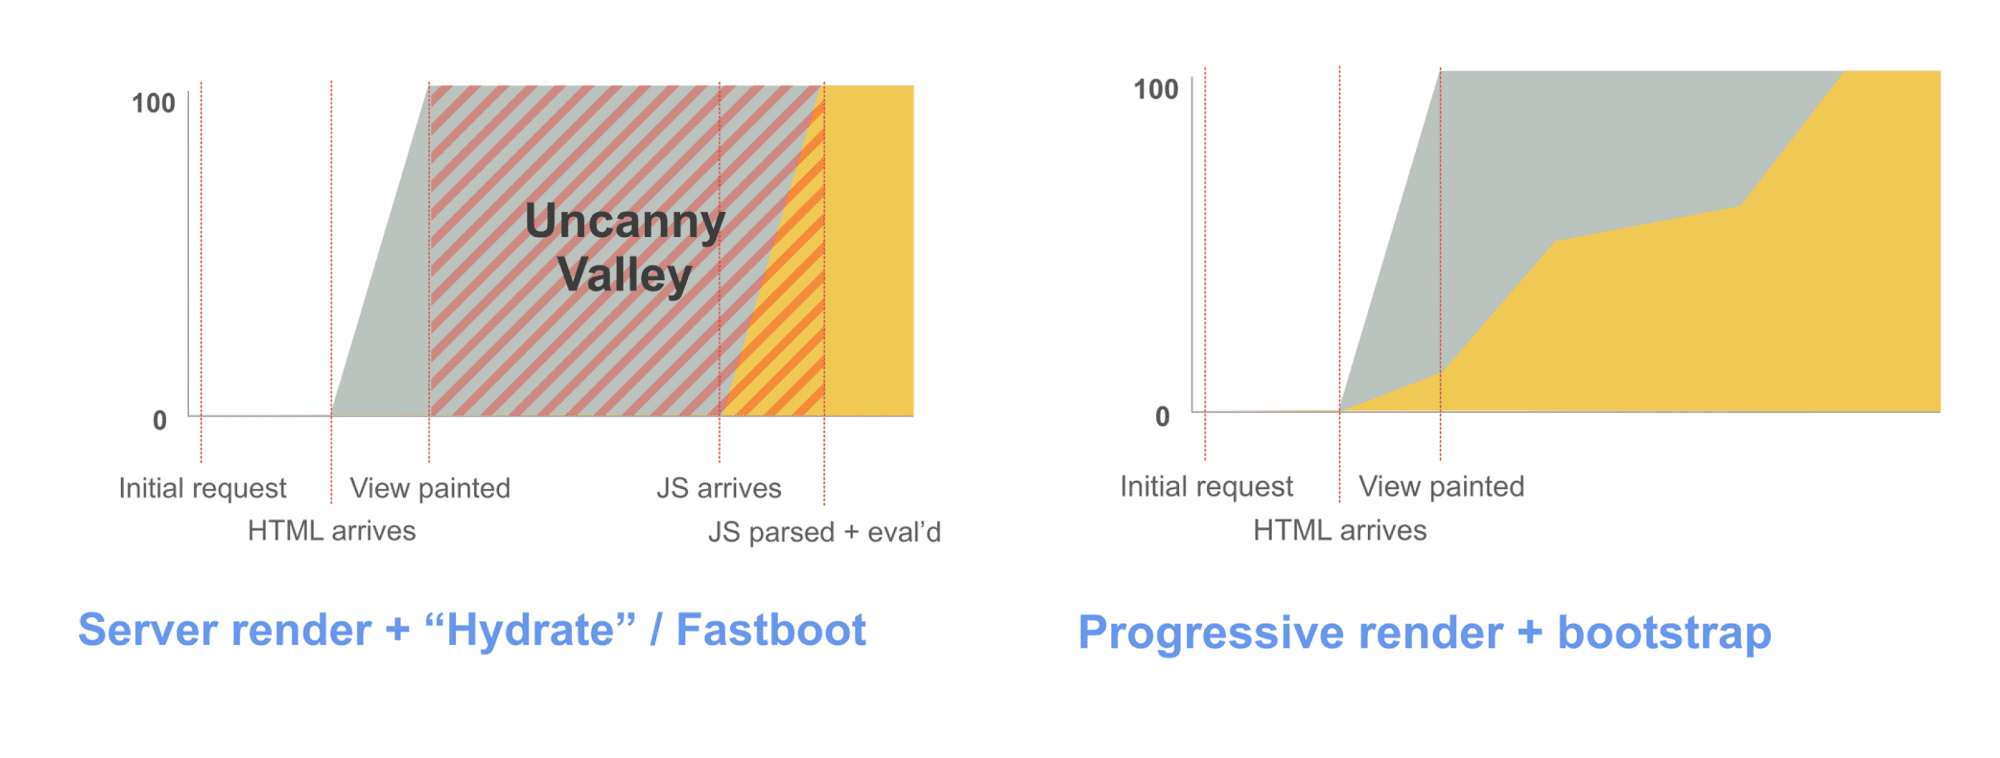
Loading code proportionate to what’s in view is the holy grail. PRPL and Progressive Bootstrapping are patterns that can help accomplish this.
Conclusions
Transmission size is critical for low end networks. Parse time is important for CPU bound devices. Keeping these low matters.
Teams have found success adopting strict performance budgets for keeping their JavaScript transmission and parse/compile times low. See Alex Russell’s "Can You Afford It?: Real-world Web Performance Budgets" for guidance on budgets for mobile.
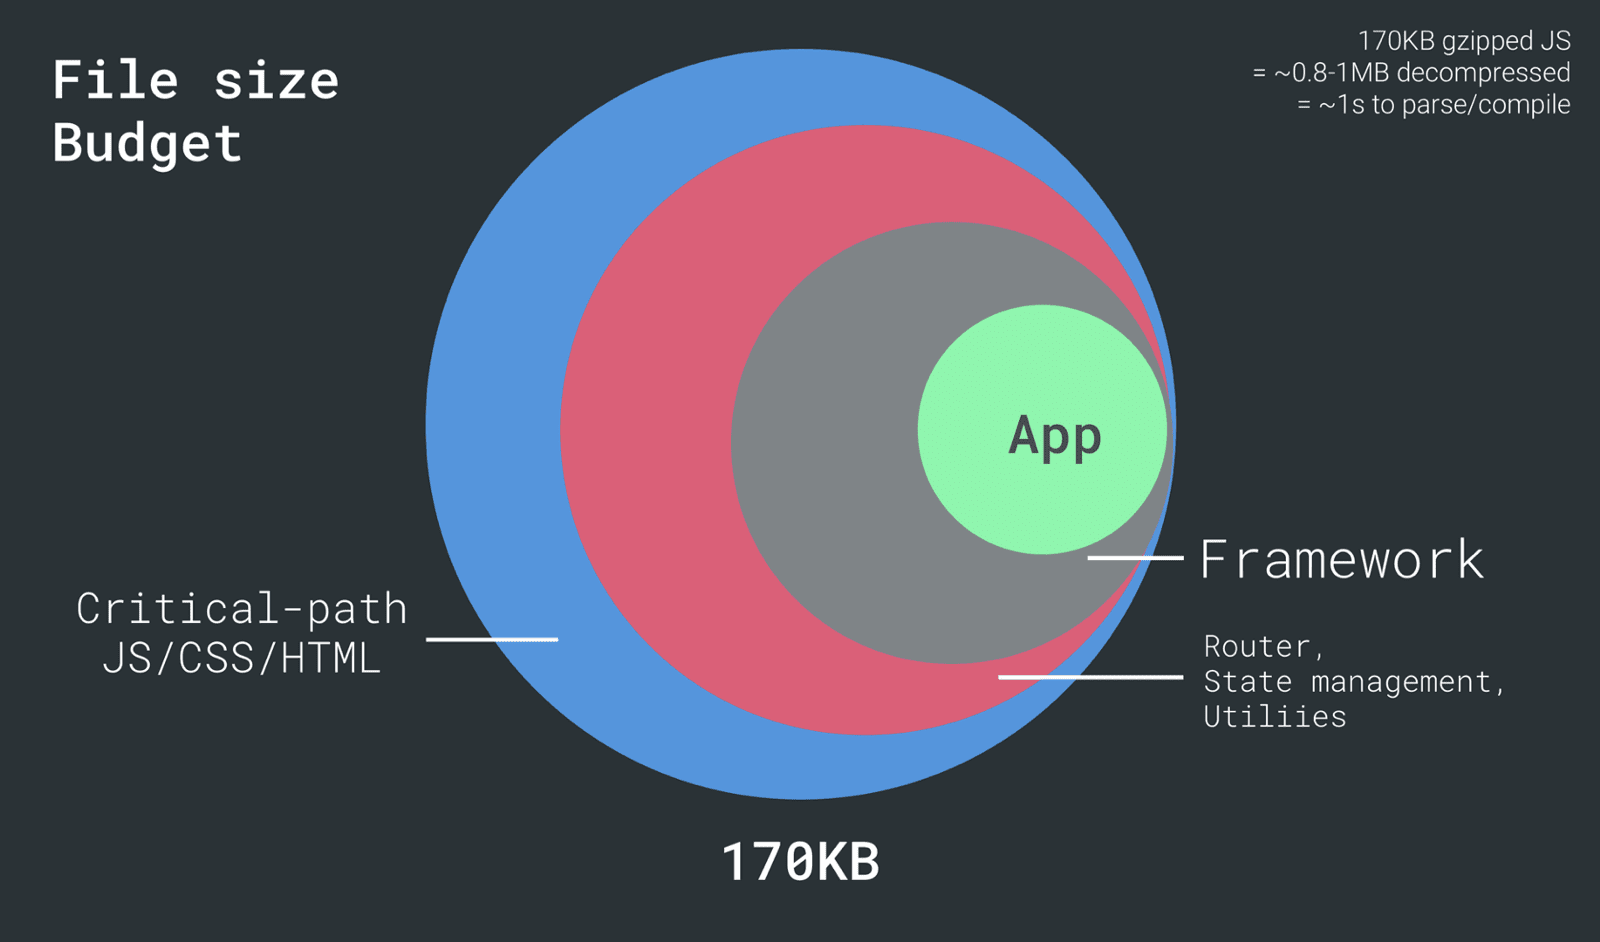
If you’re building a site that targets mobile devices, do your best to develop on representative hardware, keep your JavaScript parse/compile times low and adopt a Performance Budget for ensuring your team are able to keep an eye on their JavaScript costs.
Learn More
- Chrome Dev Summit 2017 - Modern Loading Best Practices
- JavaScript Start-up Performance
- Solving the web performance crisis — Nolan Lawson
- Can you afford it? Real-world performance budgets — Alex Russell
- Evaluating web frameworks and libraries — Kristofer Baxter
- Cloudflare’s Results of experimenting with Brotli for compression (note dynamic Brotli at a higher quality can delay initial page render so evaluate carefully. You probably want to statically compress instead.)
- Performance Futures — Sam Saccone

