Learn how to profile the performance of Web Audio apps in Chrome using about://tracing and Audion (a WebAudio extension in Chrome DevTools).
You reached this document probably because you're developing an app that uses the Web Audio API and experienced unexpected glitches, such as popping noises from the output, or you're hearing something unexpected. You might already be involved in a crbug.com discussion and a Chrome engineer asked you to upload "tracing data" or look into the graph visualization.
Learn how to obtain the relevant information, so we can understand the problem and eventually fix the underlying issue.
Web Audio profiling tools
There are two tools that will help you when profiling Web Audio,
about://tracing and the WebAudio extension in Chrome DevTools.
When do you use about://tracing?
When mysterious "glitches" happen. Profiling the app with the tracing tools gives you insights on:
- Time slices spent by specific function calls on different threads
- Audio callback timing in the timeline view
It usually shows missed audio callback deadlines or big garbage collection that might cause unexpected audio glitches. This information is useful for understanding an underlying problem, so Chromium engineers will often ask it especially when the local reproduction is not feasible. Review our general instructions for tracing.
When do you use Web Audio DevTools extension?
When you want to visualize the audio graph and monitor how the audio renderer
performs in real time. The audio graph, a network of AudioNode objects to
generate and synthesize an audio stream, often gets complex but the graph
topology is opaque by design. (The Web Audio API doesn't have features for
node/graph introspection.) Some changes happen in your graph and now you hear
silence. Then it's time for debugging by listening. It's never easy, and it
becomes more difficult when you have a bigger audio graph. The Web Audio
DevTools extension can help you by visualizing the graph.
With this extension, you can monitor a running estimate of render capacity, which indicates how the web audio renderer performs over a given render budget (such as, approximately 2.67ms @ 48KHz). If the capacity goes near 100 percent, that means your app is likely to produce glitches because the renderer is failing to finish the work in the given budget.
Use about://tracing
For best results, close all other tabs and windows, and disable extensions. Alternatively you can either launch a new instance of Chrome or use other builds from different release channels (e.g. Beta or Canary). Once you have the browser ready:
- Open your application (web page) on a tab.
- Open another tab and go to
about://tracing. - Press the Record button and select Manually select settings.
- Press the None buttons on both the Record Categories and Disabled by Default Categories sections.
- In the Record Categories section, select the following:
audioblink_gcmediav8.execute(if you're interested inAudioWorkletJS code performance)webaudio
- In the Disabled by Default Categories section, select the following:
audio-worklet(if you're interested in where theAudioWorkletthread starts)webaudio.audionode(if you need the detailed trace for eachAudioNode)
- Press the Record button at the bottom.
- Go back to your application tab and redo the steps that triggered the issue.
- When you have enough trace data, go back to the tracing tab and press Stop.
The tracing tab will visualize the result.
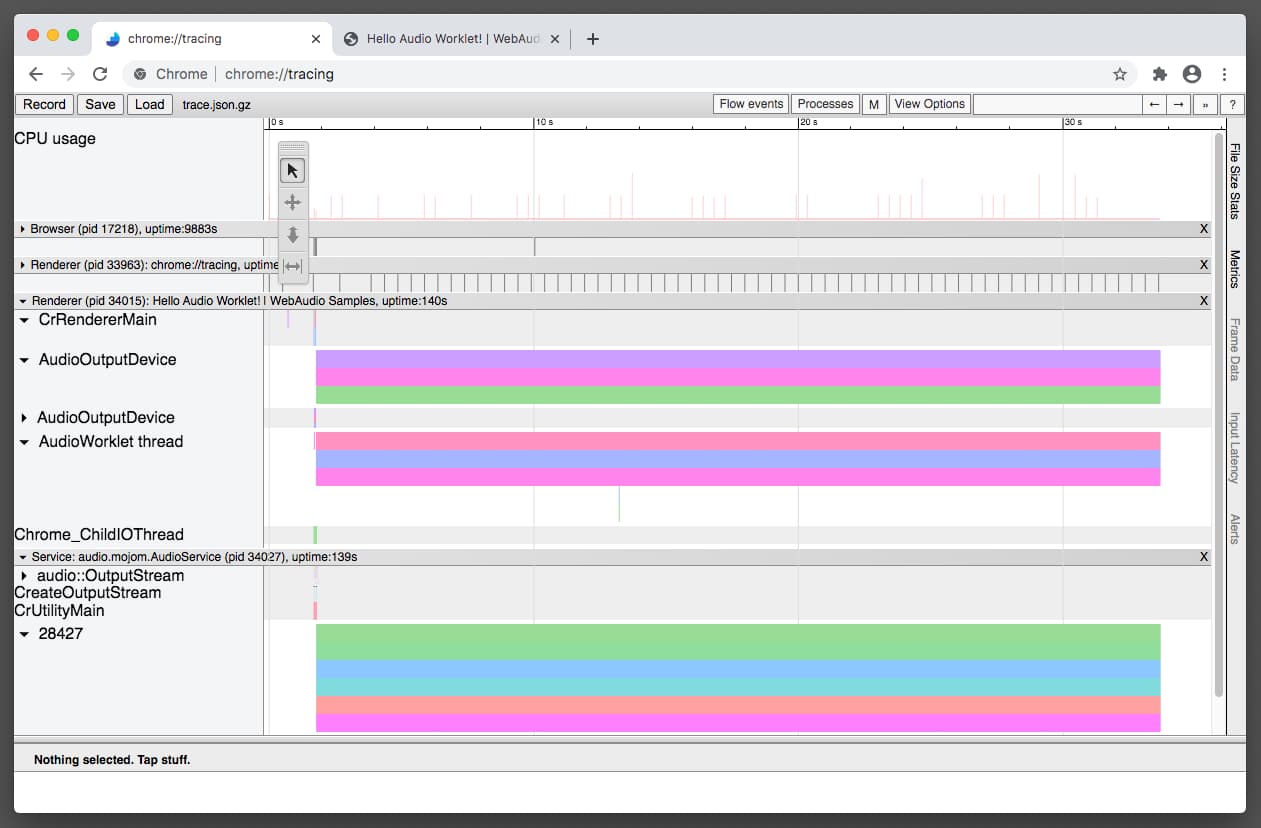
Press Save to save the tracing data.
How to analyze tracing data
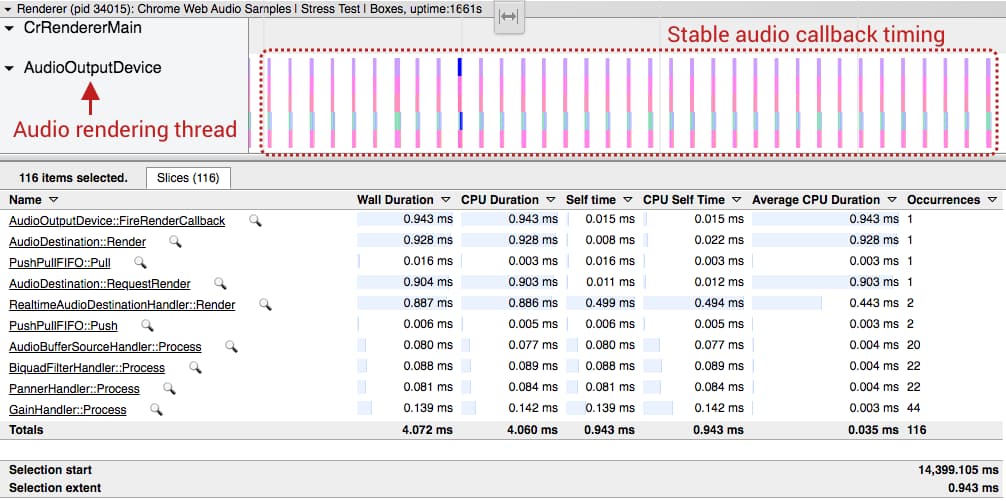
The tracing data visualizes how Chrome's web audio engine renders the audio. The renderer has two different render modes: Operating system mode and Worklet mode. Each mode uses a different threading model, so the tracing results also differ.
Operating system mode
In operating system mode, the AudioOutputDevice thread runs
all the web audio code. The AudioOutputDevice is a real-time priority thread
originating from the browser's Audio Service that is driven by the audio
hardware clock. If you see irregularity from the trace data in this lane,
it means the callback timing from the device may be jittery. The combination
of Linux and Pulse Audio is known to have this problem.
See the following Chromium issues for more details: #825823, #864463.
Worklet mode
In Worklet Mode, which is characterized by one thread jump from
AudioOutputDevice to the AudioWorklet thread, you
should see well-aligned traces in two thread lanes. When the
worklet is activated all the web audio operations are rendered by the
AudioWorklet thread. This thread is not a real-time priority.
The common irregularity here is a big block caused by the garbage collection or missed render deadlines. Both cases lead to glitches in the audio stream.
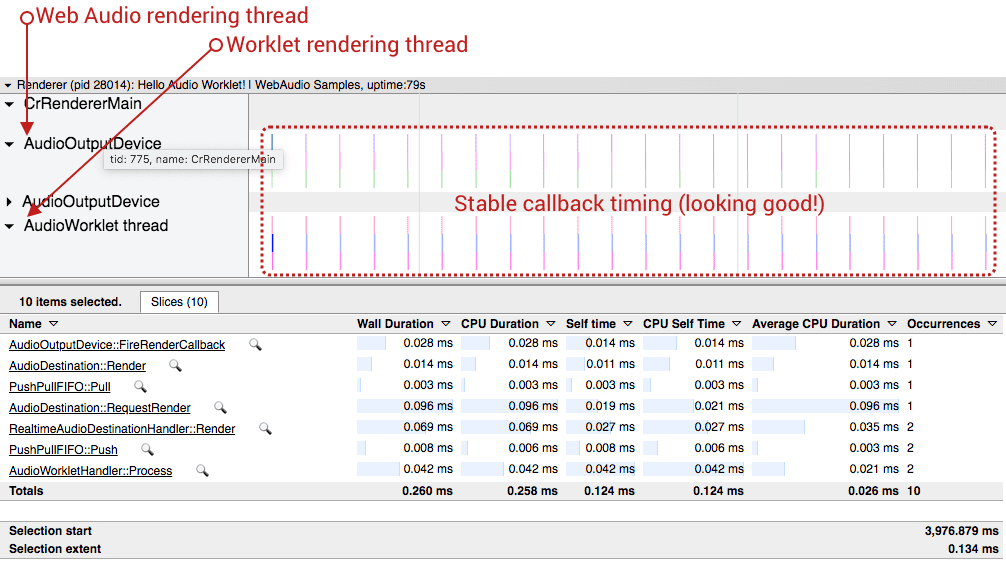
In both cases, the ideal tracing data is characterized by well-aligned audio device callback invocations and render tasks being completed well within the given render budget. The two screenshots are great examples of the ideal tracing data.
Learning from real-world examples
Example 1: Render tasks going beyond render budget
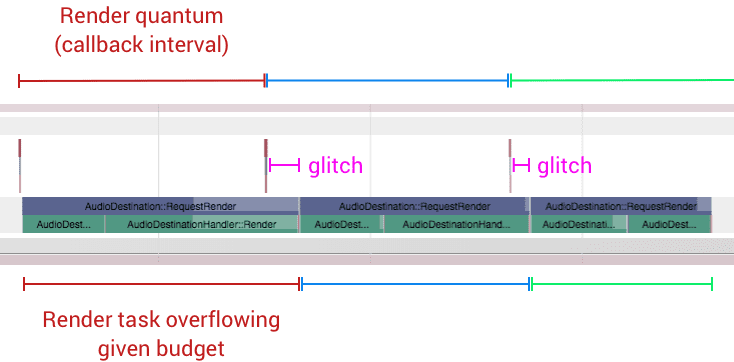
The screenshot below (Chromium issue #796330) is a
typical example of when code in AudioWorkletProcessor takes too long and
goes beyond a given render budget. The callback timing is well behaved but
the audio processing function call of the Web Audio API failed to complete the
work before the next device callback.
Your options:
- Reduce the workload of the audio graph by using fewer
AudioNodeinstances. - Reduce the workload of your code in the
AudioWorkletProcessor. - Increase the base latency of
AudioContext.
Example 2: Significant garbage collection on the worklet thread
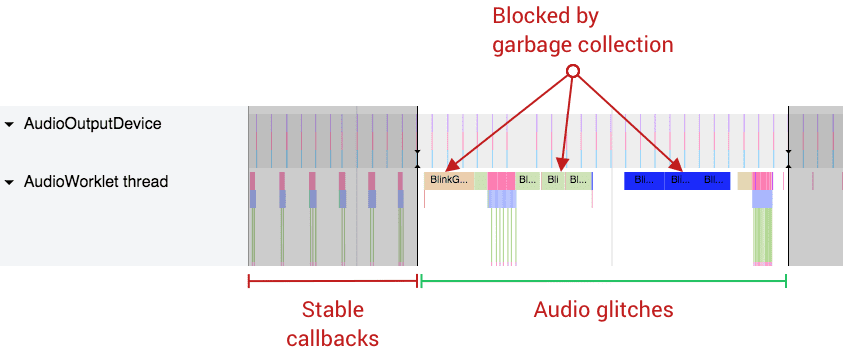
Unlike on the operating system audio rendering thread, garbage collection is managed on the worklet thread. That means if your code does memory allocation/deallocation (e.g. new arrays) it eventually triggers a garbage collection which synchronously blocks the thread. If the workload of web audio operations and garbage collection is bigger than a given render budget, it results in glitches in the audio stream. The following screenshot is an extreme example of this case.
Your options:
- Allocate the memory up front and reuse it whenever possible.
- Use different design patterns based on
SharedArrayBuffer. Although this is not a perfect solution, several web audio apps use a similar pattern withSharedArrayBufferto run the intensive audio code. Examples:
Example 3: Jittery audio device callback from AudioOutputDevice
The precise timing of audio callback is the most important thing for web audio. This should be the most precise clock in your system. If the operating system or its audio subsystem cannot guarantee a solid callback timing, all the subsequent operations will be affected. The following image is an example of jittery audio callback. Compared to the previous two images, the interval between each callback varies significantly.

Your options:
- Increase the system audio callback buffer size by adjusting the
latencyHintoption. - If you find a problem, file an issue on crbug.com with the tracing data.
Use the Web Audio DevTools extension
You can also use the DevTools extension specifically designed for the Web Audio API. Unlike the tracing tool, this provides real time inspection of graphs and performance metrics.
This extension needs to be installed from the Chrome Web Store.
After the installation, you access the panel by opening Chrome DevTools and clicking “Web Audio” on the top menu.

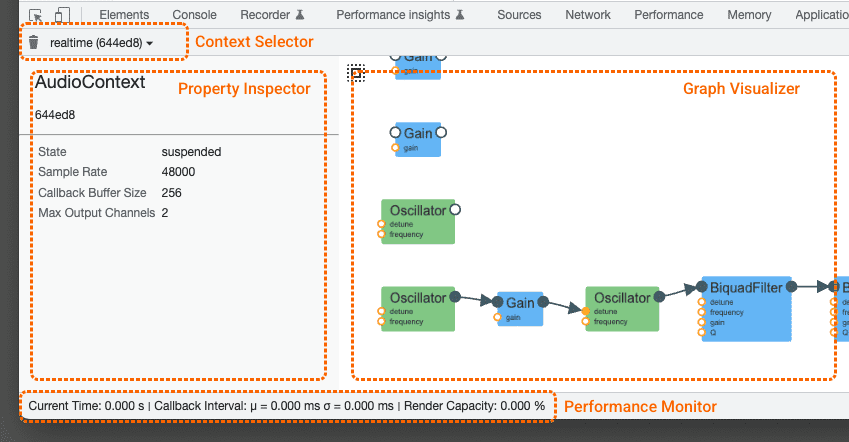
The Web Audio panel has four components: context selector, property inspector, graph visualizer, and performance monitor.
Context Selector
Since a page can have multiple BaseAudioContext objects, this drop-down menu allows you
choosing the context you want to inspect. You can also manually trigger garbage
collection by clicking the trash can icon on the left.
Property Inspector
The side panel shows various properties of a user-selected context or
AudioNode. Inspecting dynamic values in AudioParam is not supported.
Graph Visualizer
This view renders the current graph topology of a user-selected context. This visualization changes dynamically in real time. By clicking an element in the visualization, you can inspect the detailed information on the property inspector.
Performance monitor
The status bar at the bottom is only active when the selected BaseAudioContext
is an AudioContext, which runs in real-time. This bar shows the instantaneous
audio stream quality of a selected AudioContext and is updated every second. It
provides the following information:
Callback interval (ms): Displays the weighted mean or variance of callback interval. Ideally the mean should be stable and the variance should be close to zero. If you see a large variance, it means that the system-level audio callback function has unstable timing that can lead to poor audio stream quality. (See example 3).
Render capacity (percent): When the capacity gets close to 100 percent, it means that the renderer is doing too much for a given render budget, so you should consider doing less (e.g. using fewer
AudioNodesobjects in the graph).
You can manually trigger a garbage collector by clicking the trash can icon.
Legacy WebAudio DevTools panel
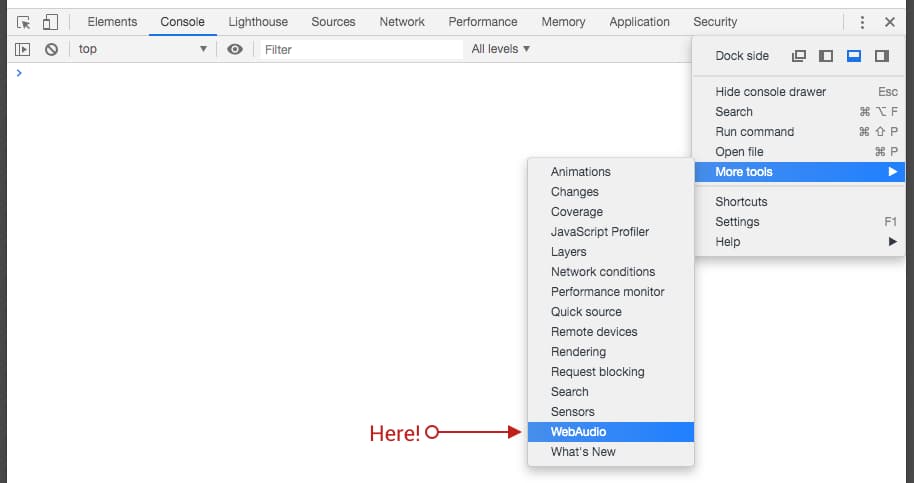
The extension is now a recommended method by the Chrome Web Audio team, but the legacy WebAudio DevTools panel is also available. You can access this panel by clicking the "three dots" menu in the top right corner of DevTools, then going to More tools, then WebAudio.
Conclusion
Debugging audio is hard. Debugging audio in the browser is even harder. However, these tools can ease the pain by providing you with useful insights on how the web audio code performs. In some cases, however, you may find problems in Chrome or the extension. File a bug on crbug.com or on the extension issue tracker.
