


Published: October 14, 2025
Interaction to Next Paint (INP) is a critical Core Web Vital metric for measuring responsiveness. At Fotocasa, Google Search Console highlighted a significant number of pages that shifted to "Need improvement" and "Poor" for when INP replaced First Input Delay (FID) in 2024. This case study outlines the tools and strategies employed to diagnose and resolve these issues, ultimately improving INP by a substantial margin.
Where the Fotocasa team started
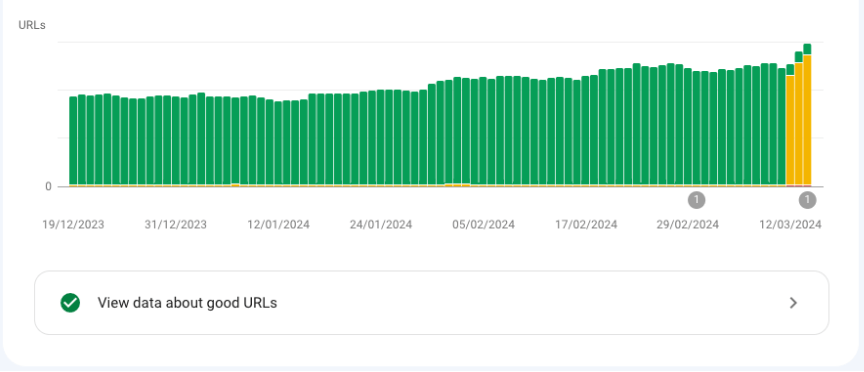
Before the shift from FID to INP, almost every page on both desktop and mobile was within the "Good" threshold, meaning all Core Web Vitals at that time (LCP, CLS, and FID) were performing well. However, after the shift to INP, nearly all pages shifted to "Need improvement" and some even to "Poor", as INP values consistently exceeded 200 milliseconds for most user interactions.
This change made the Fotocasa team realize they were overlooking a crucial aspect of user experience. While FID only measured the delay of the very first interaction, INP evaluates the responsiveness of all interactions, accounting for input processing and presentation delays. This broader measurement is a far better proxy for true interactivity (as stated by Google) and highlighted missing opportunities.
Even though Google Search Console provides field performance data, it does not provide real-time insights. Its data is aggregated over a 28-day window, which makes it difficult to pinpoint exactly which interactions were causing issues at the moment.
A way to track INP in real time was needed in order to identify the interactions that were both the slowest and most frequently used by users, and reproduce them reliably in the team's development environments. Equally important was understanding the impact of the changes made, not just which fixes helped, but also which tweaks inadvertently made things worse.
For these reasons, a set of tools was used to help diagnose and resolve the issues. The most important ones were:
- Google Chrome DevTools, specifically the Performance tab.
- A custom RUM (Real User Monitoring) system built by the Fotocasa team in Datadog using the web-vitals library.
- React Developer Tools.
Tools to diagnose the problem
To diagnose and debug INP performance issues, the following tools were used.
Google Chrome DevTools
An excellent way to detect and reproduce issues related to the Core Web Vitals in a web application is to use the Performance tab in Google Chrome DevTools. The Performance tab measures Core Web Vitals metrics automatically, providing instant feedback on loading, interactivity, and layout shift metrics. It's broadly consistent with how these metrics are reported to other Google tools.
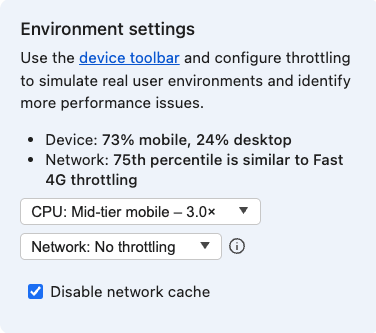
To identify and resolve INP issues, the Fotocasa team typically began by throttling the CPU to simulate the performance of low and mid-end devices. This allowed the Fotocasa team to observe how the page behaves under more constrained conditions. The session was then recorded using the profiler and the traces were carefully analyzed, focusing on the user interaction to pinpoint performance problems.
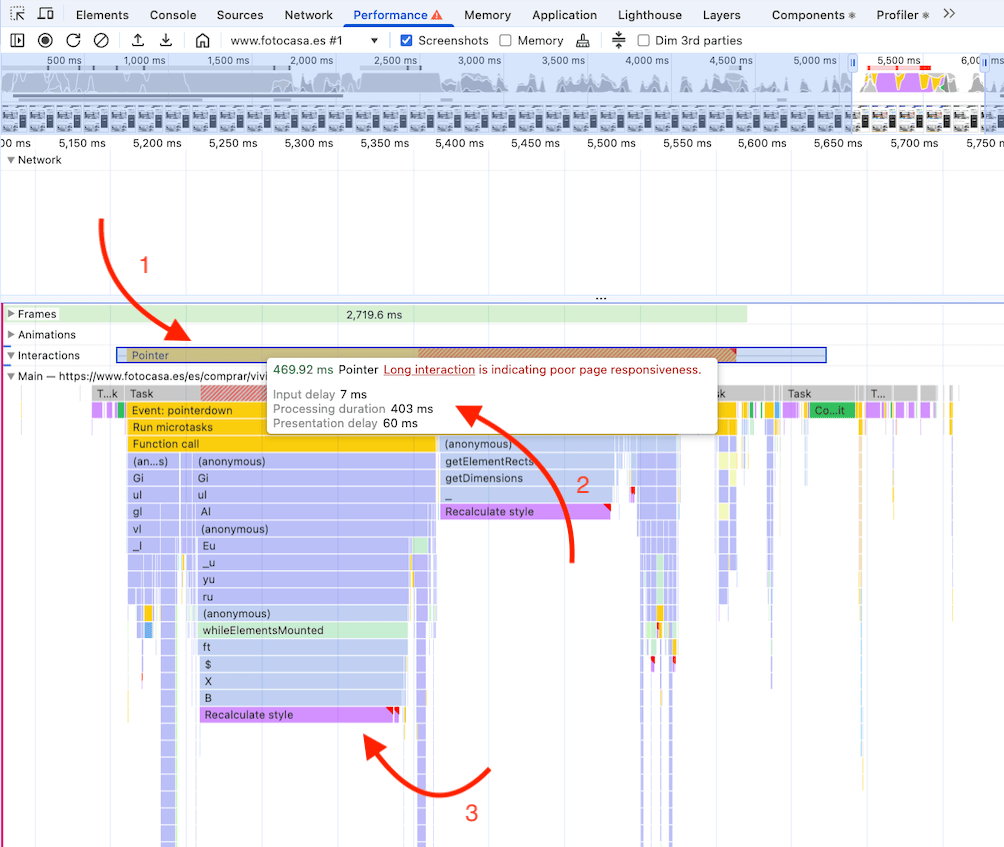
When identifying bottlenecks, it's especially useful to examine the INP sub-parts and the tasks the browser performs within each of them. For example, in the following image, it can be seen that the INP is quite high due to two style recalculations caused by style changes in the body of the document.
Fotocasa set up a system to track the INP and other Core Web Vital metrics, ensuring that any performance issues are quickly identified and addressed. When a metric surpasses a specific threshold (based on Google's defined ranges), the attribution is logged so the problem can be analyzed and resolved.
For that system, the web-vitals library was used to capture these metrics from real users in a way that accurately matches how they are measured by Chrome and reported to other Google tools (such as Chrome User Experience Report, Page Speed Insights, Search Console's Speed Report, and others).
For a comprehensive view and centralized tracking, Fotocasa used Datadog to collect and visualize the data, enabling the team to make informed, data-driven decisions. The custom metrics keep it cost efficient, and better able to track almost all users on the Fotocasa website.
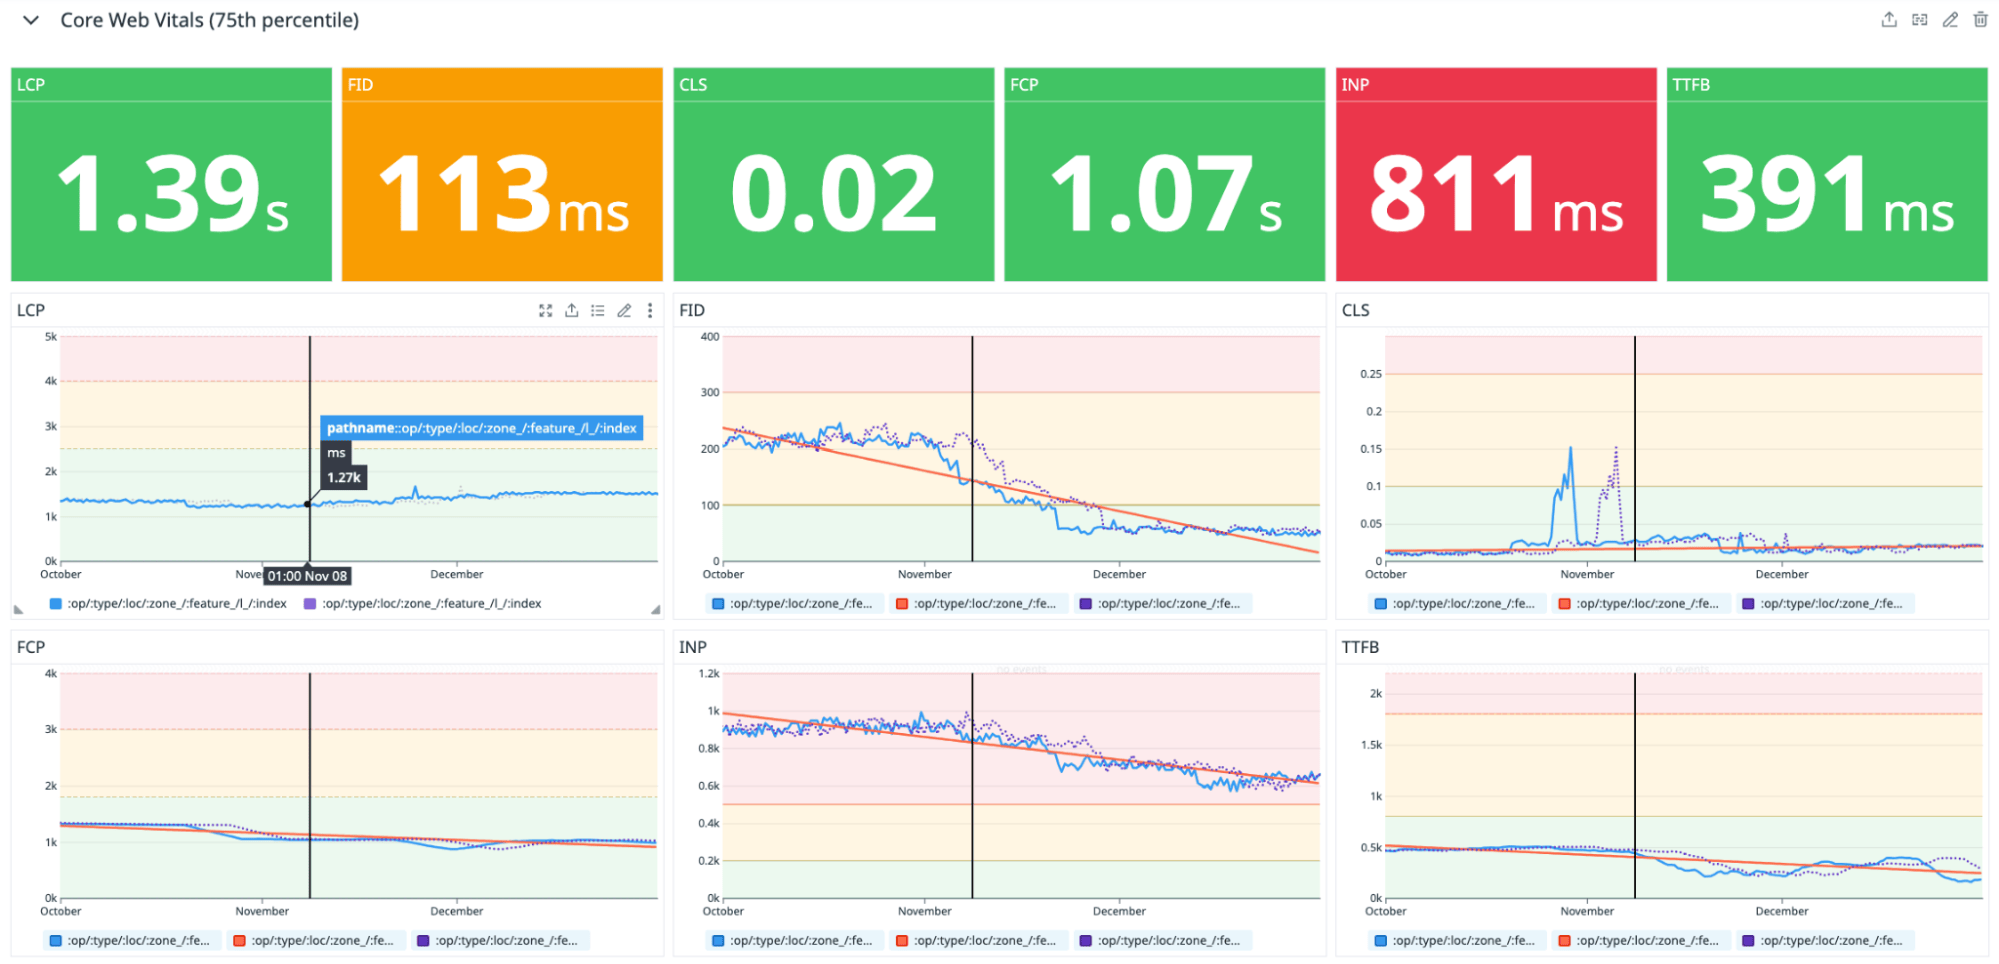
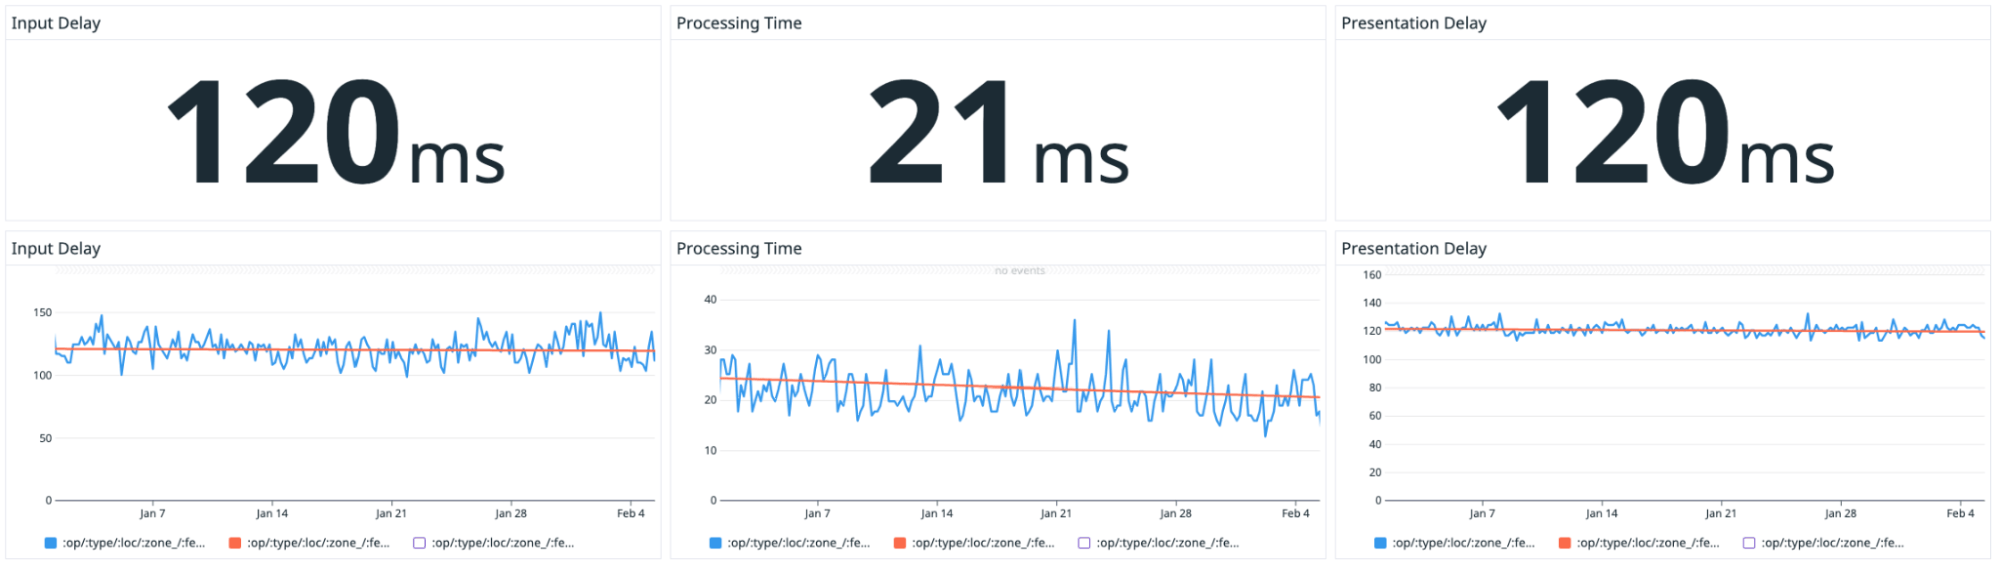
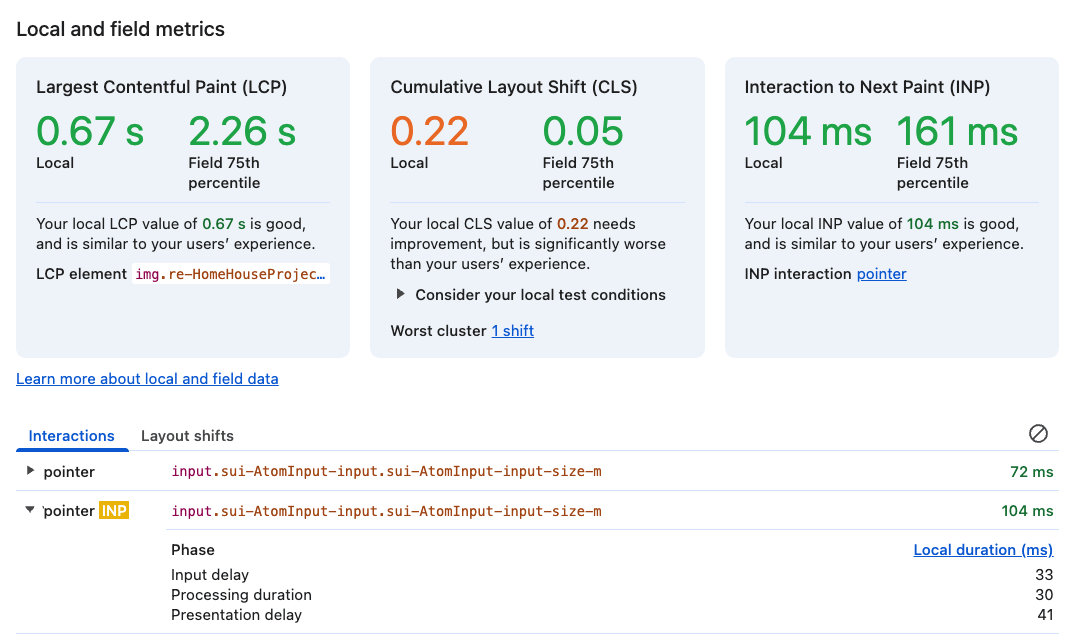
This system lets the Fotocase team swiftly monitor whether their modifications affect the metrics or if unforeseen alterations occur, potentially compromising them. The INP metric can then be dissected into parts such as input delay, processing duration, and presentation delay to pinpoint precisely which part of the interaction is chiefly responsible for long interaction times.
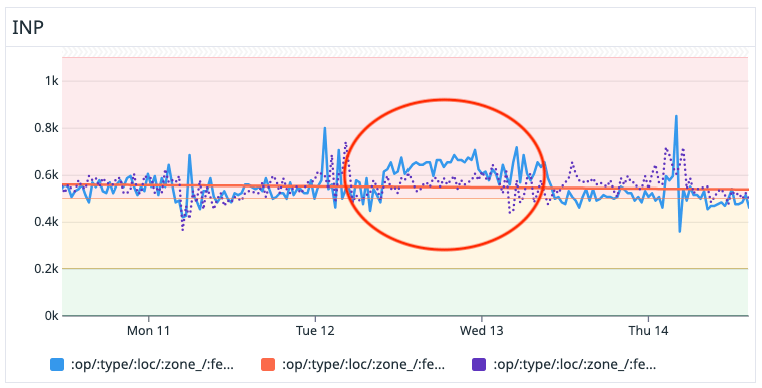
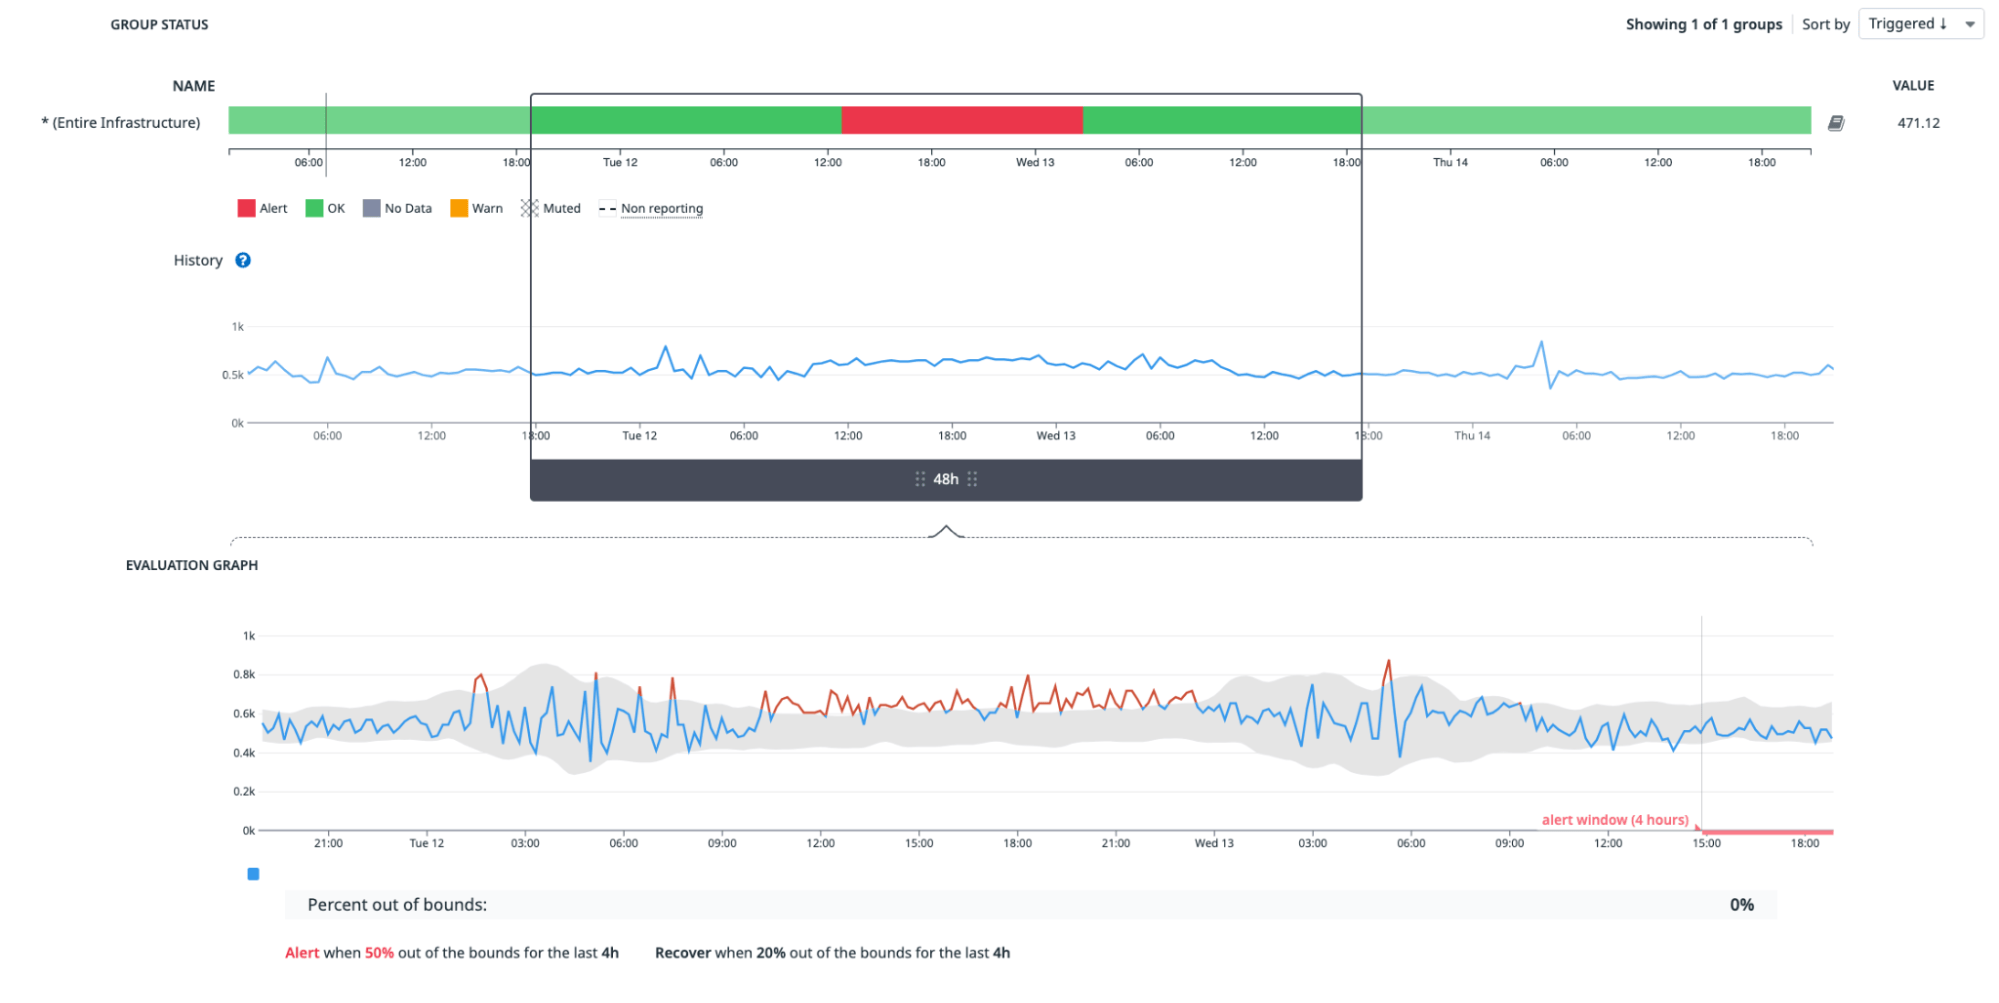
Upon detecting anomalies, like the one illustrated in figures 7 and 8, Fotocasa promptly responded and used OpenSearch, another tool that helped to pinpoint where the alteration may be happening. The data provided by the web-vitals library assisted in identifying the target (the DOM element potentially responsible for an elevated metric value) and helps the team focus more intently on fixing the problem.
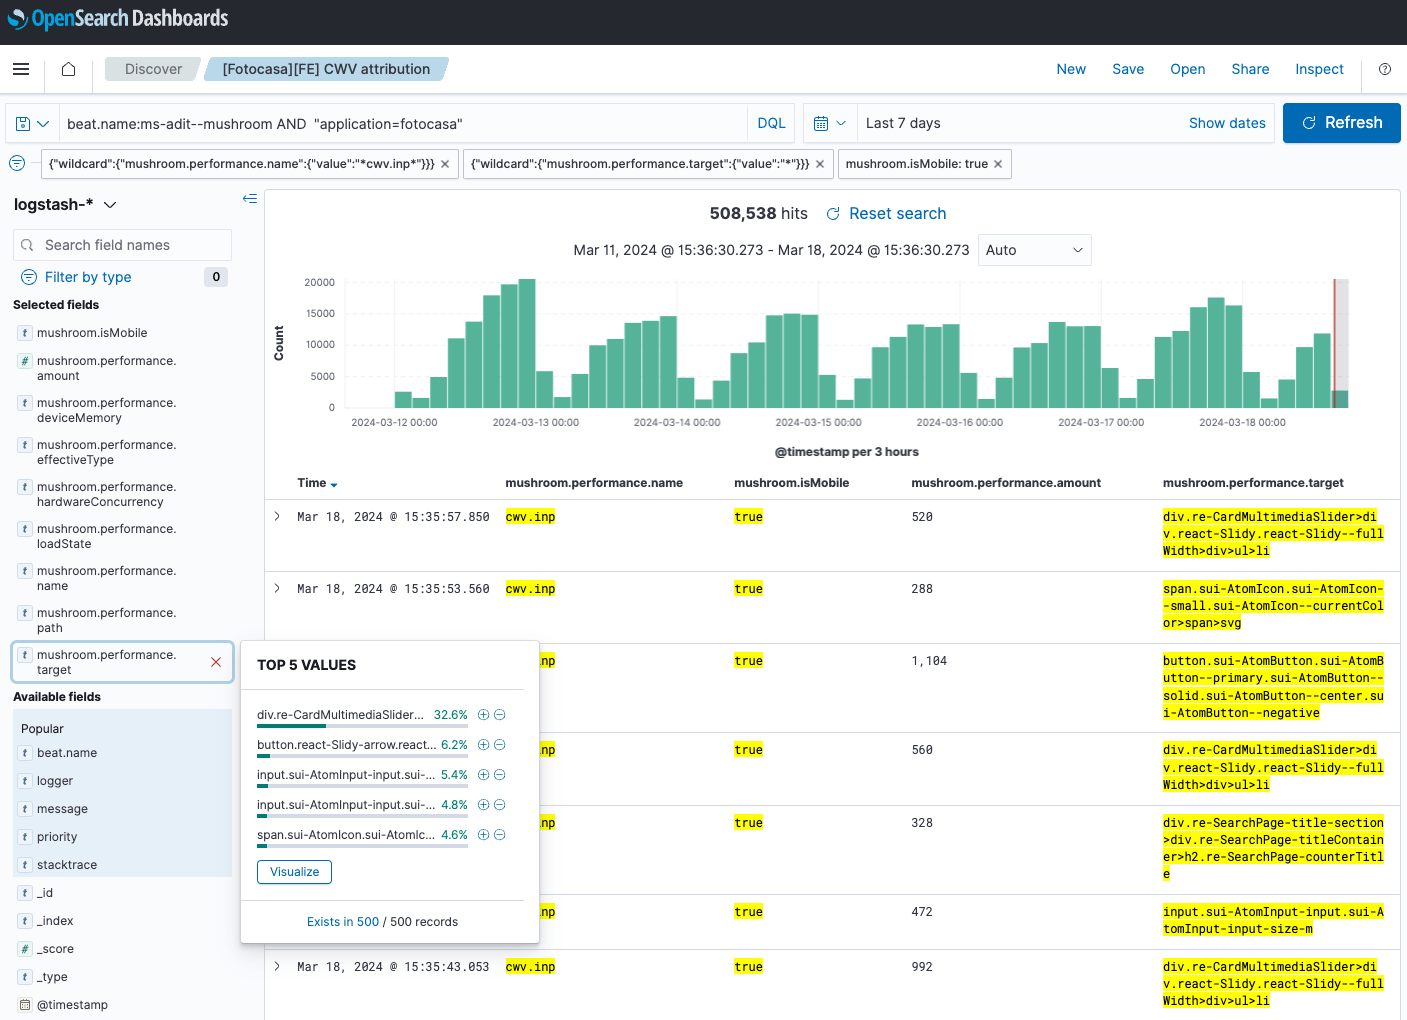
Furthermore, various filters can be defined, such as page type, device, or load state to streamline scenarios, and gain a more accurate understanding of how INP is being impacted.
React Developer Tools
React Developer Tools were used to enhance Fotocasa's debugging capabilities, which provides a powerful feature that lets you highlight components that have been rerendered visually.
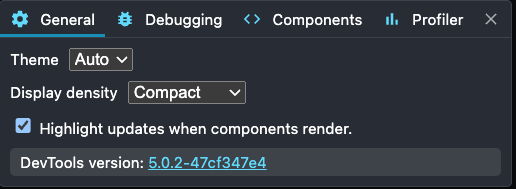
This feature can be enabled by navigating to the Profiler tab. From there, click the cogwheel on the right side of the top bar, go to the General tab, and check the Highlight updates when components render checkbox. With this activated, components are highlighted when they rerender, providing a dynamic visual representation.
Finding out the cause of a rerender
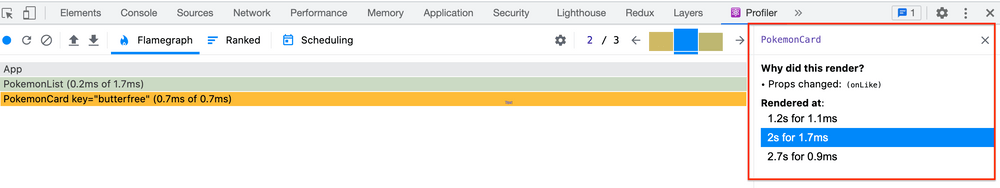
Once a component that has rerendered has been identified, the next question is "why did it happen?" React DevTools answers this with a helpful tooltip in the flame graph view.
To access this information, record a profiler session. By analyzing the profiler output, you'll find helpful information:
- In the top-right corner, the number of React commits is displayed.
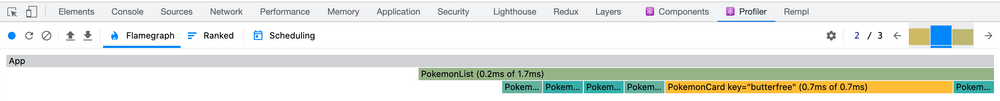
- The flame graph visually represents the component tree, with grey indicating components that did not rerender. Each bar represents a moment when the React component tree changed, and when a corresponding change was committed to the DOM.
- Hovering over each component in the flame graph will show the reason for its rerender under the Why did this render?" subheading.
Reasons for a component rerender may include:
- This is the first time the component was rendered
- Context changed
- Hooks changed
- Props changed
- State changed
- The parent component rendered
Finding out the rendering time
The colors in the flame graph convey meaningful information. Colors such as various shades of blue indicate that a component required a relatively short rendering time compared to other components. Conversely, colors like orange and red signify that a component incurred more rendering time.
How the Fotocasa team fixed the problem
Remove unnecessary rerenders
Rerenders happen whenever React needs to update the UI with new data. This usually comes from a user action, an API response, or other important events that require a user interface update. Since each rerender runs JavaScript, too many of them at once—especially in a big component tree—can block the main thread and cause performance issues.
There are two kind of rerenders:
- Necessary rerenders: When a component genuinely needs to update because it owns or uses fresh data.
- Unnecessary rerenders: When a component updates without any meaningful change, often due to inefficient state management or improper prop handling.
A few unnecessary rerenders usually aren't a big deal, as React is fast enough that users generally won't notice. If they happen too often, however, or across a heavy component tree, they can hurt the user experience and negatively affect the page's INP.
This was the case for the Fotocasa team. They realized that the website had many unnecessary rerenders. These occurred in two main scenarios:
- During page load: Increasing the number of long tasks on the main thread and delaying the first interaction, which negatively affected the page's INP.
- During user interactions: Increasing the processing time of most interactions, which also harmed INP.
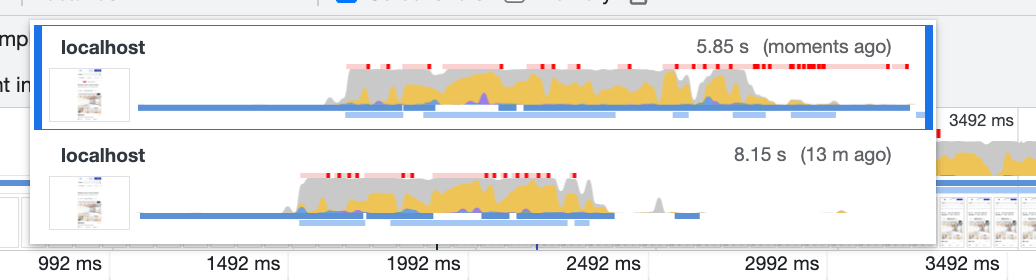
A lot of unnecessary rerenders ended up being optimized on the Fotocasa website. One of the biggest optimizations realized was on the Search page. There were three unnecessary rerenders on page load. Once these were removed, the following results were observed:
- Less number of long tasks (see the following figure)
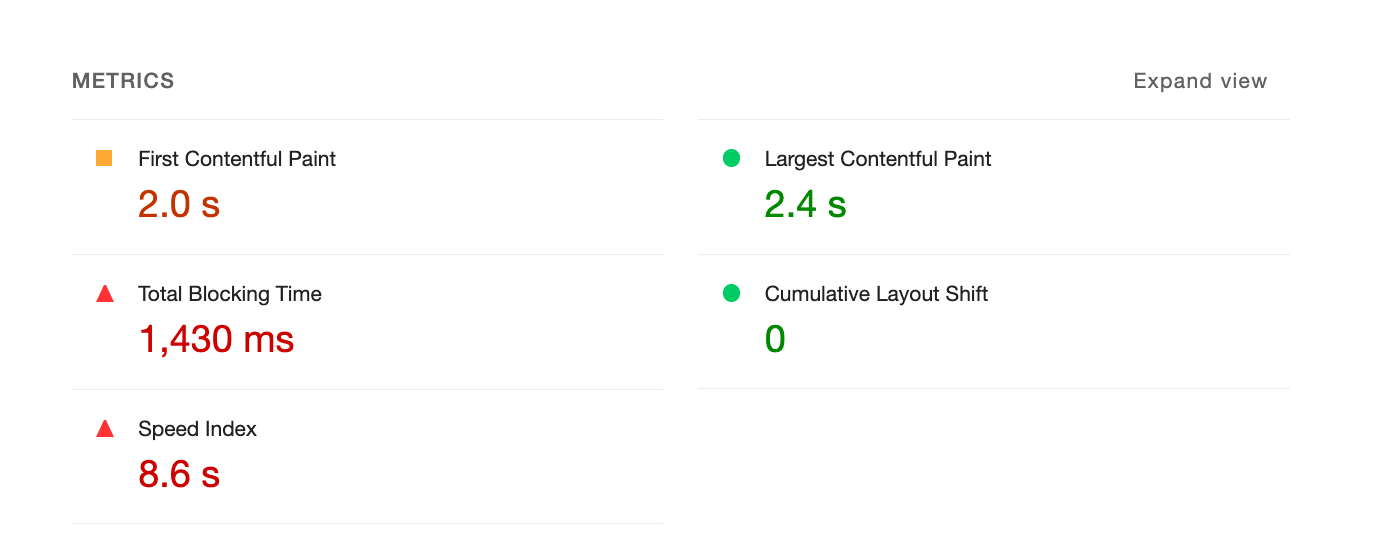
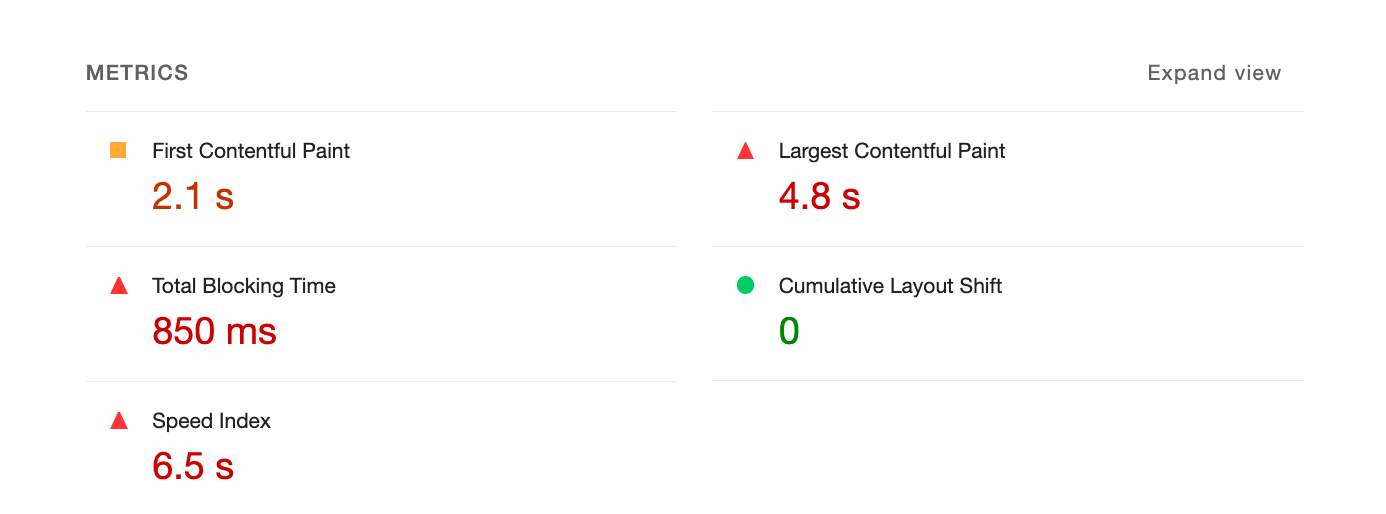
- Less Total Blocking Time (compare figures 14 and 15)
State colocation
Improper placement of React state can slow down an application and make the UI feel unresponsive. When a component's state changes, its child components will rerender by default unless an escape hatch is used (for example, memo).
As explained in the previous section, rerenders are not inherently bad, but rerendering the entire page due to a specific state update can lead to slower interactions, since DOM updates occur after the render.
For example, on the Search page there is a dialog that shows all the filters when a button is clicked.
The state that controls the open state of the dialog in this case was placed in the Search page. When this state changed the whole page was being rerendered causing a bad INP, particularly on slower devices as seen when CPU throttling was used in DevTools:
Changing the state as near as possible to the component that triggers the change solves this issue. In this particular case, the state could be placed in the button component of the filters so when the state changes, only the button will be rerendered.
Remove unnecessary states
States shouldn't contain redundant or duplicated information. If they do, it could lead to unnecessary rerenders, and cause issues.
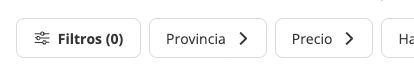
For example, in the Fotocasa filters bar, there is text representing the number of filters applied for a given search:
The number of applied filters is calculated from the application's state. However, this not only resulted in an unnecessary rerender of the entire component but in certain cases also led to a layout shift since this component is server-side rendered:
const [filtersCount, setFiltersCount] = useState(DEFAULT_COUNTER)

useEffect(() => {
  const counter = filters
    ? Object.keys(filters)
        ?.reduce(reducerCounter, [])
        ?.filter((param) => searchParams?.[param]).length
    : DEFAULT_COUNTER

  setFiltersCount(counter)
}, [searchParams]);
To solve this problem, the value was derived from the filters object using a variable instead of using state:
const counter = filters
    ? Object.keys(filters)
        ?.reduce(reducerCounter, [])
        ?.filter((param) => searchParams?.[param]).length
    : DEFAULT_COUNTER;
Reduce expensive renders
When an interaction occurs in a React application, it normally triggers a state change. As explained previously, when the state of a component changes, the component will be rerendered along with all of its children.
If one of these components render functions is slow it will negatively affect the page's INP since a long task will probably be generated, and the DOM will take more time to update.
The Fotocasa team tried to minimize time-consuming computations within the render function of components as much as possible. Chrome DevTools and React Developer Tools were quite useful in detecting slow rendering operations.
Delay code execution
Besides optimizing the render function of components, other functions were optimized to minimize long tasks as much as possible. However, some tasks couldn't be optimized because they depended on third-party code.
One example was analytics. In this case, it was decided to delay the execution of analytics code and prioritize DOM updates when user interactions occurred. To achieve this, the Fotocasa team used a library called idlefy, which also ensured that the analytics code would still run even if the browser was closed immediately afterward.
Performance culture
Performance work is not a one-time effort, it's something that must be considered with every feature released to production. Everyone on the team needs to be aligned, otherwise regressions in Core Web Vitals are almost inevitable.
To stay on top of this, the Fotocasa team actively shared knowledge within the team and established a clear framework for identifying performance issues based on Fotocasa's Datadog RUM data, including how to reproduce them. Alerts for Core Web Vitals—especially INP—were set up in the RUM system, configured to notify the Fotocasa team directly in Slack. This approach kept performance top of mind, and helped to catch issues before they turned into regressions.
Results
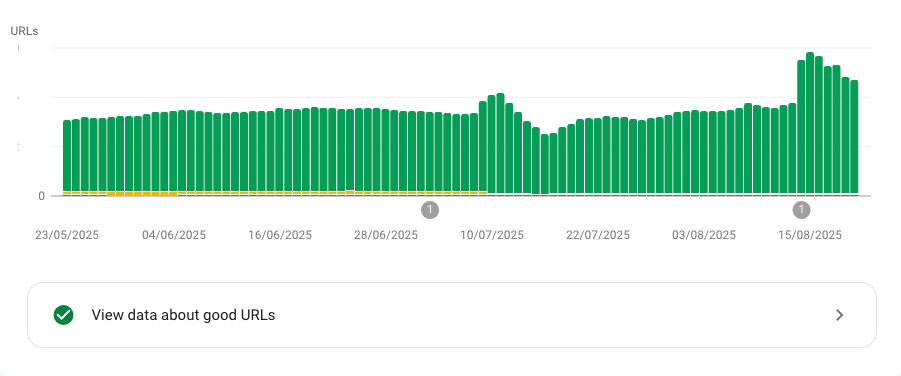
Improving INP at Fotocasa required a combination of technical optimizations and cultural changes. By eliminating unnecessary re-renders, optimizing state placement, reducing expensive renders, and deferring non-critical code, the Fotocasa team successfully moved all desktop pages from "needs improvement" to "good," and significantly improved mobile pages by upgrading almost all "poor" and "needs improvement" pages to "good".
These changes enhanced Fotocasa's overall user experience and, together with other initiatives, drove a 27% increase in contact and phone lead ads, directly strengthening the company's key business metrics.
Real-time monitoring with Datadog allowed the Fotocasa team to validate the INP improvements, quickly detect anomalies, and prevent regressions. Beyond these achievements, Fotocasa also managed to embed web performance into their development culture, ensuring that INP and Core Web Vitals remain a priority in every release.