

Lighthouse is a tool that helps you measure and find ways to improve a page's performance. Here's the general workflow for how you use Lighthouse:
- You tell Lighthouse what page to audit.
- Lighthouse loads that page and records how long the page takes to hit various performance milestones. These milestones are called metrics.
- Lighthouse gives you a report on how the page did. The report provides a score for each metric and a list of opportunities which, if you implement them, should make the page load faster.
Your mission is to improve your metrics scores over time, or at least make sure that they don't get worse. There's no way to work on metrics directly, though. Instead, you follow the opportunities that Lighthouse provides. Working on those opportunities tends to improve your metrics scores.
Run Lighthouse from your profile page
Run Lighthouse from your web.dev profile page:
Provide any URL, and Lighthouse runs a series of audits generating a report of how well the page did.
Review the audits report to identify areas in which your page can be improved.
For each audit, you'll find guidance and immediate steps you can take to improve your scores.
Run Lighthouse from Chrome DevTools
Chrome DevTools is the set of web developer tools that are built directly into the Google Chrome browser. You don't have to download anything to get DevTools. If you have Chrome, then you have DevTools.
- In Chrome, go to the page that you want to audit.
- Press `Control+Shift+J` (or `Command+Option+J` on Mac) to open DevTools.
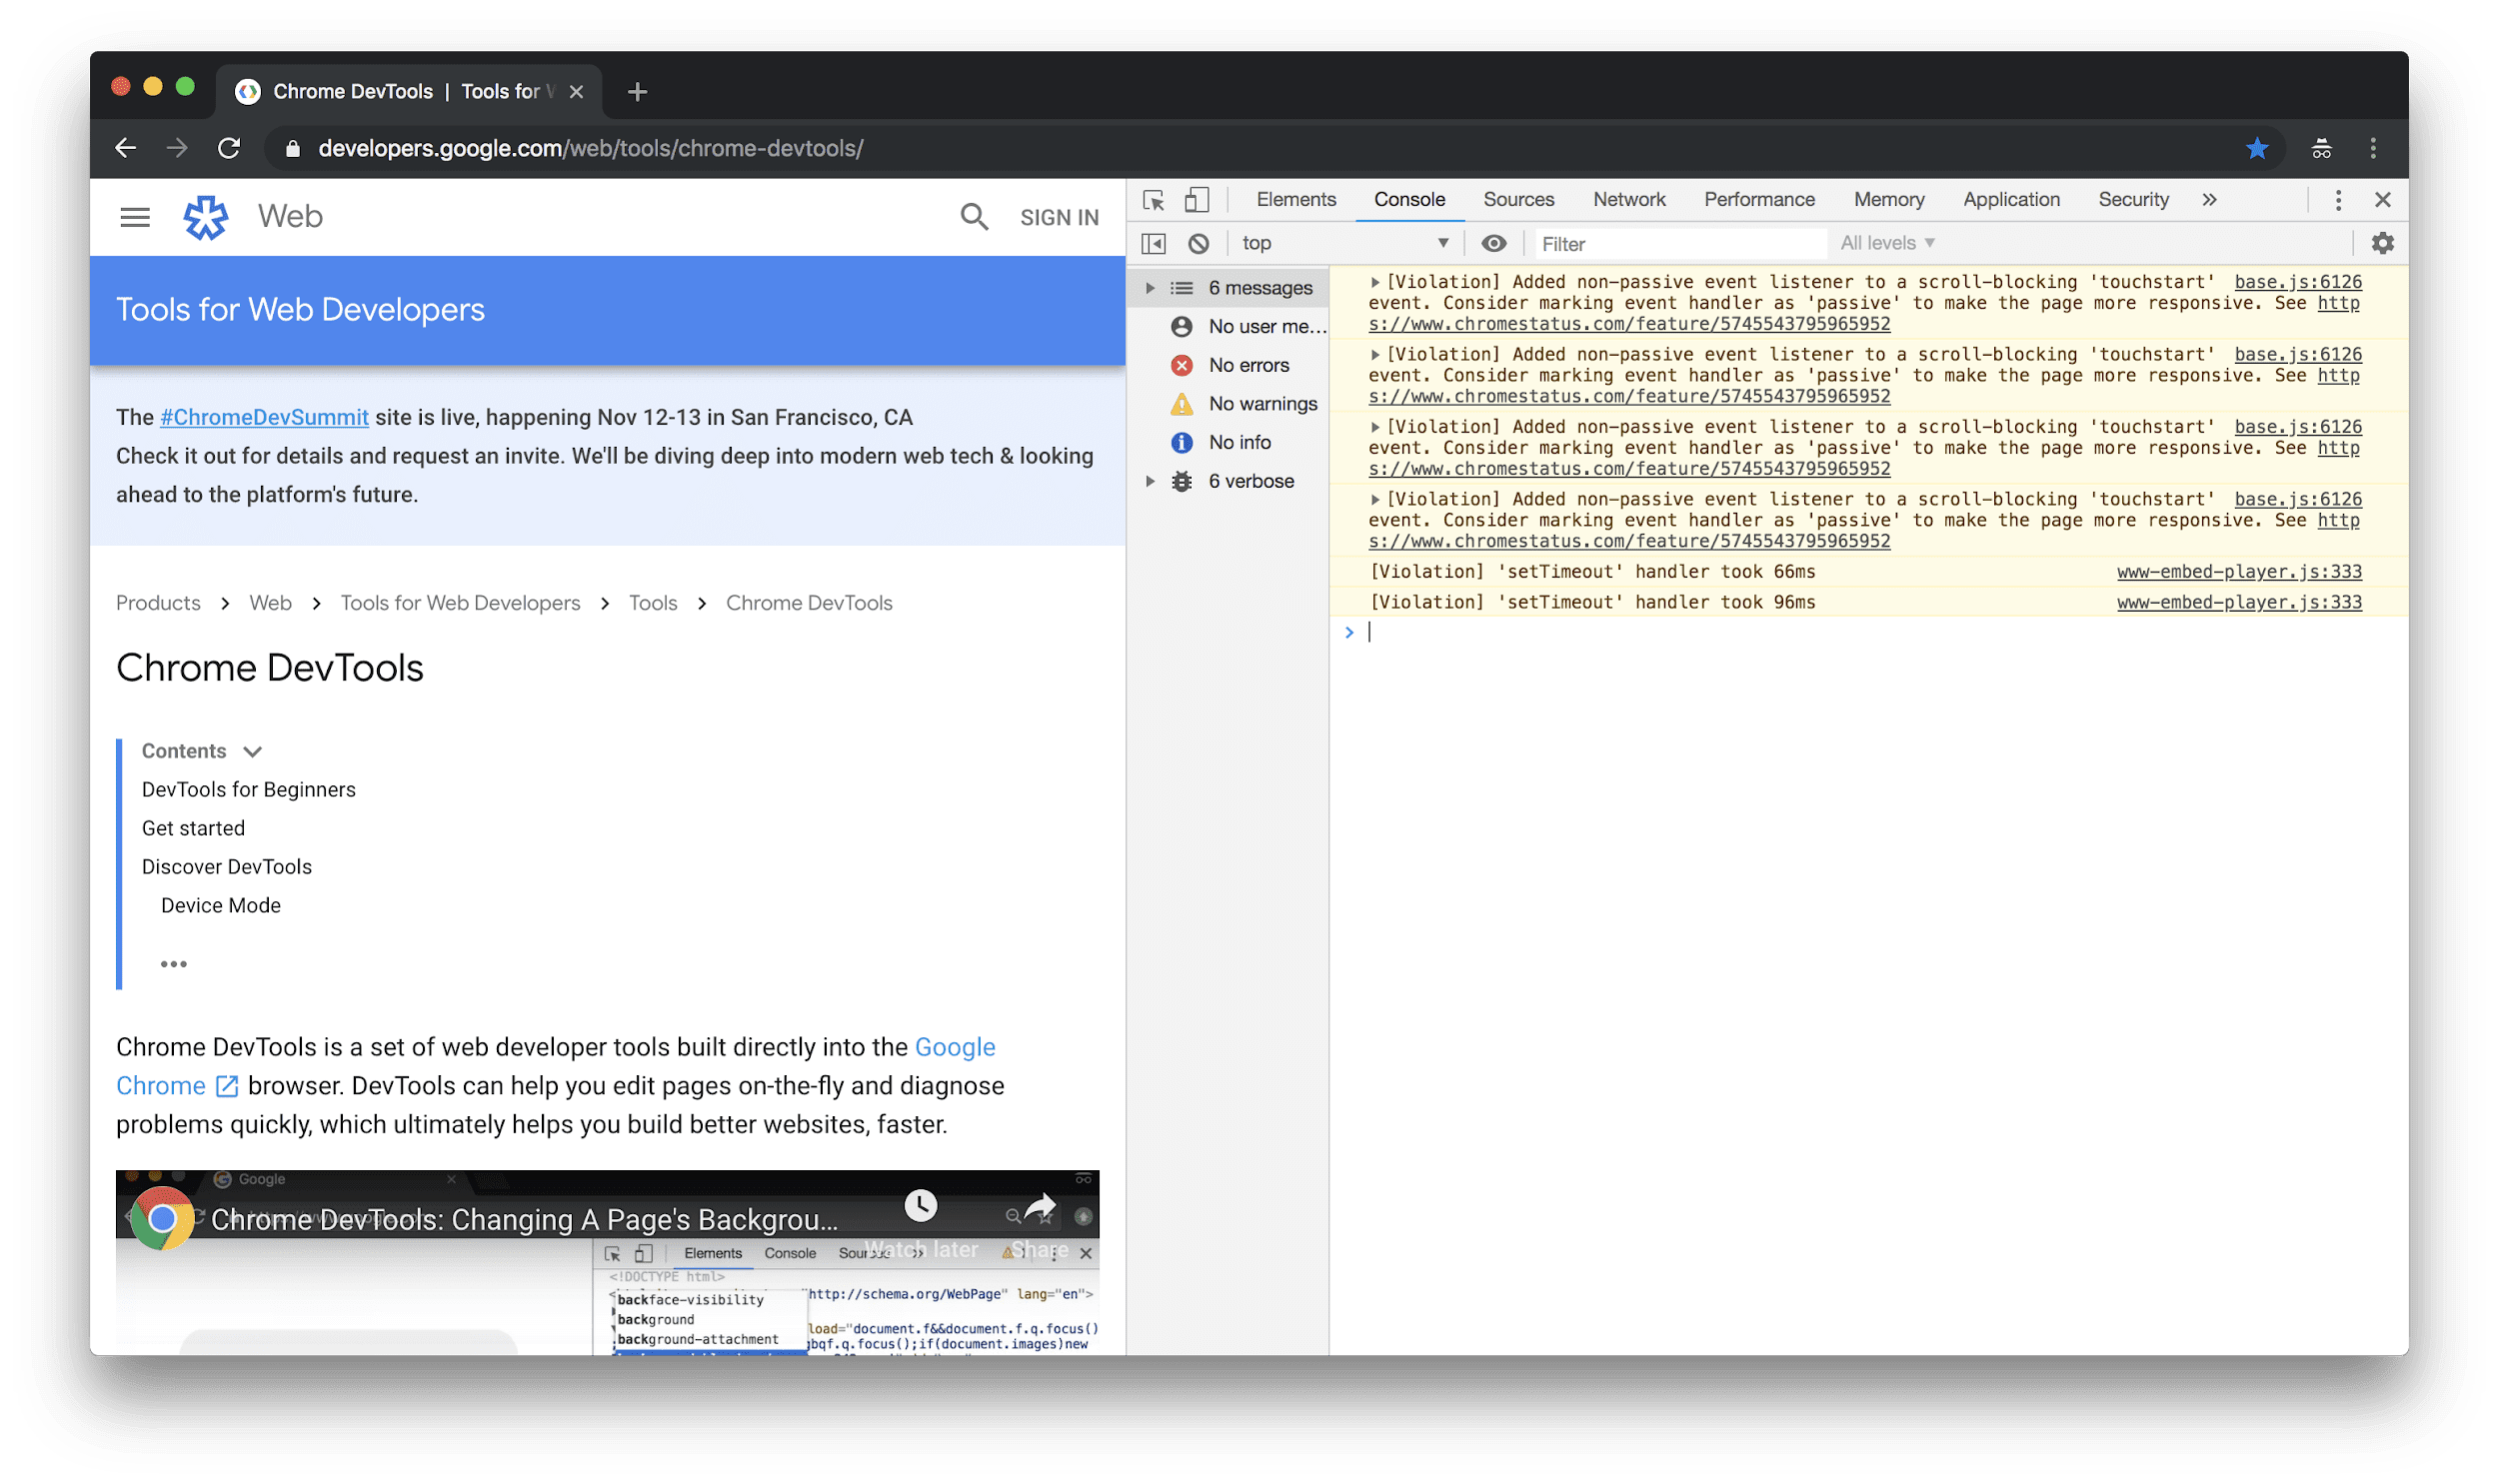
Click the Audits tab. If you don't see this tab, click the » symbol and then select Audits from the list. Lighthouse is the engine that powers the Audits panel. That's why you see an image of a lighthouse.
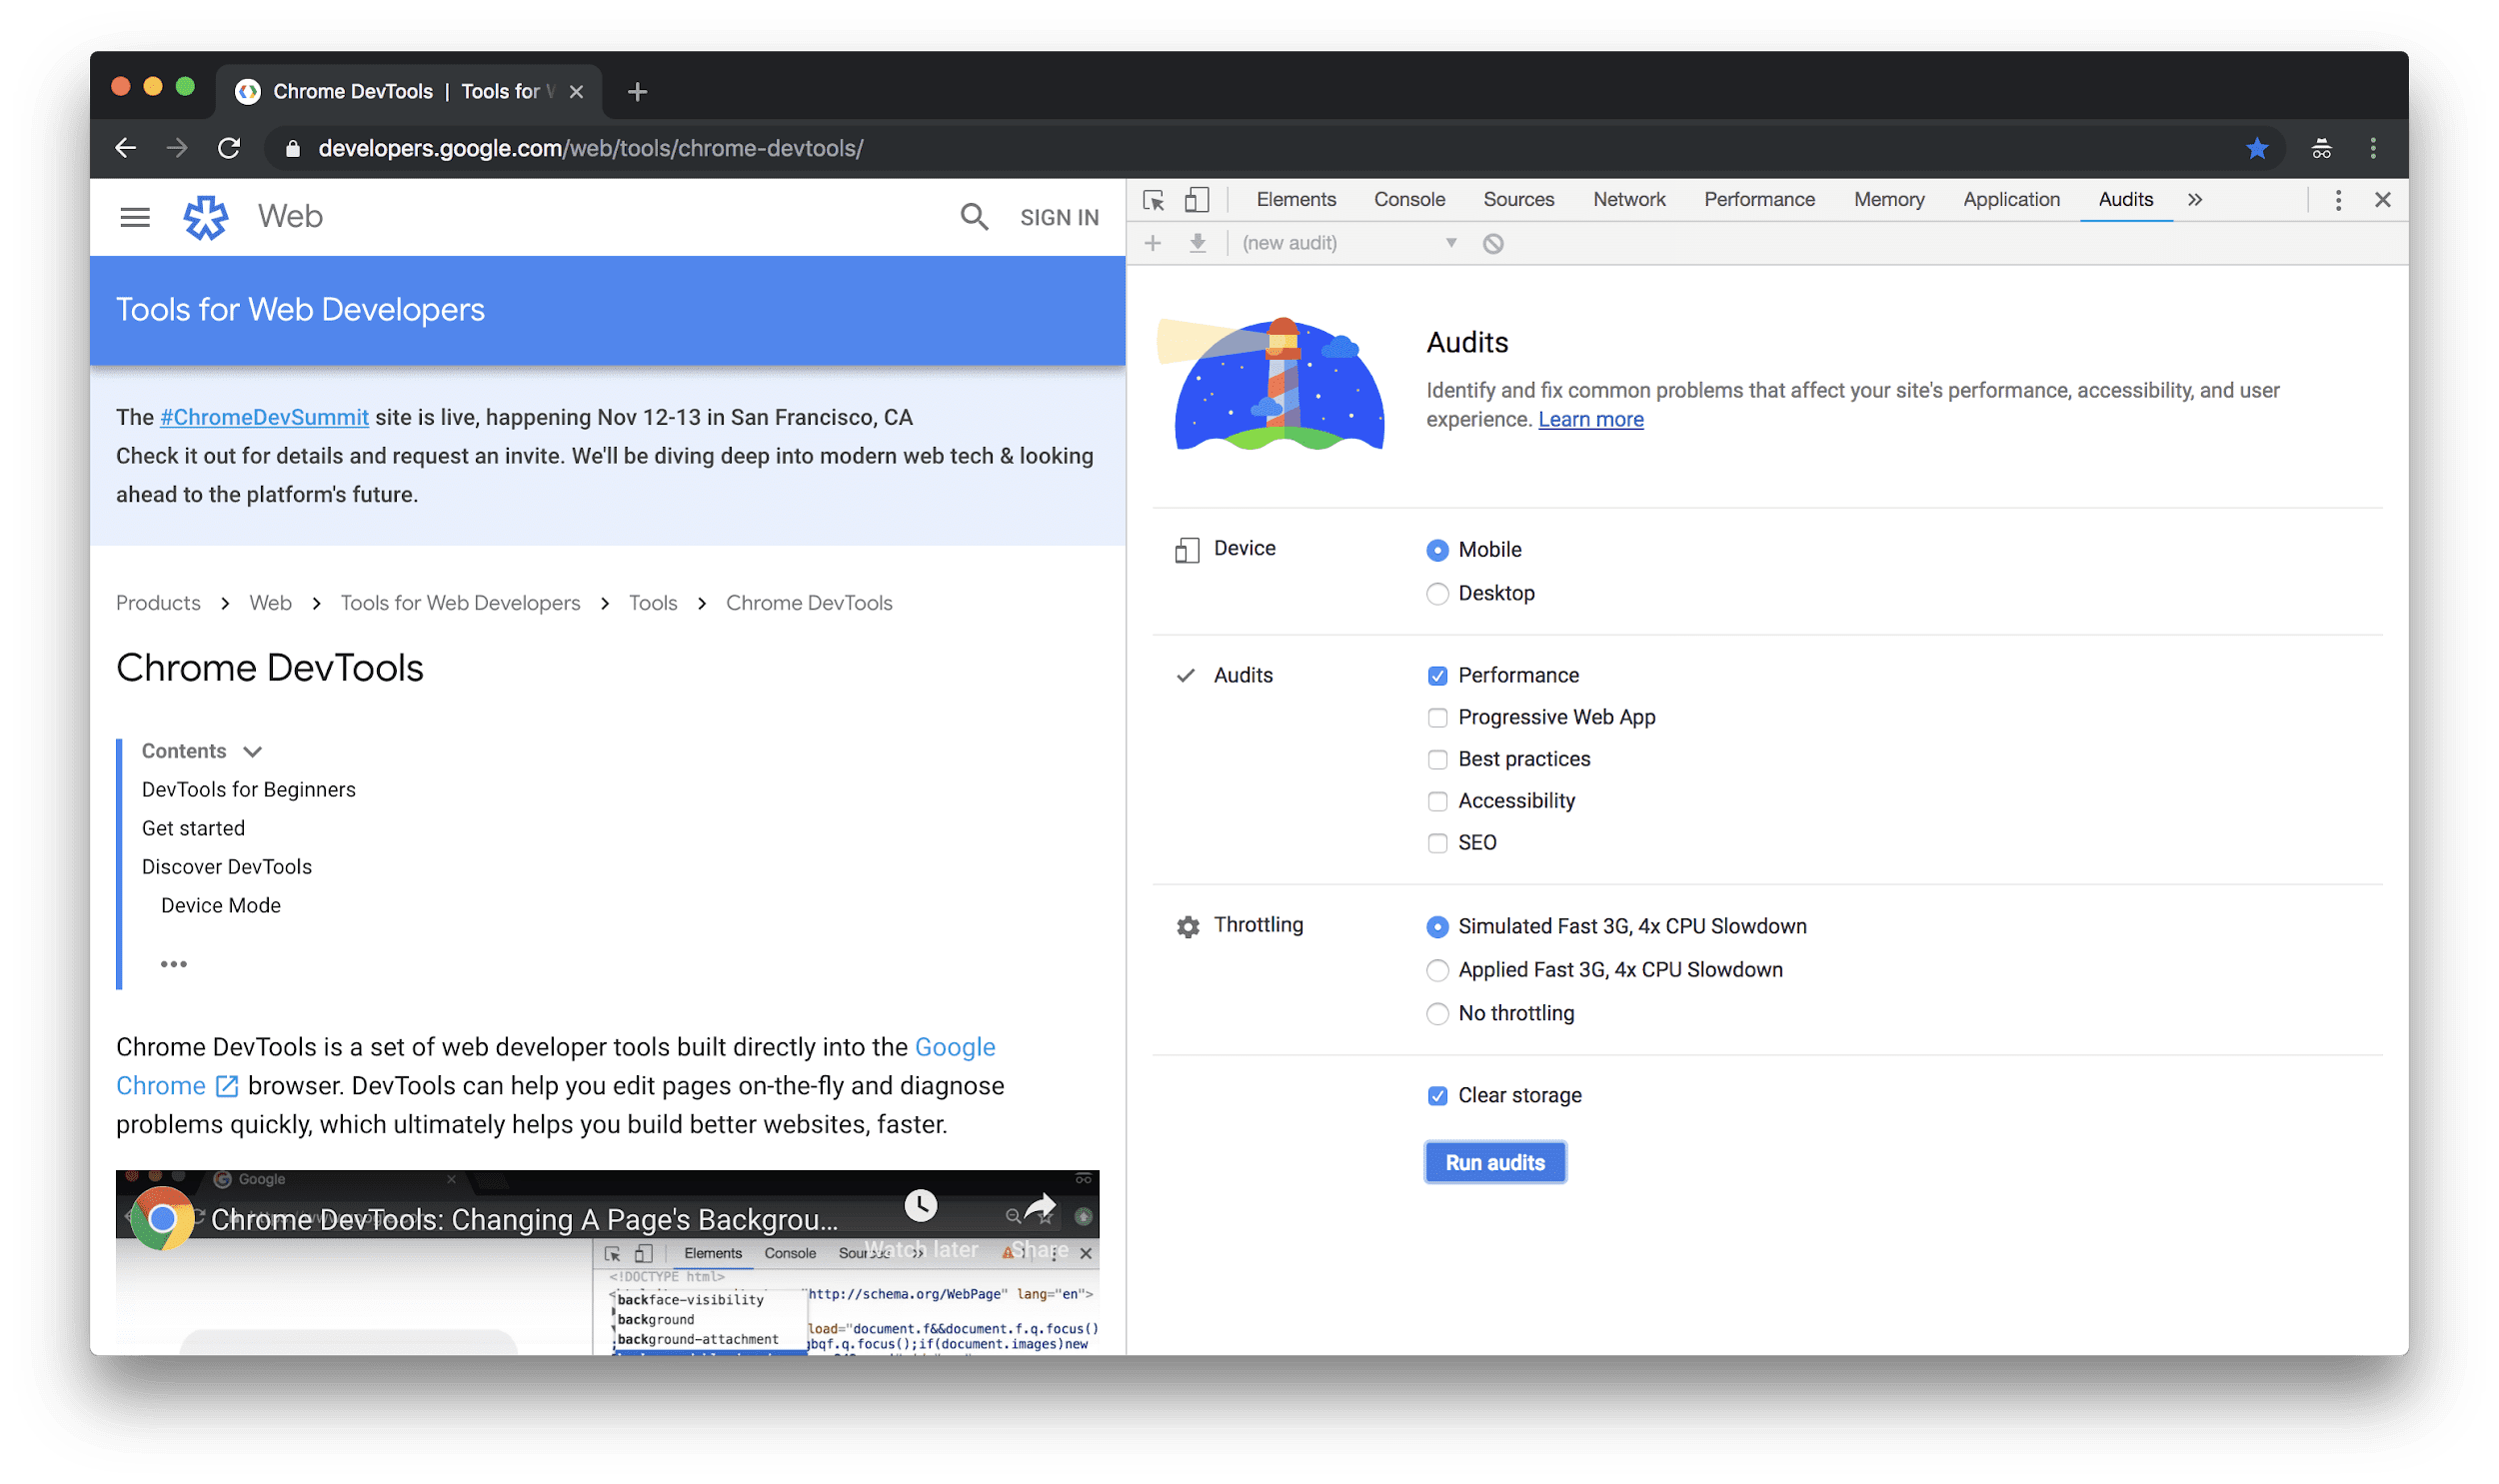
- Make sure the Mobile radio button is selected. When Lighthouse audits your page, it will simulate a mobile device's viewport and user agent string.
- Make sure the Performance checkbox is enabled. You can enable or disable the rest of the checkboxes in the Audits section. If you enable them, then you'll see a bunch of opportunities on ways to improve those other aspects of your page.
- Make sure the Simulated Fast 3G, 4x CPU Slowdown radio button is selected. Lighthouse doesn't actually throttle your network or CPU while it loads the page. Instead, it looks at how long the page took to load under normal conditions, and then it estimates how long it would have taken on a fast 3G network with a CPU that is 4 times less powerful than your machine's.
- Make sure that the Clear Storage checkbox is enabled. This option forces Lighthouse to go to the network for every page resource, which is how first-time visitors experience the page.
- Click Run Audits. After 5 to 10 seconds, Lighthouse shows you a report.
For example, if you run some audits with Simulated Fast 3G, 4x CPU Slowdown throttling enabled and then other times you run audits with throttling disabled, your metrics scores will be significantly lower when you have throttling enabled. You might spend a lot of time trying to figure out why your page is so much slower now, when in reality the only thing that changed was your configuration.
Understand your report
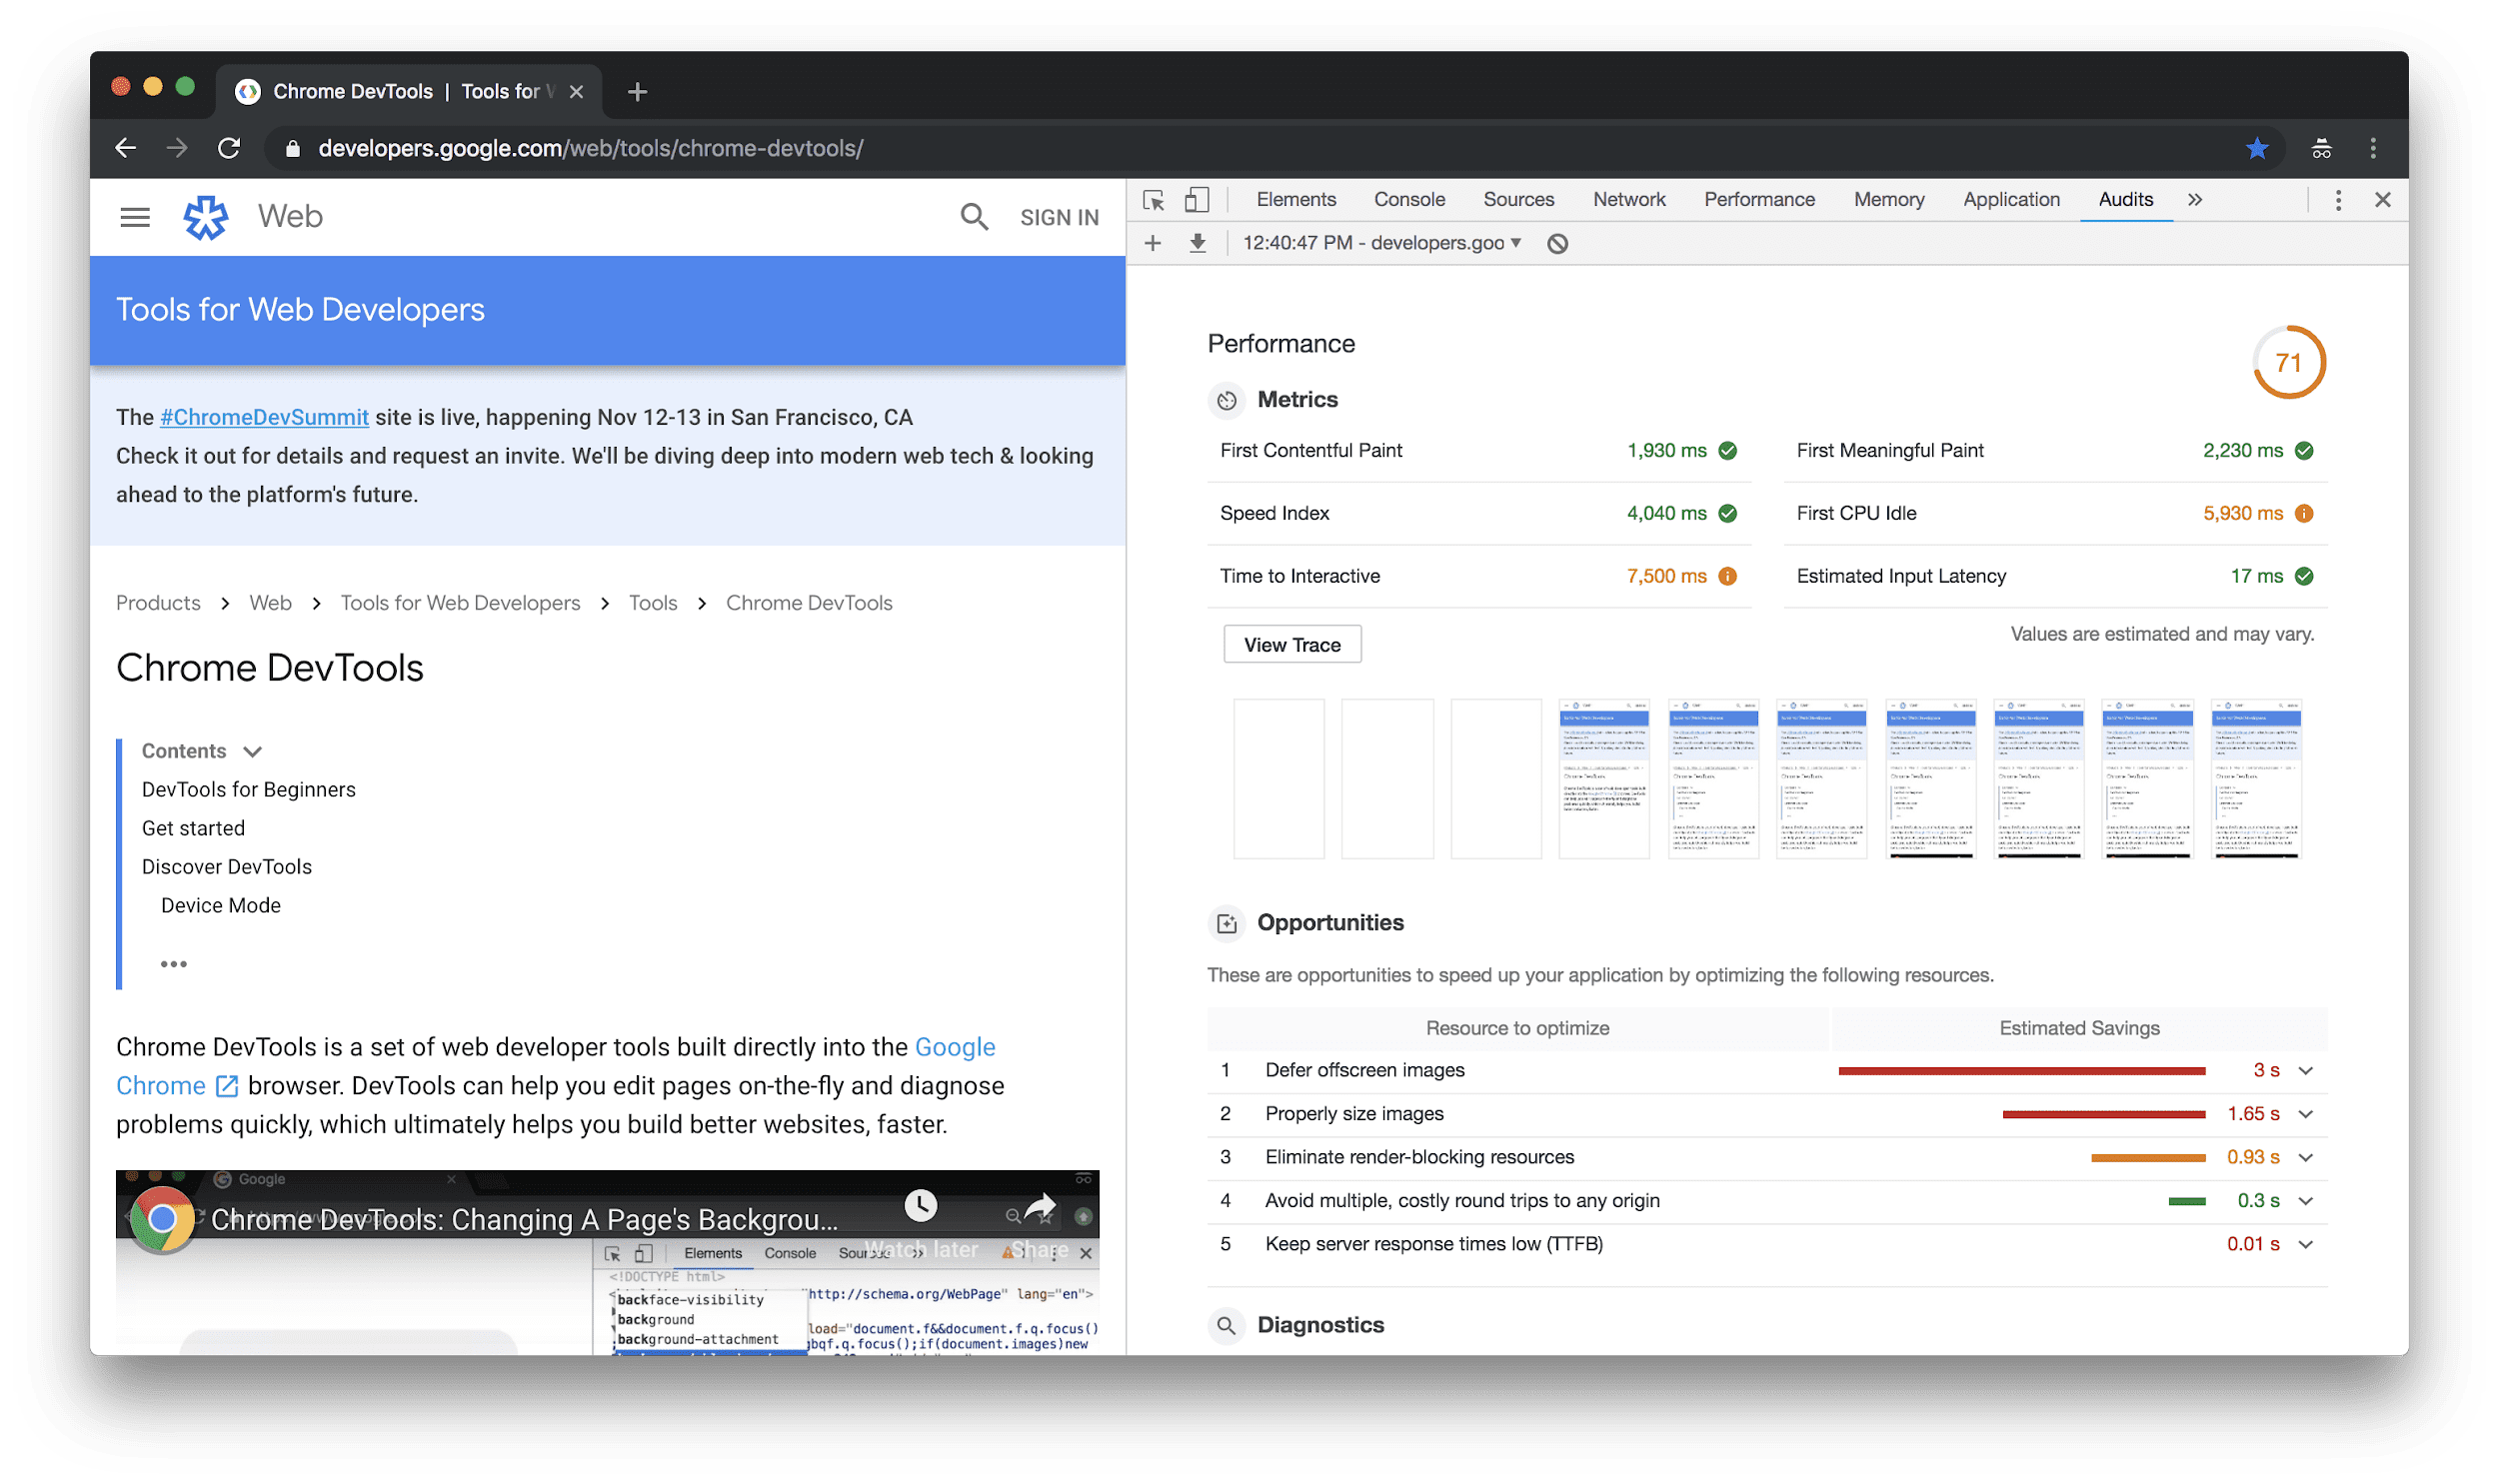
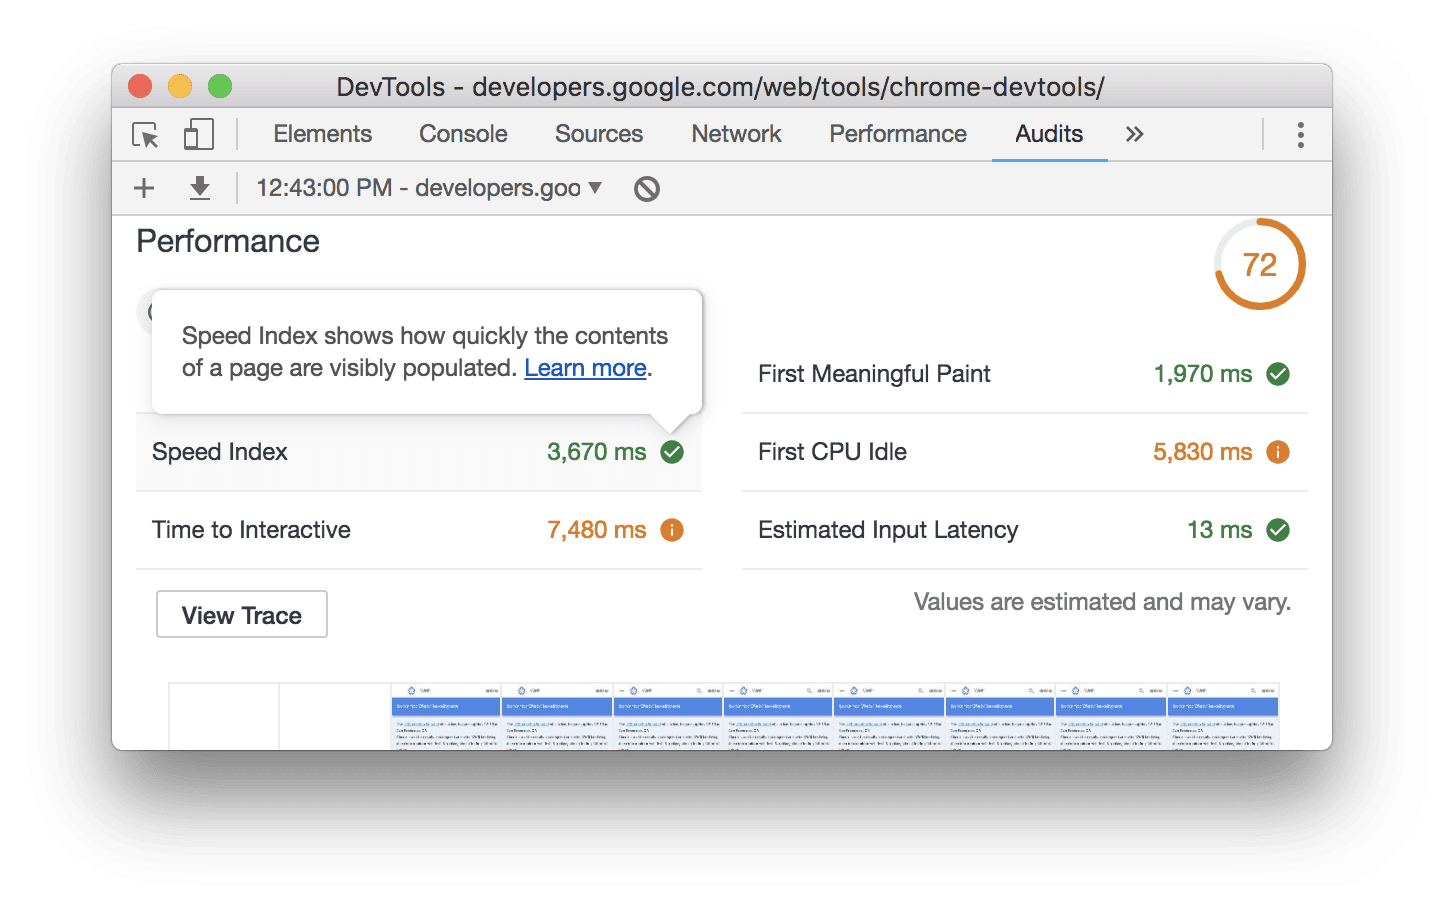
The top-right of your report lists your overall performance score. 100 is a perfect score. Below the overall score are the metrics scores. Lighthouse v3 Scoring Guide explains how each metric score contributes to the overall score.
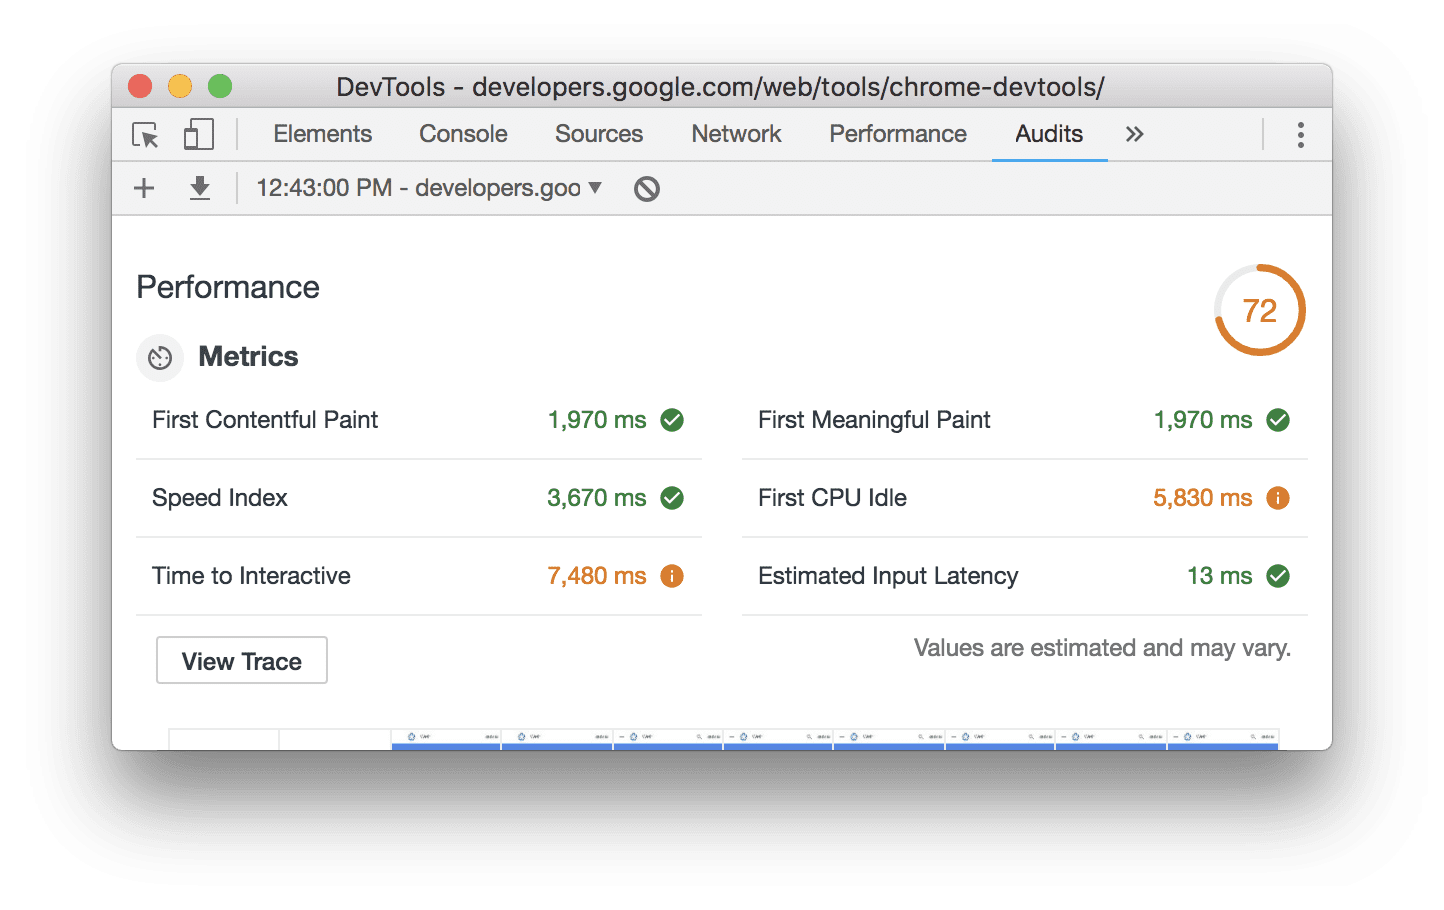
Hover over a metric to learn more about it. Click Learn more to read documentation about it.
Below your metrics scores you see screenshots of how the page looked while it loaded.
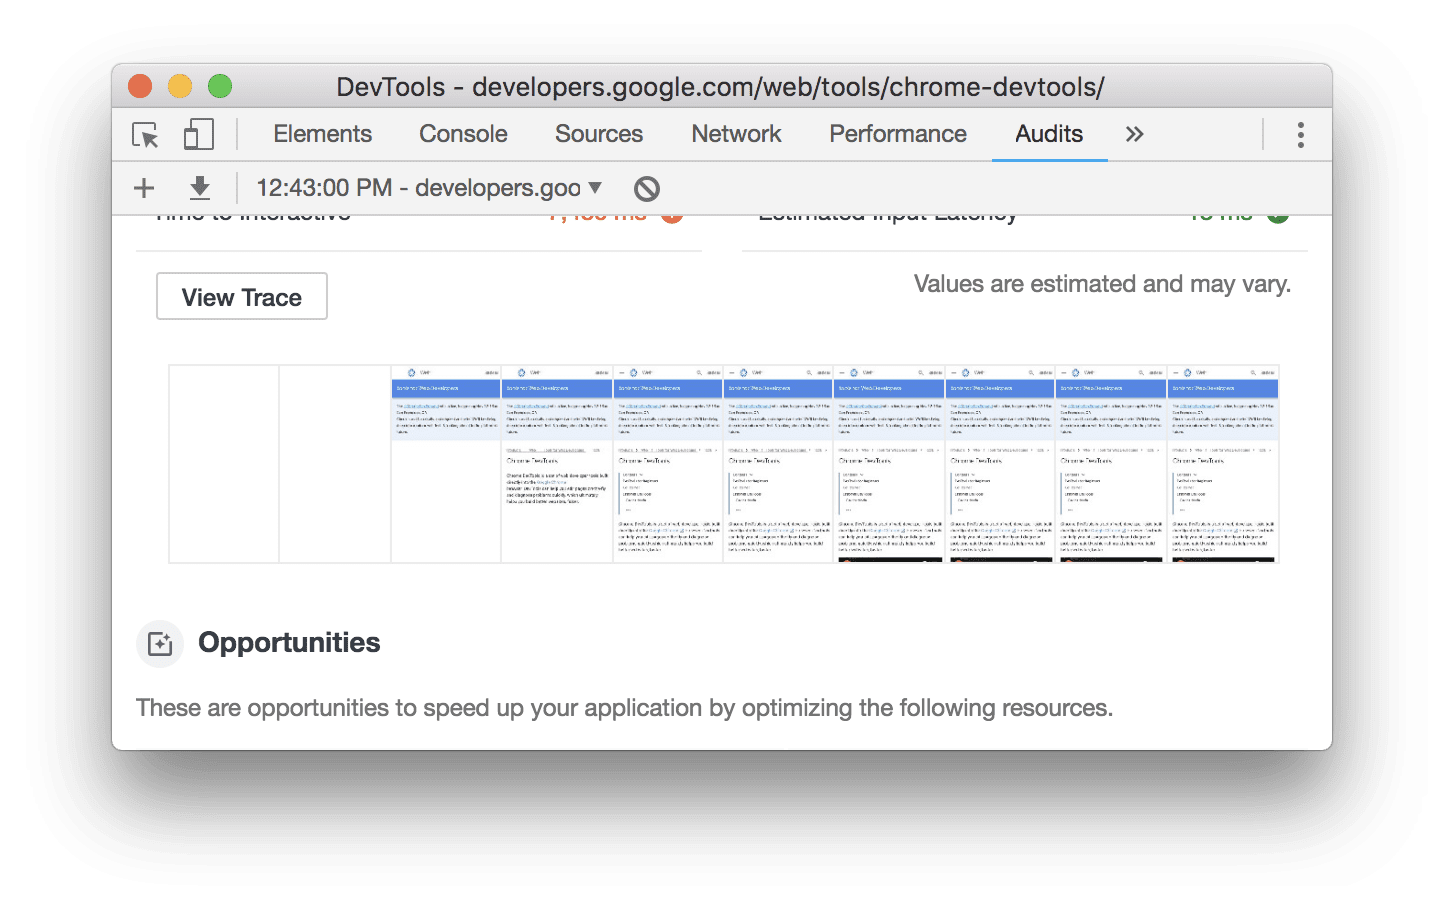
Below the screenshots you see opportunities for improving the page's performance.
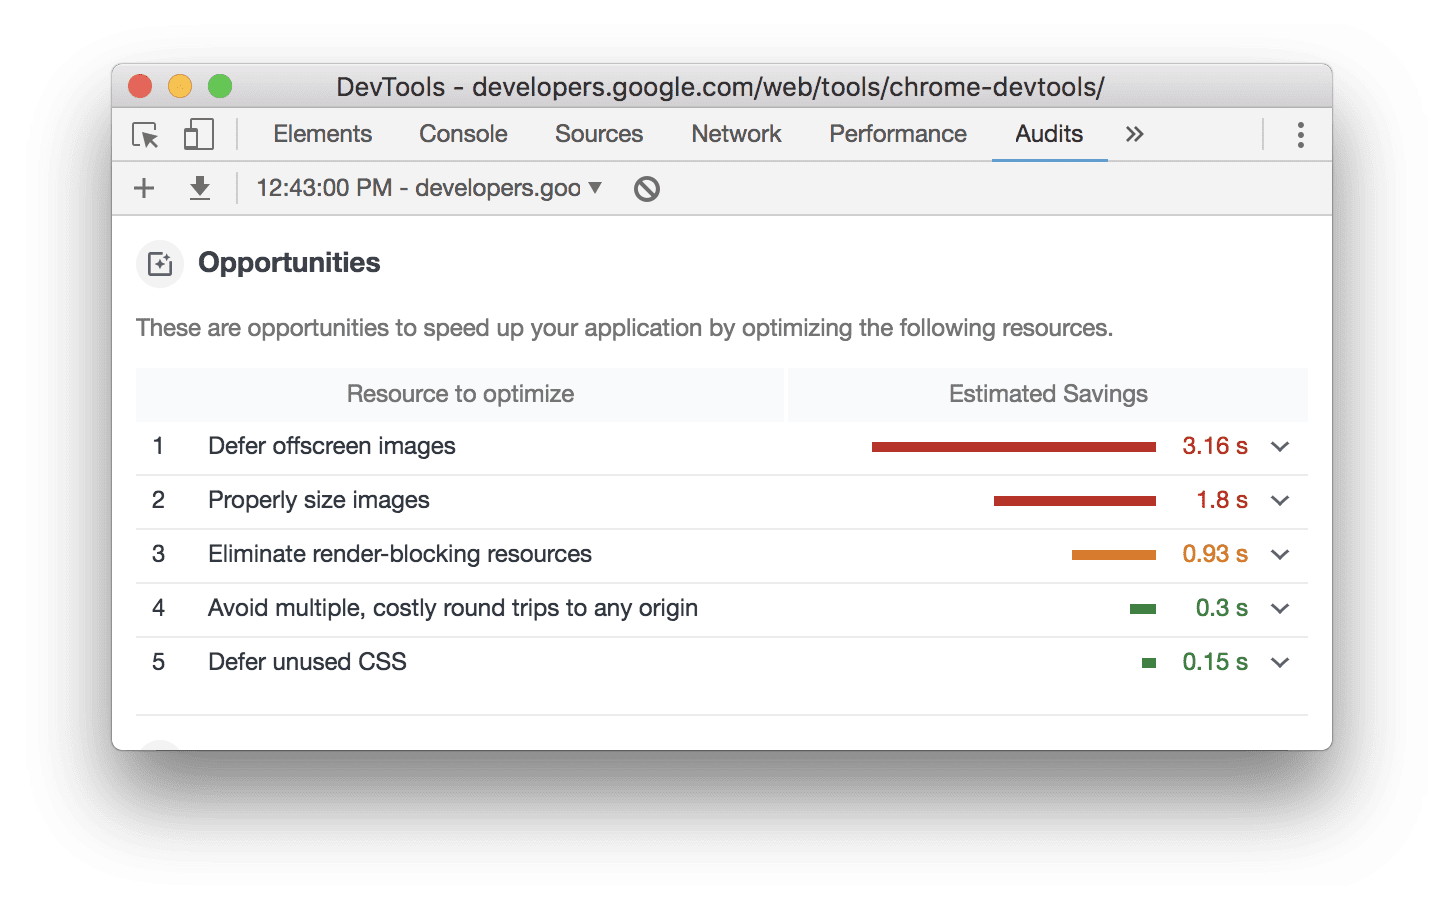
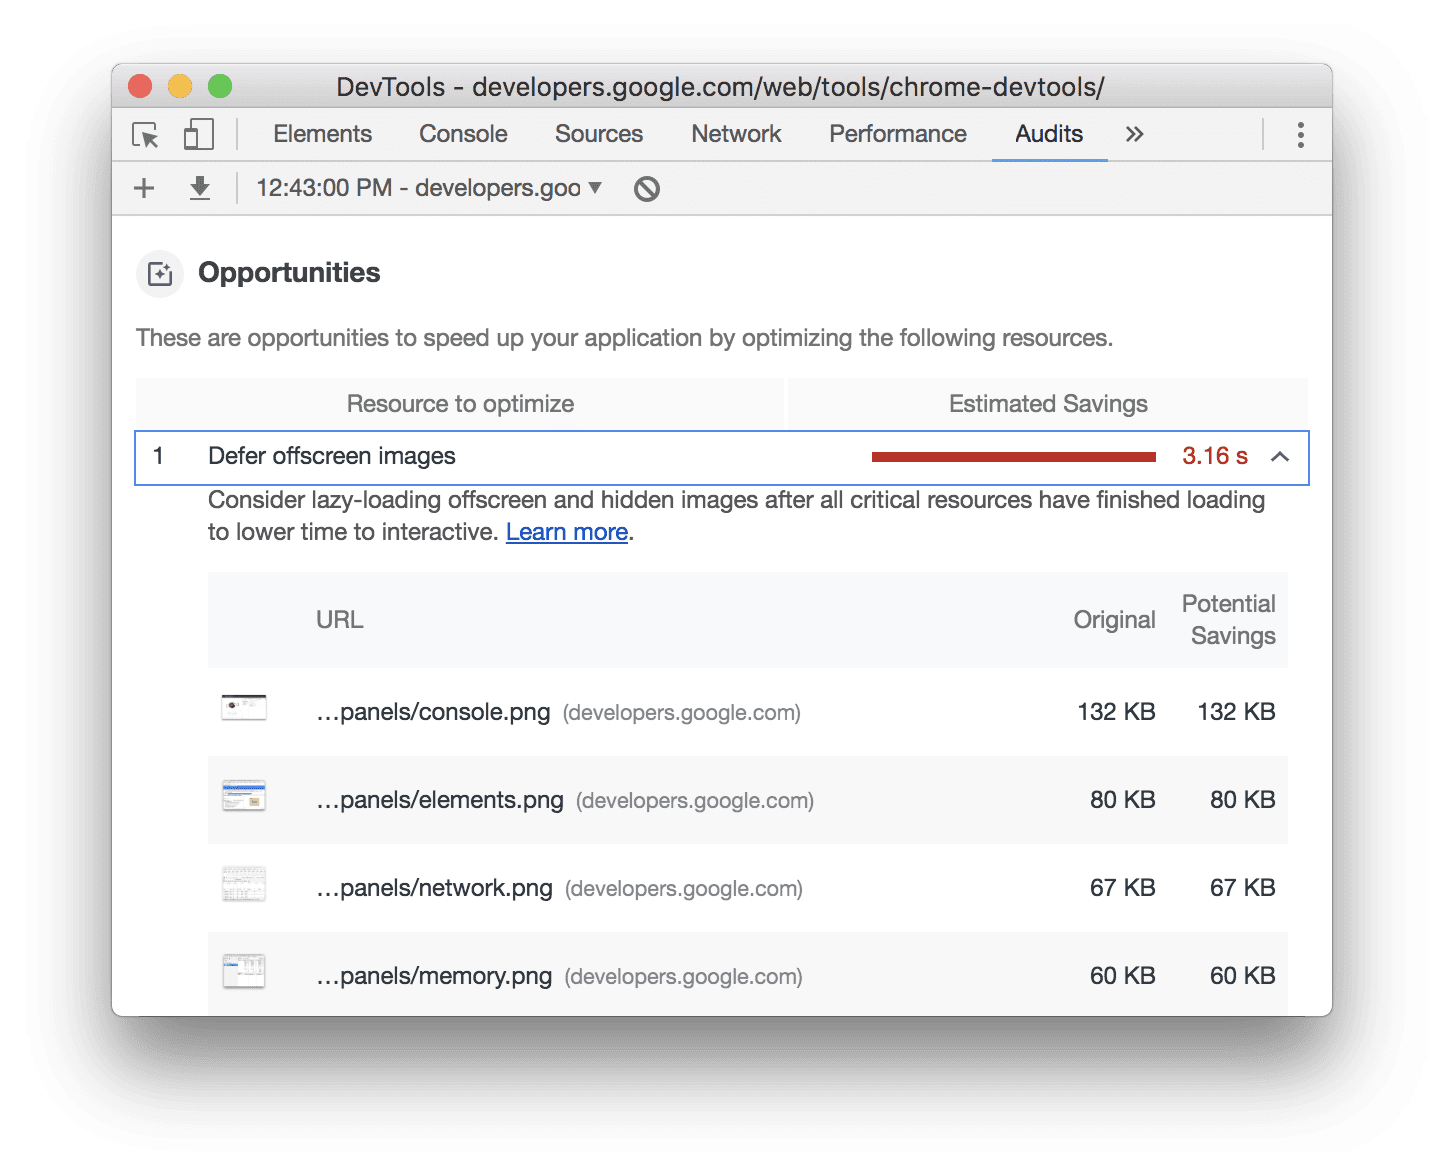
Click an opportunity to learn more about it.
Next steps
Try using Lighthouse to audit your page, either from your profile page or from Chrome DevTools. Implement one of the opportunities, and then audit your page again to see how the change affected your report. Your metrics scores should ideally be a little better, and Lighthouse should no longer be flagging that opportunity as something to work on.
Running Lighthouse yourself is great for spot-checking issues, but ultimately you'll want to setup continuous monitoring to make sure your site stays healthy. To track your Lighthouse progress over time add your site to the your profile.