

Introduction
This past spring (2010) I took interest in the rapidly increasing support for HTML5 and related technologies. At the time, a friend and I had been challenging each other in two-week game development competitions to hone our programming and development skills as well as bring to life the game ideas we were constantly tossing at each other. So, I naturally began incorporating HTML5 elements into my competition entries to gain a better understanding for how they worked and be able to do things that were nearly impossible using earlier HTML specs.
Of the many new features in HTML5, the increasing support for the canvas tag offered me an exciting opportunity to implement interactive art using JavaScript, which led me to try implementing a puzzle game now called Entanglement. I had already created a prototype using the back of Settlers of Catan tiles, so using this as a blueprint of sorts, there are three essential parts to fashioning the hexagonal tile on the HTML5 canvas for web play: drawing the hexagon, drawing the paths, and rotating the tile. The following goes into detail outlining how I accomplished each of these in their current form.
Drawing the Hexagon
In the original version of Entanglement, I used several canvas draw methods
to draw the hexagon, but the current form of the game uses drawImage() to
draw textures clipped from a sprite sheet.
I combined the images together into a single file so it's only one request to the server instead of, in this case, ten. To draw a chosen hexagon to the canvas, we first must gather our tools together: canvas, context, and the image.
To create a canvas, all we need is the canvas tag in our html document like so:
<canvas id="myCanvas"></canvas>
I give it an id so we can pull it into our script:
var cvs = document.getElementById('myCanvas');
Secondly, we need to grab the 2d context for the canvas so we can begin drawing:
var ctx = cvs.getContext('2d');
Lastly, we need the image. If it's named "tiles.png" in the same folder as our web page, we can get it by:
var img = new Image();
img.src = 'tiles.png';
Now that we have the three components, we can use ctx.drawImage() to draw the single hexagon we want from the sprite sheet to the canvas:
ctx.drawImage(img, sourceX, sourceY, sourceWidth, sourceHeight,
            destinationX, destinationY, destinationWidth, destinationHeight);
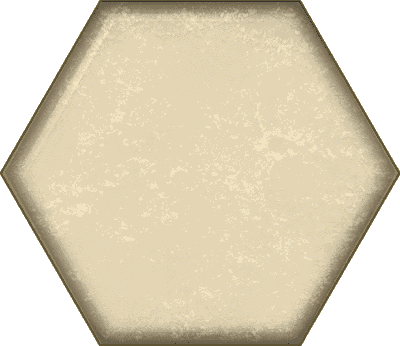
In this case, we're using the fourth hexagon from the left on the top row. Also, we will draw it to the canvas in the top left corner, keeping it the same size as the original. Assuming the hexagons are 400 pixels wide and 346 pixels high, altogether it will look something like this:
var cvs = document.getElementById('myCanvas');
var ctx = cvs.getContext('2d');
var img = new Image();
img.src = 'tiles.png';
var sourceX = 1200;
var sourceY = 0;
var sourceWidth = 400;
var sourceHeight = 346;
var destinationX = 0;
var destinationY = 0;
var destinationWidth = 400;
var destinationHeight = 346;
ctx.drawImage(img, sourceX, sourceY, sourceWidth, sourceHeight,
            destinationX, destinationY, destinationWidth, destinationHeight);
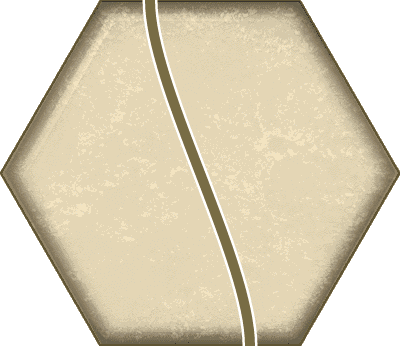
We have successfully copied part of the image to the canvas with this as the result:
Drawing Paths
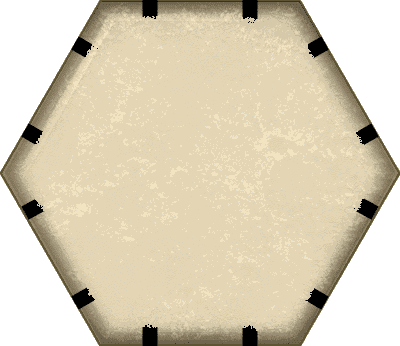
Now that we have our hexagon drawn to the canvas, we want to draw a few lines on it. First, we will look at some geometry regarding the hexagon tile. We want two line ends per side with each ending 1/4 from the ends along the each edge and 1/2 of the edge apart from one another, like so:
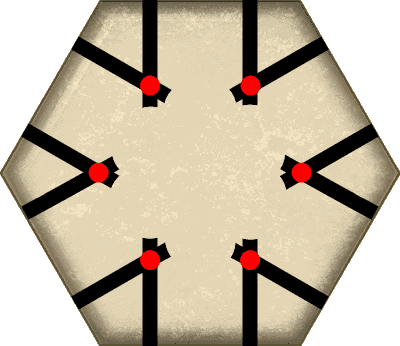
We also want a nice curve, so, using a little trial and error, I found that, if I make a perpendicular line from the edge at each endpoint, the intersection from each pair of endpoints around a given angle of the hexagon makes a nice bezier control point for the given endpoints:
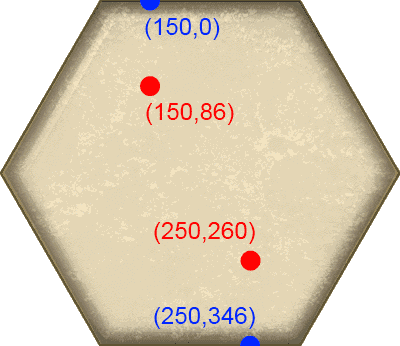
Now, we map both the endpoints and the control points to a Cartesian plane corresponding with our canvas image and we're ready to get back to the code. To keep it simple, we will start with one line. We will begin by drawing a path from the top left endpoint to the bottom right endpoint. With our earlier hexagon image being 400x346, that will make our top endpoint 150 pixels across and 0 pixels down, shorthand (150, 0). It's control point will be (150, 86). The bottom edge endpoint is (250, 346) with a control point of (250, 260):
With our coordinates in hand, we are now prepared to begin drawing. We will start fresh with ctx.beginPath() and then move to the first endpoint using:
ctx.moveTo(pointX1,pointY1);
We can then draw the line itself using ctx.bezierCurveTo() as follows:
ctx.bezierCurveTo(controlX1, controlY1, controlX2, controlY2, pointX2, pointY2);
Since we want the line to have a nice border, we will stroke this path twice using a different width and color each time. Color will be set using the ctx.strokeStyle property and width will be set using ctx.lineWidth. Altogether, drawing the first line will look like this:
var pointX1 = 150;
var pointY1 = 0;
var controlX1 = 150;
var controlY1 = 86;
var controlX2 = 250;
var controlY2 = 260;
var pointX2 = 250;
var pointY2 = 346;
ctx.beginPath();
ctx.moveTo(pointX1, pointY1);
ctx.bezierCurveTo(controlX1, controlY1, controlX2, controlY2, pointX2, pointY2);
ctx.lineWidth = 15;
ctx.strokeStyle = '#ffffff';
ctx.stroke();
ctx.lineWidth = 10;
ctx.strokeStyle = '#786c44';
ctx.stroke();
We now have a hexagonal tile with the first line meandering across:
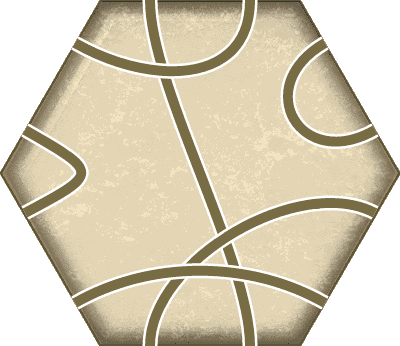
Entering coordinates for the other 10 endpoints as well as the corresponding bezier curve control points, we can repeat the steps above and might create a tile something like this:
Rotating the Canvas
Once we have our tile, we want to be able to turn it so different paths can
be taken in the game. To accomplish this using canvas, we use ctx.translate()
and ctx.rotate(). We want the tile to rotate about its center, so our first
step is to move the canvas reference point to the center of the hexagonal tile.
To do this we use:
ctx.translate(originX, originY);
Where originX will be half of the hexagonal tile's width and originY will be half of the height, giving us:
var originX = 200;
var originY = 173;
ctx.translate(originX, originY);
Now we are able to rotate the tile with our new center point. Since a hexagon has six sides, we will want to rotate it by some multiple of Math.PI divided by 3. We will keep it simple and go with a single turn clockwise using:
ctx.rotate(Math.PI / 3);
However, since our hexagon and lines are using the old (0,0) coordinates as the origin, once we are finished rotating, we will want to translate back before drawing. So, altogether we now have:
var originX = 200;
var originY = 173;
ctx.translate(originX, originY);
ctx.rotate(Math.PI / 3);
ctx.translate(-originX, -originY);
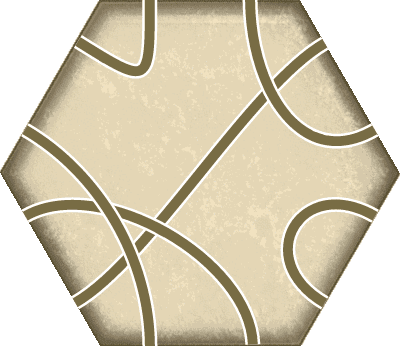
Putting the above translation and rotation before our rendering code causes it to now render the rotated tile:
Summary
Above I have highlighted a few of the capabilities that HTML5 has to offer using the canvas tag, including rendering images, drawing bezier curves, and rotating the canvas. Using the HTML5 canvas tag and its JavaScript drawing tools for Entanglement proved to be an enjoyable experience, and I look forward to the many new applications and games that others create with this open and emerging technology.
Code Reference
All code examples provided above are combined below as a reference:
var cvs = document.getElementById('myCanvas');
var ctx = cvs.getContext('2d');
var img = new Image();
img.src = 'tiles.png';

var originX = 200;
var originY = 173;
ctx.translate(originX, originY);
ctx.rotate(Math.PI / 3);
ctx.translate(-originX, -originY);

var sourceX = 1200;
var sourceY = 0;
var sourceWidth = 400;
var sourceHeight = 346;
var destinationX = 0;
var destinationY = 0;
var destinationWidth = 400;
var destinationHeight = 346;
ctx.drawImage(img, sourceX, sourceY, sourceWidth, sourceHeight,
            destinationX, destinationY, destinationWidth, destinationHeight);

ctx.beginPath();
var pointX1 = 150;
var pointY1 = 0;
var controlX1 = 150;
var controlY1 = 86;
var controlX2 = 250;
var controlY2 = 260;
var pointX2 = 250;
var pointY2 = 346;
ctx.moveTo(pointX1, pointY1);
ctx.bezierCurveTo(controlX1, controlY1, controlX2, controlY2, pointX2, pointY2);
ctx.lineWidth = 15;
ctx.strokeStyle = '#ffffff';
ctx.stroke();
ctx.lineWidth = 10;
ctx.strokeStyle = '#786c44';
ctx.stroke();

ctx.beginPath();
pointX1 = 250;
pointY1 = 0;
controlX1 = 250;
controlY1 = 86;
controlX2 = 150;
controlY2 = 86;
pointX2 = 75;
pointY2 = 43;
ctx.moveTo(pointX1, pointY1);
ctx.bezierCurveTo(controlX1, controlY1, controlX2, controlY2, pointX2, pointY2);
ctx.lineWidth = 15;
ctx.strokeStyle = '#ffffff';
ctx.stroke();
ctx.lineWidth = 10;
ctx.strokeStyle = '#786c44';
ctx.stroke();

ctx.beginPath();
pointX1 = 150;
pointY1 = 346;
controlX1 = 150;
controlY1 = 260;
controlX2 = 300;
controlY2 = 173;
pointX2 = 375;
pointY2 = 213;
ctx.moveTo(pointX1, pointY1);
ctx.bezierCurveTo(controlX1, controlY1, controlX2, controlY2, pointX2, pointY2);
ctx.lineWidth = 15;
ctx.strokeStyle = '#ffffff';
ctx.stroke();
ctx.lineWidth = 10;
ctx.strokeStyle = '#786c44';
ctx.stroke();

ctx.beginPath();
pointX1 = 325;
pointY1 = 43;
controlX1 = 250;
controlY1 = 86;
controlX2 = 300;
controlY2 = 173;
pointX2 = 375;
pointY2 = 130;
ctx.moveTo(pointX1, pointY1);
ctx.bezierCurveTo(controlX1, controlY1, controlX2, controlY2, pointX2, pointY2);
ctx.lineWidth = 15;
ctx.strokeStyle = '#ffffff';
ctx.stroke();
ctx.lineWidth = 10;
ctx.strokeStyle = '#786c44';
ctx.stroke();

ctx.beginPath();
pointX1 = 25;
pointY1 = 130;
controlX1 = 100;
controlY1 = 173;
controlX2 = 100;
controlY2 = 173;
pointX2 = 25;
pointY2 = 213;
ctx.moveTo(pointX1, pointY1);
ctx.bezierCurveTo(controlX1, controlY1, controlX2, controlY2, pointX2, pointY2);
ctx.lineWidth = 15;
ctx.strokeStyle = '#ffffff';
ctx.stroke();
ctx.lineWidth = 10;
ctx.strokeStyle = '#786c44';
ctx.stroke();

ctx.beginPath();
pointX1 = 325;
pointY1 = 303;
controlX1 = 250;
controlY1 = 260;
controlX2 = 150;
controlY2 = 260;
pointX2 = 75;
pointY2 = 303;
ctx.moveTo(pointX1, pointY1);
ctx.bezierCurveTo(controlX1, controlY1, controlX2, controlY2, pointX2, pointY2);
ctx.lineWidth = 15;
ctx.strokeStyle = '#ffffff';
ctx.stroke();
ctx.lineWidth = 10;
ctx.strokeStyle = '#786c44';
ctx.stroke();