How to debug SEO issues on individual pages or across an entire site.
Google provides a lot of tools to help you debug JavaScript SEO issues in Google Search. This guide gives you an overview of the available tools and suggestions on when to use each tool.
Find basic SEO issues with Lighthouse
Use Lighthouse for your first investigation. It comes with a bunch of SEO audits.

The Lighthouse SEO audits are very basic first checks for a single page of your website. They catch
the most common mistakes and give you a first impression on how your website is doing in terms of
search engine discoverability. Note that Lighthouse runs in your browser, which is not an accurate
representation of how Googlebot might see a web page. For instance, browsers (and Lighthouse) don't
use robots.txt to decide if they can fetch resources from the network, while Googlebot does. So when
Lighthouse identifies potential problems, you should fix them, but you may have to use other tools
to debug issues further.
Validate pages with Google Search testing tools
Google Search provides
a set of tools for testing how Googlebot sees your web content.
Some of these tools are particularly useful when testing from your development environment:
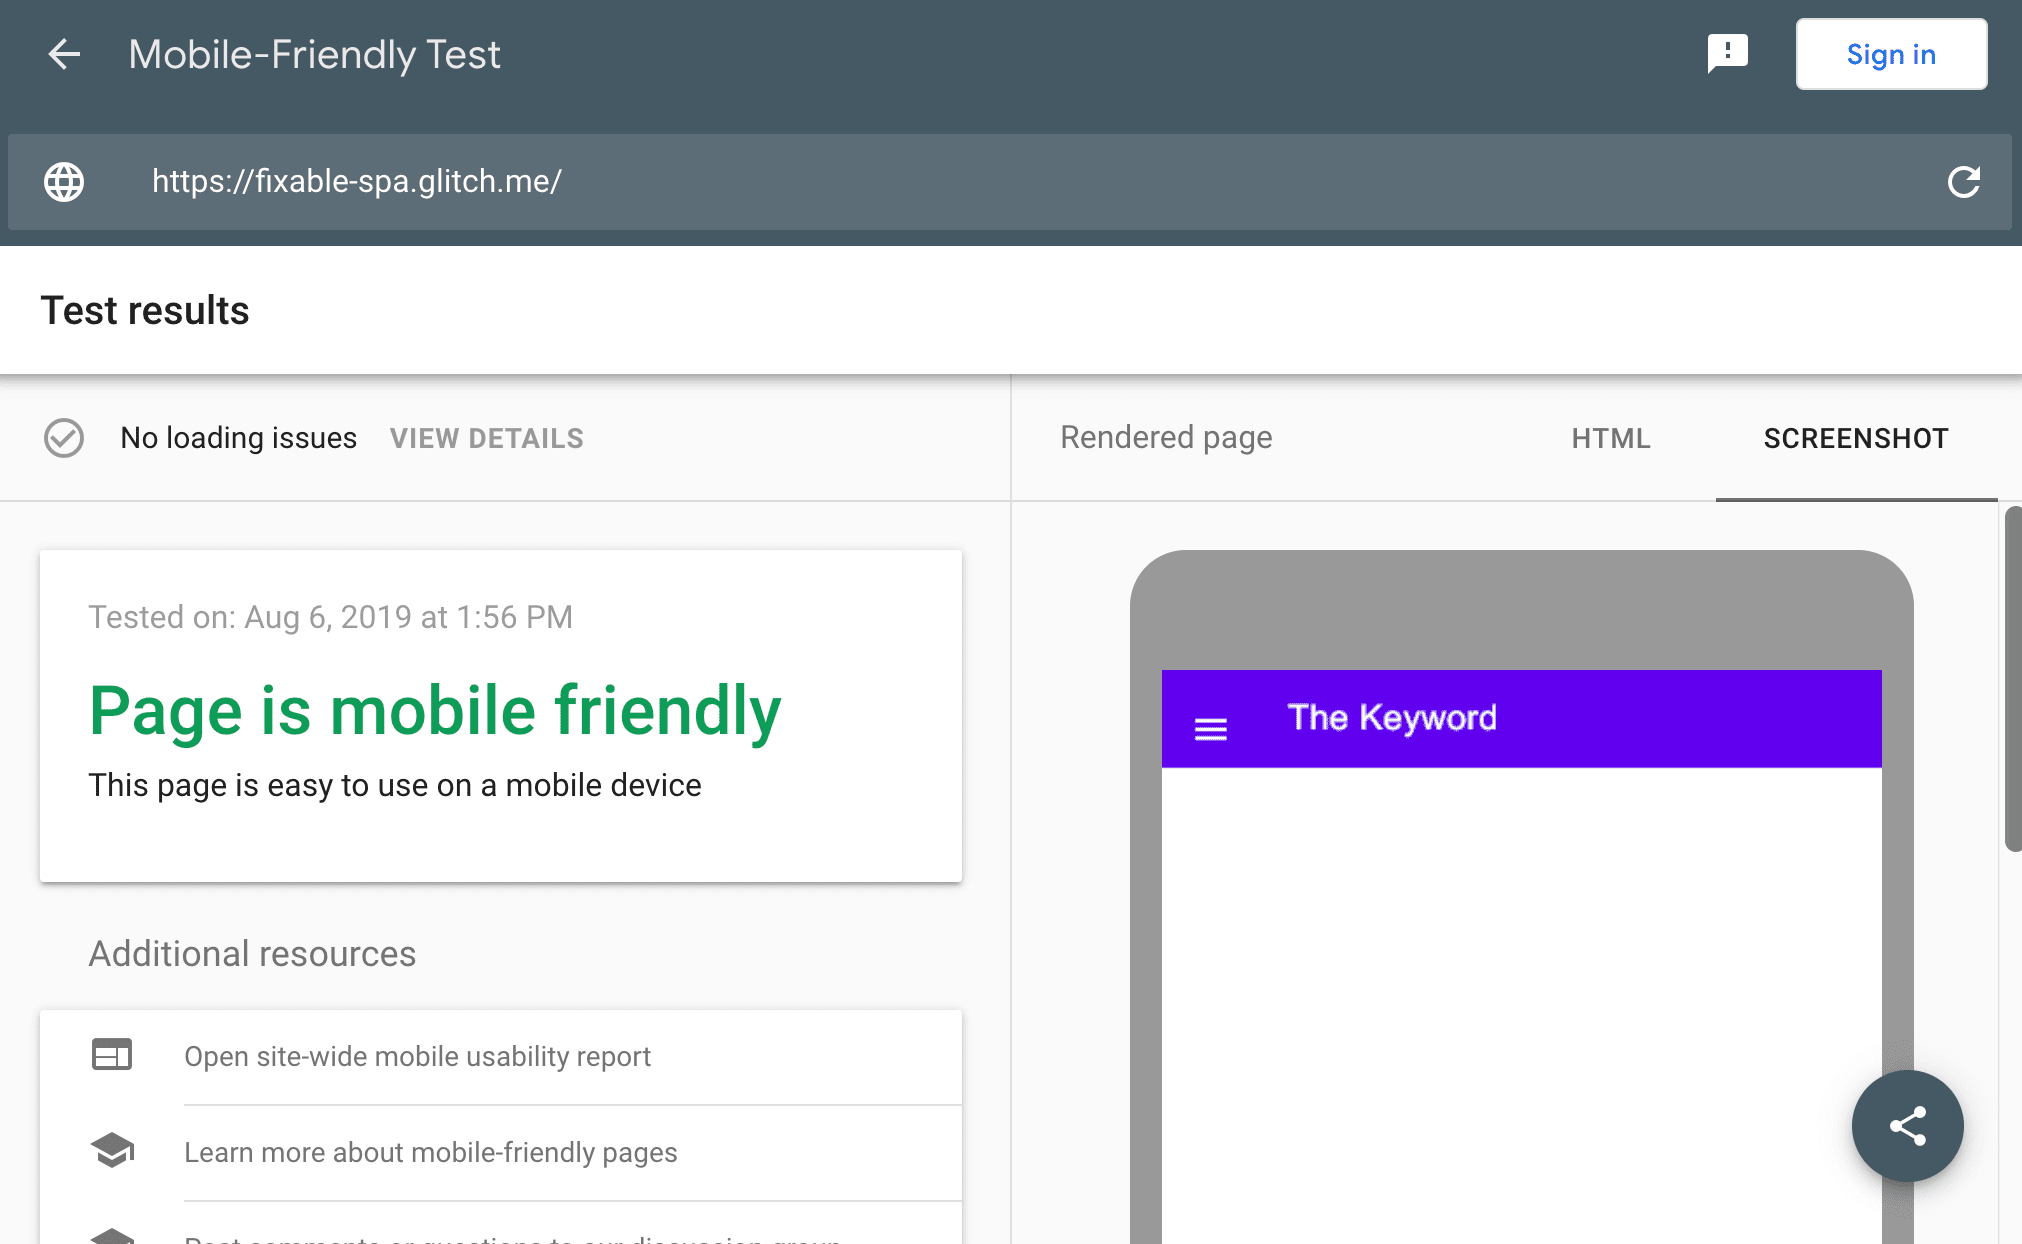
- The Mobile-Friendly Test ensures that a page is mobile-friendly, which has been a Google Search ranking signal since 2015
- The Rich Results Test validates that a page is eligible for rich results based on the structured data that it provides
- The AMP Test validates your AMP HTML
In combination with tools like local-tunnel or ngrok you can create a temporary public URL from your local development environment and iterate quickly while you are testing with Google's testing tools.
These testing tools provide you with multiple helpful pieces of information, like:
- The rendered HTML that Googlebot will use for indexing
- An overview of the resources loaded and explanations of why resources can't be loaded
- Console log messages and JavaScript errors with stack traces

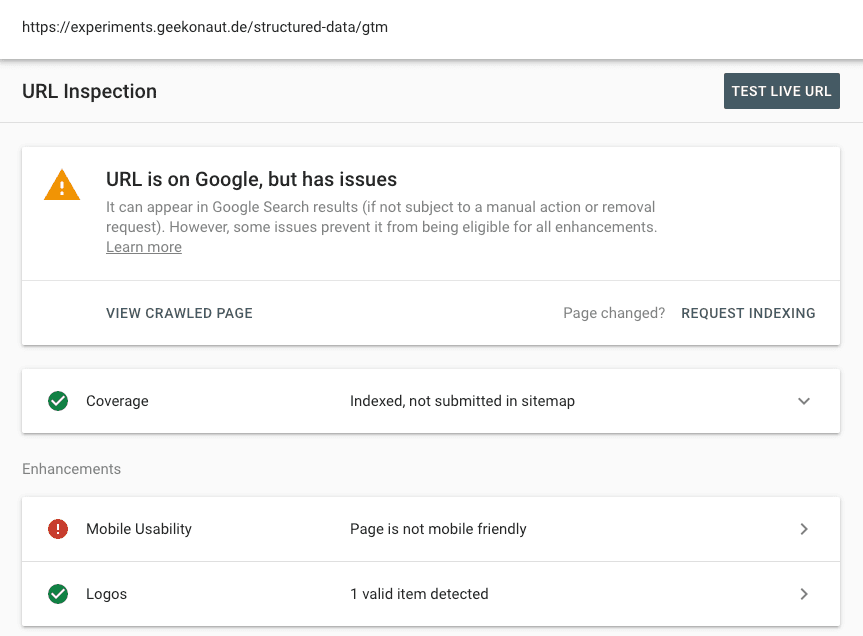
The Google Search Console URL Inspection Tool can also give you detailed information about the status of a page.

Here you can find out:
- If the URL is in the Google Search index or can be indexed in the future
- What the rendered HTML from the most recent crawl looks like
- What the rendered HTML looks like for a fresh crawl of the page
- Information about page resources
- JavaScript log messages and errors with stack traces
- A screenshot
- Mobile usability issues
- What structured data was detected on the page and if it's valid
Using these tools you can identify most issues and resolve them. Google Search also provides documentation for fixing Google Search-related JavaScript problems for more guidance on what to do once you identified the cause of a problem.
Investigate site health with Google Search Console
The tools from the last section are great at resolving specific issues on a single page of your website, but if you want to get a better overview of your entire website, the Google Search Console is where you need to go.
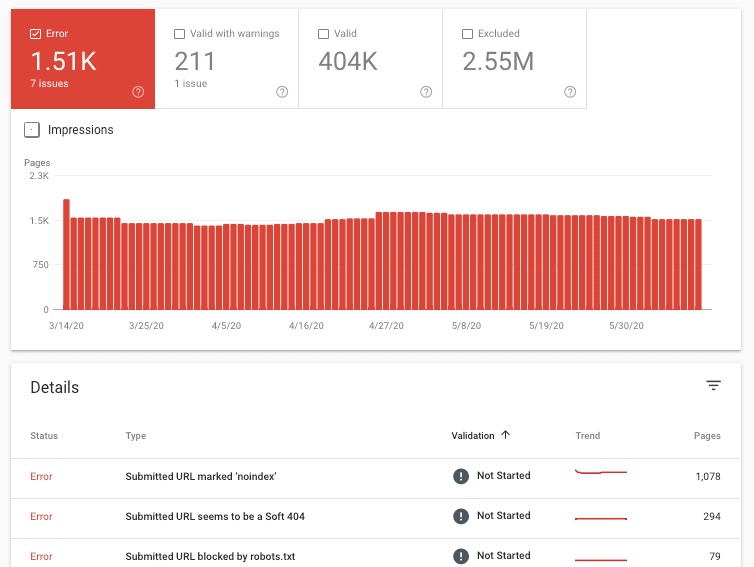
Coverage report
The Coverage report shows you which pages of your website are indexed and which ones have problems.

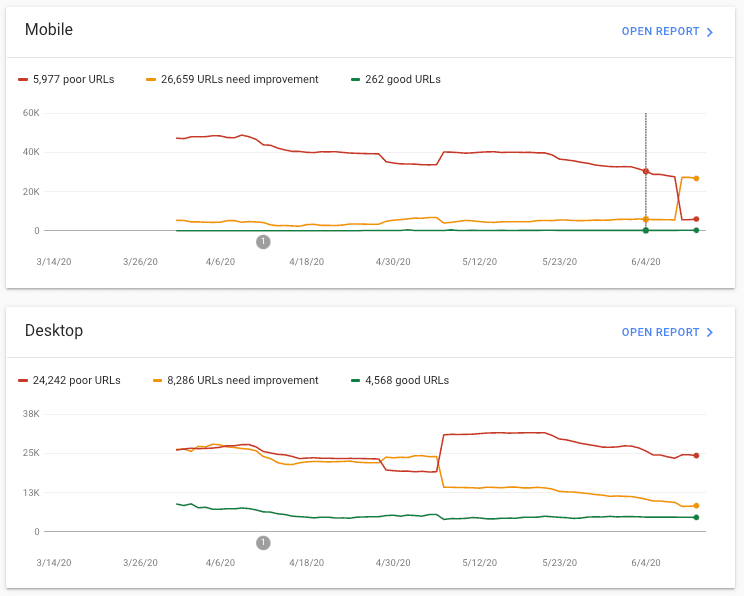
Core Web Vitals report
The Core Web Vitals report helps you get an overview of how the pages of your website are performing in terms of the Core Web Vitals.

Make these tools part of your developer tooling
In this article, we've seen a series of tools for various purposes from testing a page before publishing it to monitoring the pages on a live website that give you transparency on how your website does in terms of discoverability for Google Search. Some of these tools might become useful parts of your development toolkit, others might be more like ad-hoc tools to identify the cause of a problem and fix affected pages. To learn more about Google Search for developers or JavaScript SEO, check out the official Search for developers documentation.

