
All the tools available for web development are also helpful for progressive web app development, including libraries, frameworks, code editors, builders, developer tools, debuggers, and more. But when working with PWA-specific abilities, such as installability, service workers, offline support, and more, certain tools for PWA are extra helpful. Let's see them in action.
Simulators and devices
As mentioned in the Foundations chapter, you should use agnostic design patterns to offer the best experience to every user in every context. However, it's good practice to test your experiences on different devices.
You probably won't own dozens of physical devices, including iPhones, Android phones, tablets, and desktops or laptops with different operating systems. That's why simulators and emulators exist.
Simple simulators
Most developer tools within browsers let you test your PWAs in different screen sizes or network conditions while using a single desktop browser engine. Some of these tools can also force a different user agent under these simulations.
Some available simulators are:
- Chromium DevTools: Device Mode, network throttling and several sensor simulations available
- Firefox Developer Tools: Responsive Design Mode
- Safari Web Inspector: Responsive Design Mode


 Some commercial and free solutions are optimized for developers and designers, such as the open source Responsively app.
Apple simulators
Apple offers the Simulator app (formerly known as iOS Simulator) which allows you to test your web app on different iPhones and iPads on various operating system versions.
The Simulator app is only available for macOS computers, and it comes with [Xcode, available in AppStore; it simulates iOS and iPadOS with different device configurations. It includes the real Mobile Safari app and the Web.app engine used when your PWA is installed on the home screen, so the final experience you see is fairly representative of an actual device.
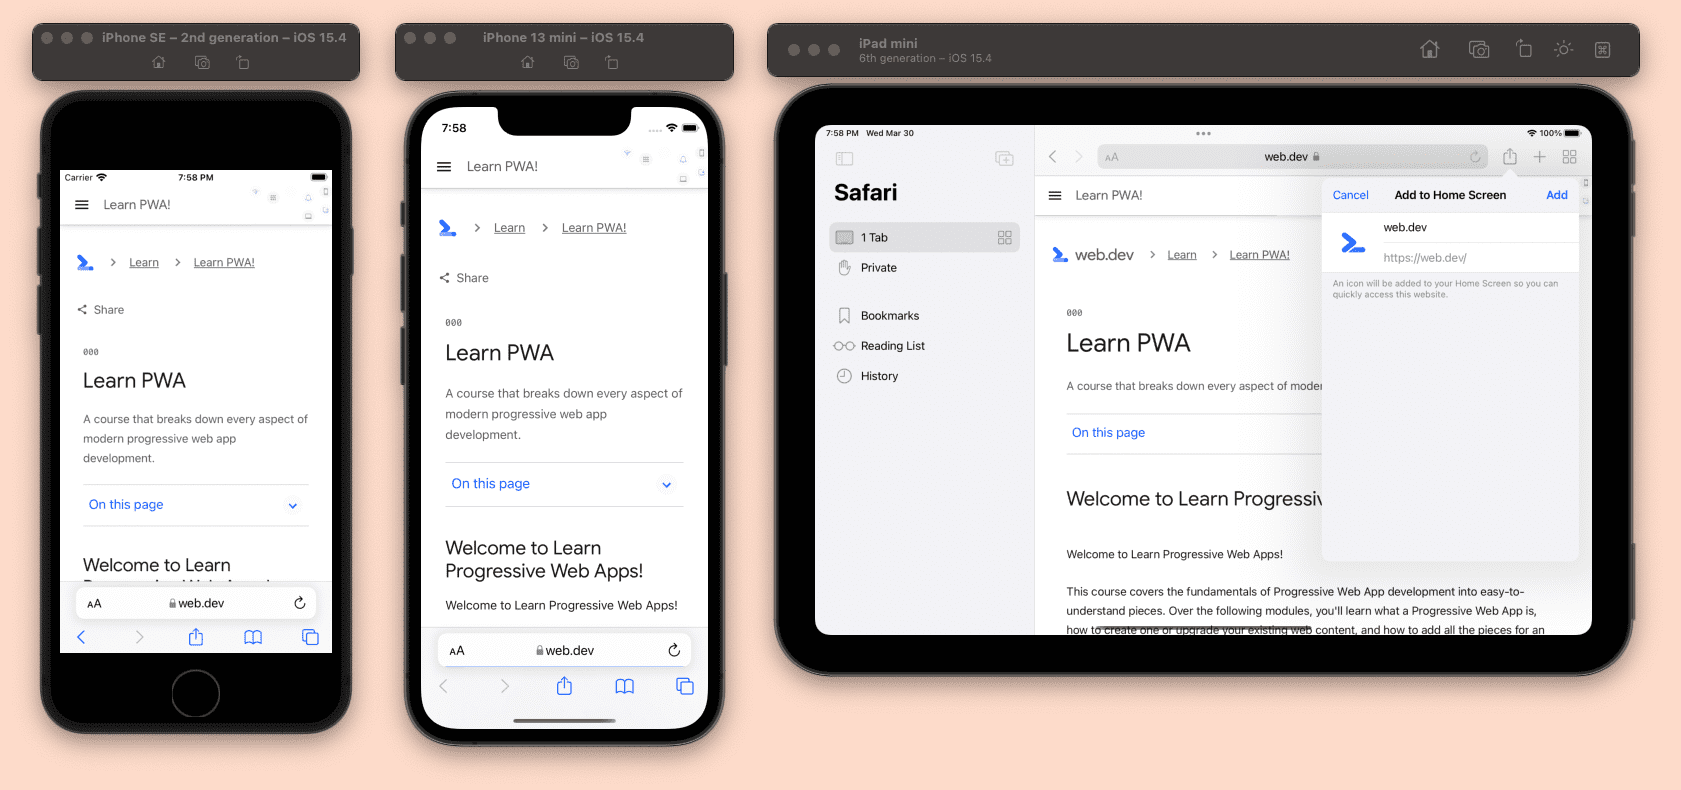
To launch the app, once you have installed Xcode, you can open the Simulator in the Xcode menu, by selecting Open Developer Tools then Simulator. Once in the simulator, you can open Safari as if you are in a real iPhone or iPad. You can open other devices by selecting File then Open Simulator menu.
Some useful shortcuts for web developers while using Simulator to test PWAs are:
Command-Shift-H: go to the Home screen.Control-Command-Shift-H: access the App Switcher.Command-RightandCommand-Left: rotate the device.
Simulator is not a virtual machine, but an app running on top of your macOS that looks like an iPhone or iPad, so it doesn't have its own TCP stack. Therefore, if you use localhost within Simulator, Safari will point to your macOS localhost device.
By default, Xcode only installs the latest version of iOS, but you can go to Xcode, use the Preferences menu, and download older Simulators from the Components tab.
It's good practice to test your PWA on the latest version of iOS, the previous minor version, and at least one previous major version.
Android emulators
The Android ecosystem offers different emulators, but the ones available within the Android SDK are the most commonly used.
As a PWA developer, you also need browsers in your Android emulator, which will add a layer of complexity to testing, because AOSP (Android Open Source Project) doesn't include Google Chrome or Play Store to download browsers. Therefore, not every Android emulator is helpful for PWA testing.
The Android SDK comes with two tools useful for emulation:
- SDK Manager: downloads and updates different operating system versions and plugins.
- AVD Manager: adds, edits, and deletes Android Virtual Devices (AVDs), each of them representing one device with one Android OS installed, similar to a virtual machine instance.
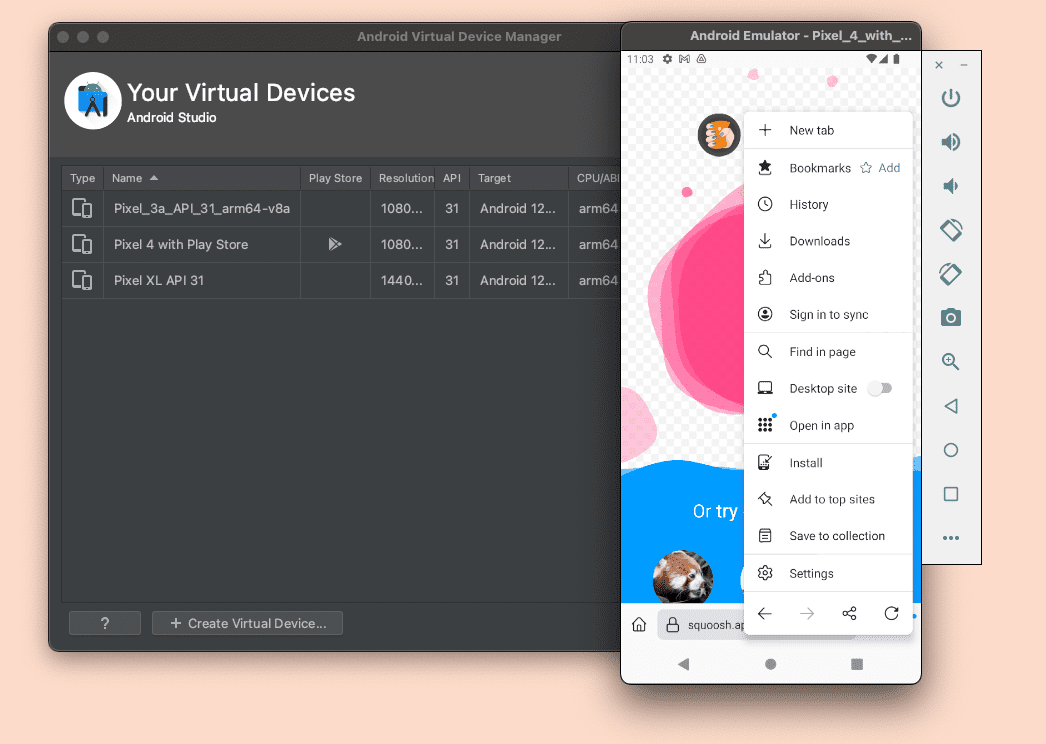
You can only install the Android SDK or Android Studio, a free IDE including the Android SDK with the emulators. With the SDK, you will have to use the command line to open and set up your emulators. With Android Studio, you can open the tools needed from the Welcome screen's menu. Once in the AVD Manager, you can create as many devices as you want, with different combinations of screen size, abilities, and Android OS version.
With an Android emulator, you can check your PWA installation support, the entire user experience, and if the abilities you are using are working as expected.
Using Google Chrome
To use Google Chrome in the Android emulator, you have to create an AVD with Play Services inside. To do that, make sure the SDK you use for your AVD has the Play icon, as you can see in the following image:
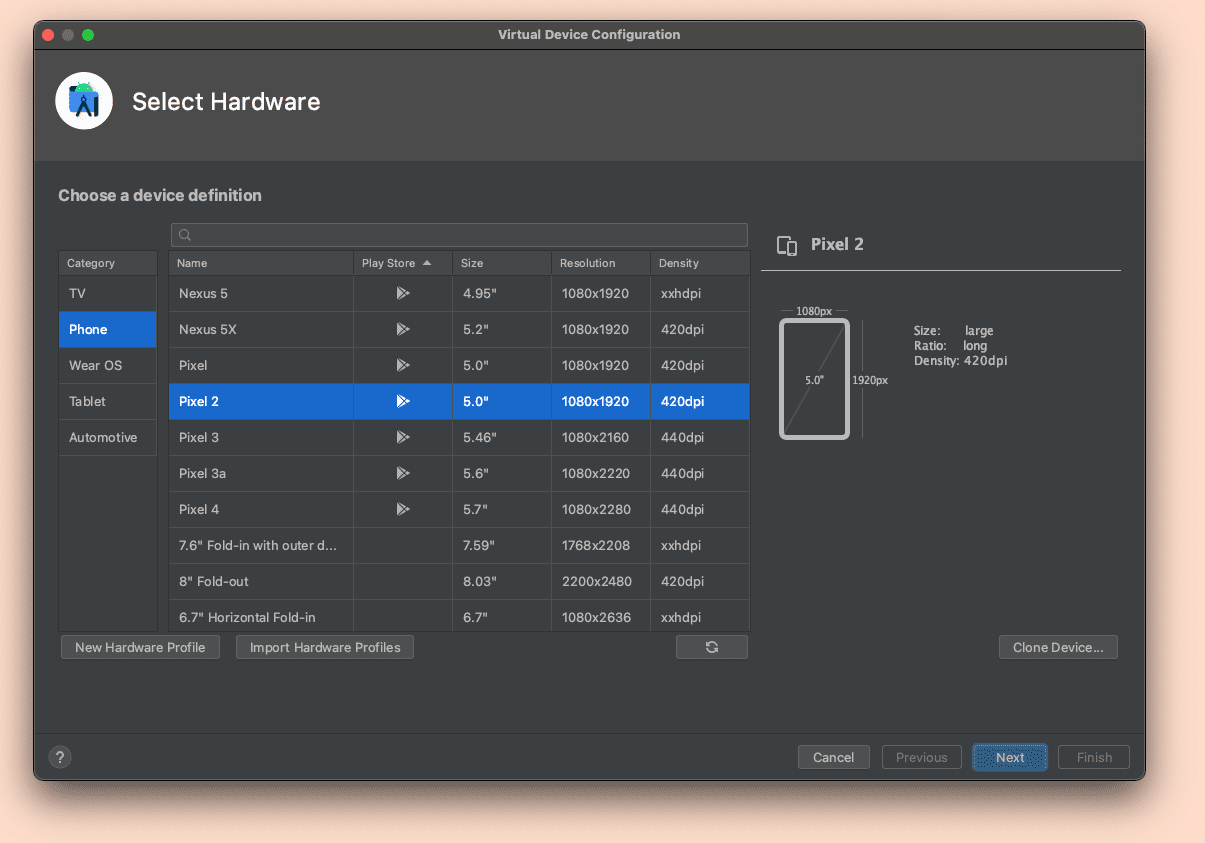
AVDs with Play services also include Play Store, so you can update your Chrome with the latest version after setting up your account with your Google account.
Using other browsers
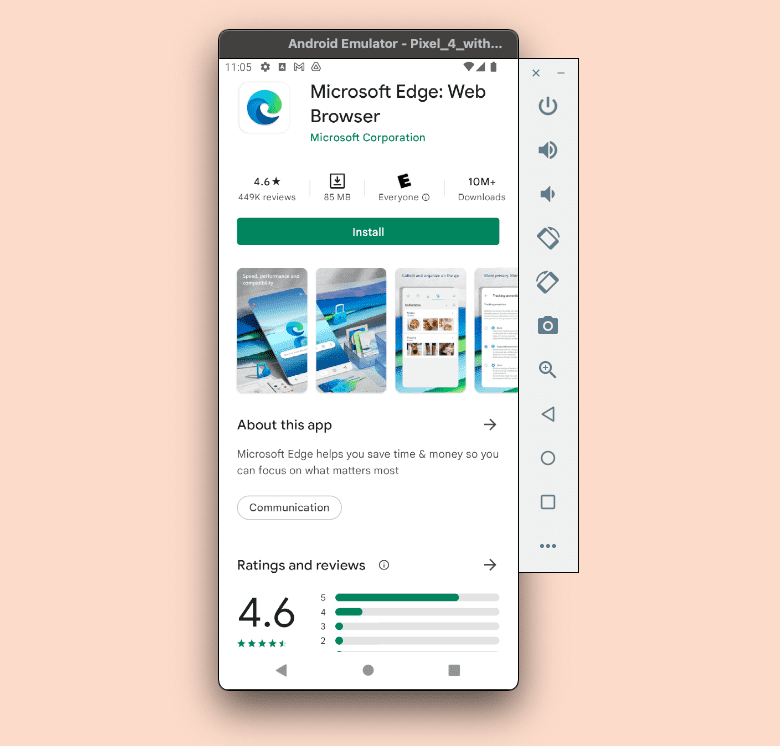
If you use an AVD with Play services, you can also download browsers from the Play Store.
Most of the browsers available for Android, including Samsung Internet, Microsoft Edge, Opera, Firefox, and Brave, are available as APKs (Android Packages). If you have the APK for the browser you want to test, you can just drag the file to the emulator or install it through the command-line using ADB.
Desktop emulators
Emulating a different desktop computer is typically done via a virtual machine system, such as VirtualBox or VMWare. Even with these tools, emulating some environments is impossible, such as emulating macOS on Windows or Linux, and some other options may require a license, such as emulating Windows on macOS or Windows.
Using physical devices
Using actual devices to test your PWA is also a good idea. We don't need to own several devices as there are some cloud-based solutions where you can use physical devices remotely. There are some free solutions and some commercial solutions with a free-tier available.
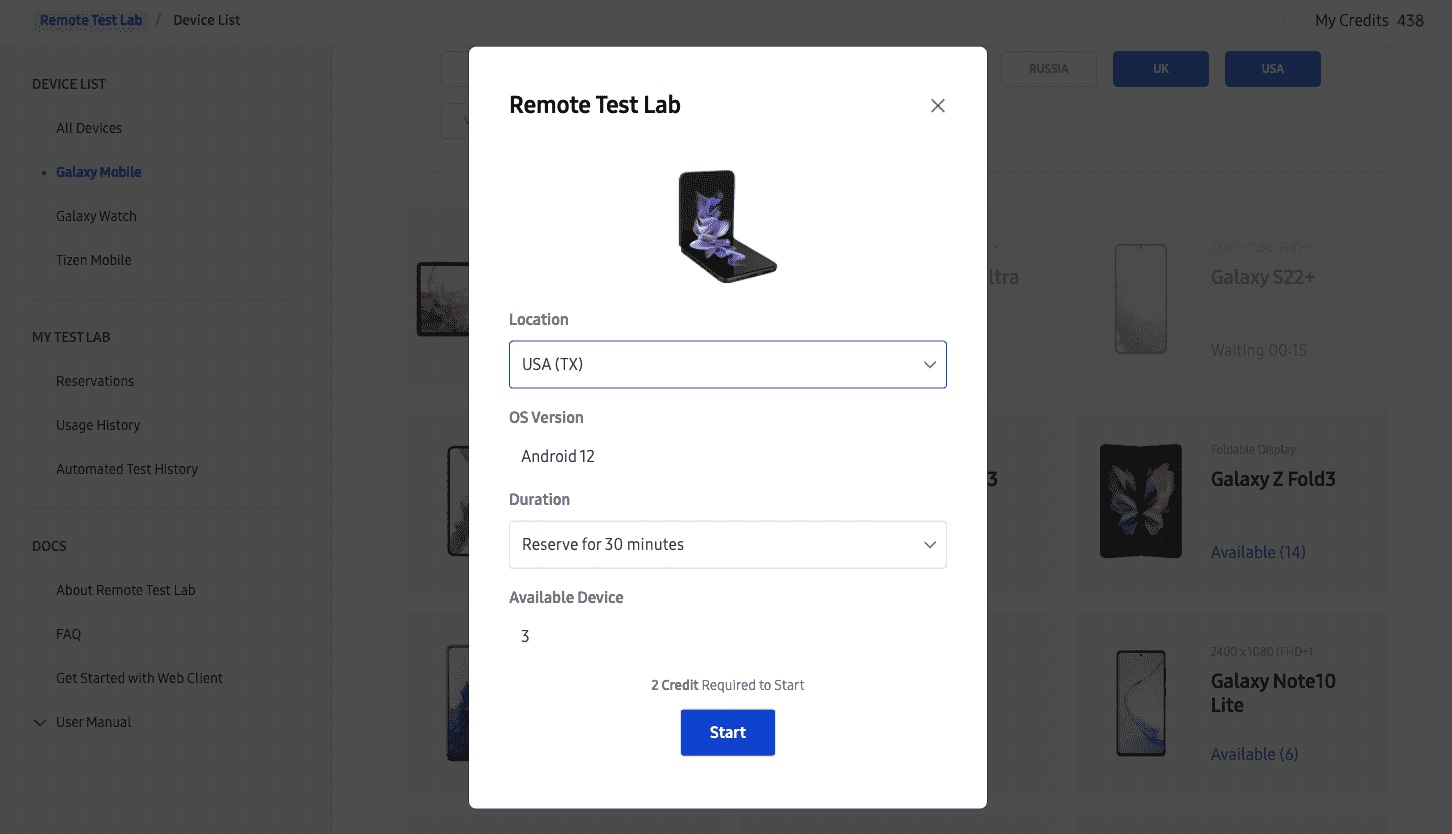
One of the available solutions is Samsung Remote Test Lab, a free solution to test your PWA on Samsung devices, including phones, tablets, and foldable devices.
Remote inspection
When you want to debug your Progressive Web App in an actual device, a simulator, or an emulator, you may want to connect a remote inspection session with your desktop's browser tools.
There are commercial tools available, but all the browsers also offer ways to do it, including:
- WebKit Remote Inspector to connect to Safari and installed PWAs on iOS- and iPadOS-connected devices and simulators.
- Chromium DevTools Remote Debugging to connect to Chrome, Edge, Samsung Internet, and other Chromium-based browsers on Android and PWAs installed from those browsers, including connected physical devices and emulators.
- Firefox Remote Debugging to connect to Firefox for Android on connected actual devices and emulators.
Port forwarding for Android
When testing PWAs available on localhost on Android physical devices or emulators, you will have a problem, as localhost will point to the Android TCP stack and not your development machine.
You may want to use your local IP address as a replacement to localhost, but that's not a good idea as service workers and many abilities will only work with HTTPS connections, with the exception of localhost, so your PWA won't work offline or pass PWA criteria.
You can solve the problem by enabling port forwarding on a Chromium browser on your desktop computer. In that case, you can bridge a port on localhost on the Android device to any origin and port from your host computer, including your development computer's localhost. Check this guide for more information.
Chromium browsers
Chromium browsers offer many tools for debugging and testing Progressive Web Apps, starting from DevTools.
Most Chromium-based browsers, including Samsung Internet, Microsoft Edge, and Google Chrome, offer different channels, such as Stable, Beta, and Canary. You can install separate versions on desktop and Android to test your PWA on future versions of the browser. This allows you to build and test features that are not yet widely available, or to test deprecations and changes, and work out how your app will behave in newer versions.
Using remote inspection, you can use all these tools to debug and test your PWA on desktop and Android devices.
Service worker tools
Chromium DevTools has a complete set of tools to debug service workers and their APIs' "Application" tab. From the "Service Workers" section, you can:
- See service workers' installation status and lifecycle.
- Update and unregister the service worker.
- Follow the update cycle.
- See current service workers' clients.
- Send a push message to a service worker.
- Register Background Sync and Periodic Background Sync operations.
Storage tools
Within Application then Storage, you can see, preview, update, and delete data from your origin, such as Web Storage entries or IndexedDB stores.
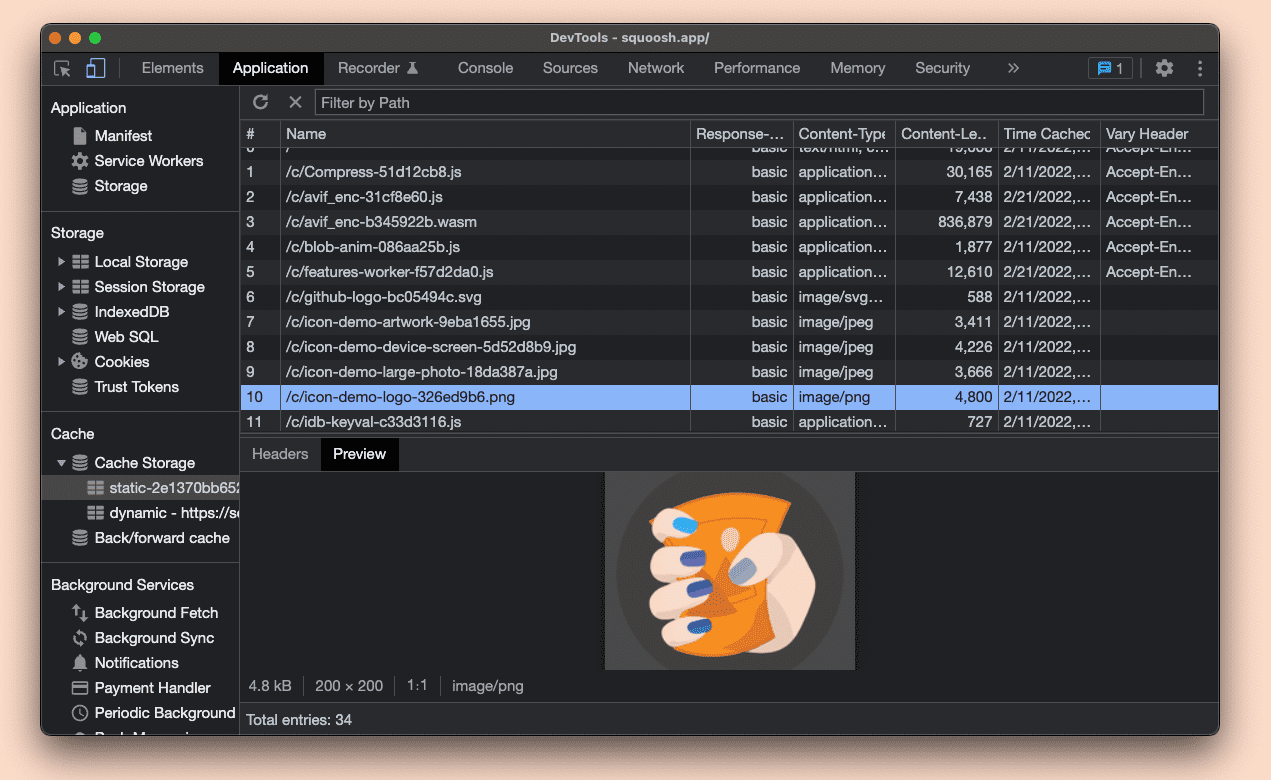
Inside Application, Cache then Cache Storage, you can see all the caches stored in current origin, preview content, and delete entries. Read more about the cache tool.

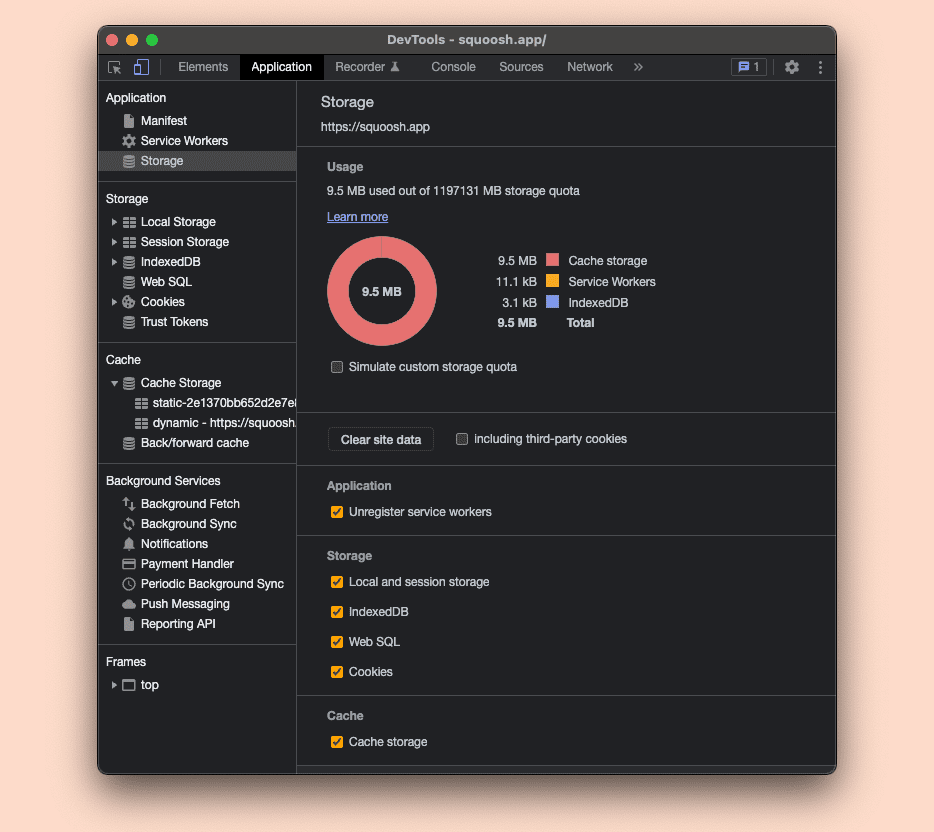
Also, selecting from Application then Storage, you can see the current quota used, simulate custom quota storage, and clear all your data, including the service worker registration, using Clear site data.
Background services
Chromium DevTools also has a set of background services event recording tools, found by clicking Application then Background Services. This lets you see what happens with some events in the background on top of the service workers' API. Read more about these tools.
Web app manifest tools
Chromium DevTools has a section for Web App Manifest and installability criteria under Application, Manifest. In this section, you can check whether the manifest has loaded correctly, the manifest's values, how the icons look, the app id, and a quick checker for maskable icons.
Warnings and errors around installability criteria issues are also shown in this section.
Installation debugging
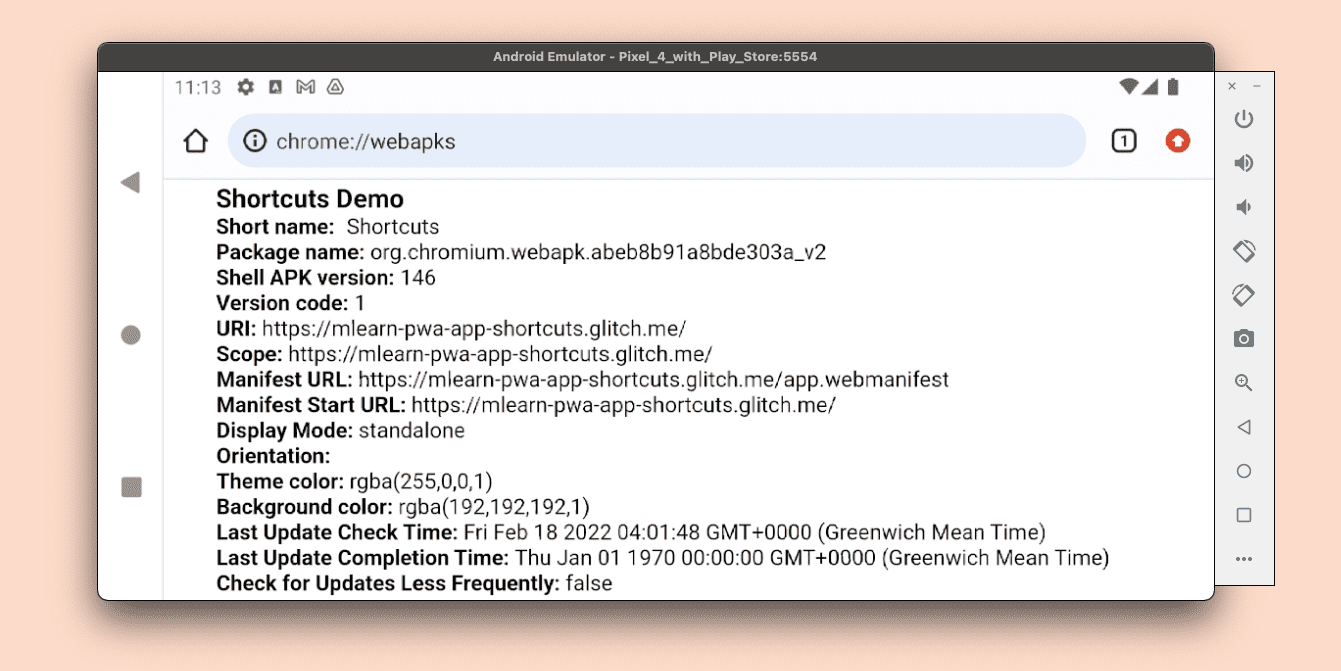
On Android devices using WebAPK installation mode, you can access a list of installed apps by browsing to about:webapk on Chromium browsers.
You will see the current update status and request a WebAPK update from here.
On desktop computers, you can see a user-friendly list of installed PWAs by browsing to about:apps, and a debug version by browsing to about:app-service-internals.
Safari
At the time of writing, Safari has a more limited set of tools available for PWA testing and debugging. There are no tools to see and debug the state and lifecycle of service workers, no inspector for the cache's content, and no tools for web app manifest support and installability on iOS and iPadOS.
Safari is available only on stable, while Safari Technology Preview available for macOS will only let you try abilities of future versions of Safari beforehand. The iOS and iPadOS beta programs sometimes include new versions of Safari that you can use for testing.
Service worker tools
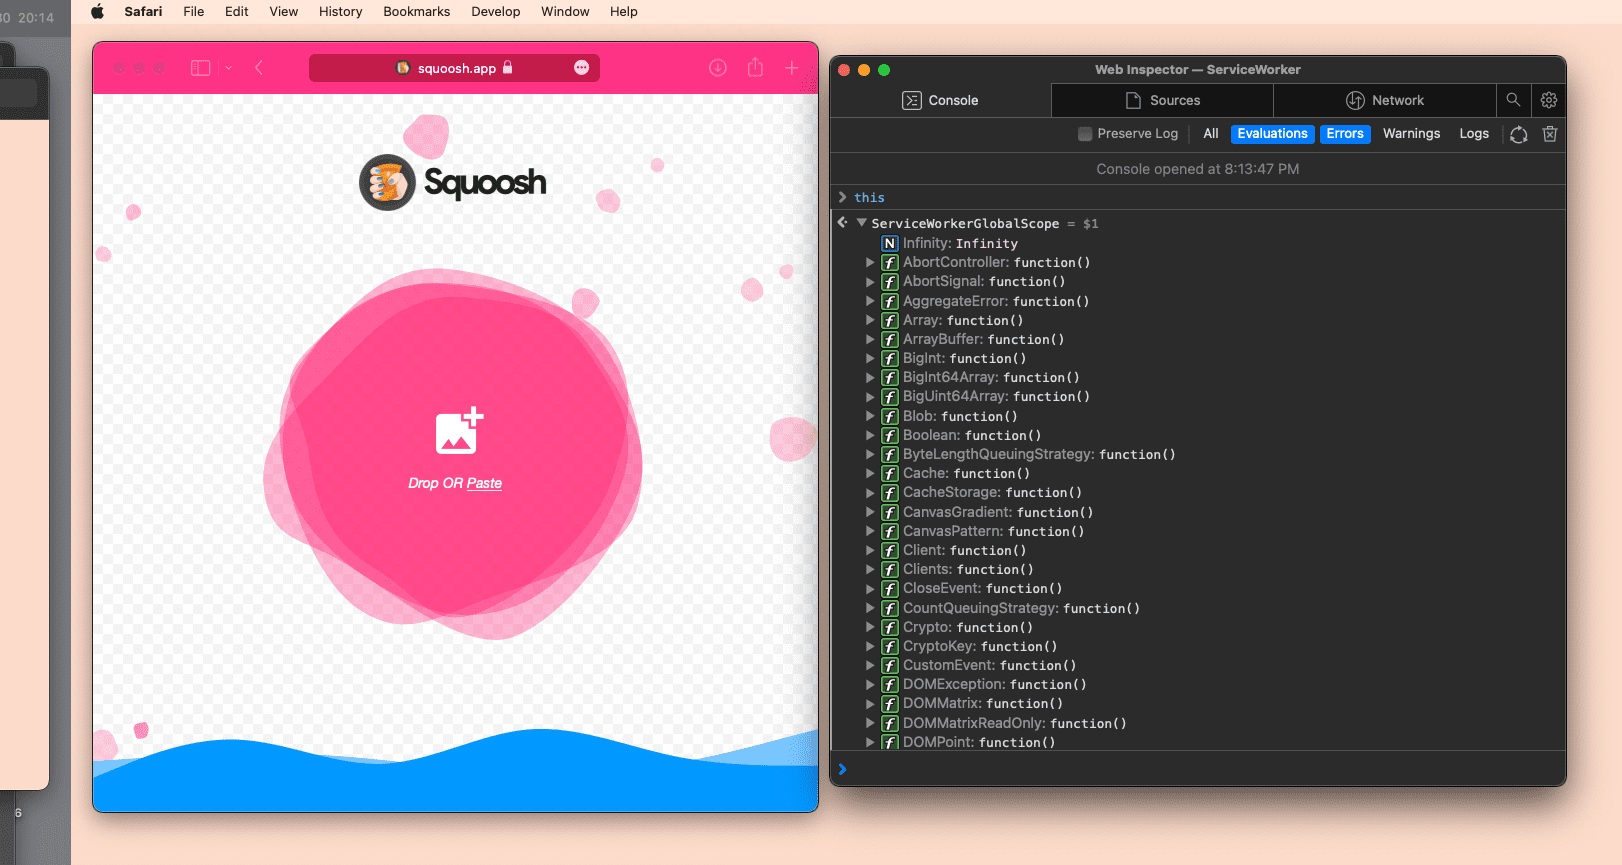
What you can do on Safari (both on macOS and remotely for iOS and iPadOS) is to open an inspector window for a service worker that is currently running.
From Safari on macOS, the Develop, Service Workers menu will list all the currently running service worker sessions. You have to select the device to inspect in the Develop menu for remote inspection. Service workers' contexts will appear in the same submenu as window contexts under the origin's or PWA's installed name.
If you select one of them, Safari will open a new window with a restricted inspector, including only Consoles, Sources, and Network Tabs.
Firefox
Firefox supports service workers on all platforms and App Manifest for installation only on Android. You can access the tools for PWAs on desktop and Android by a USB remote inspection session.
You can use the desktop version known as Firefox Developer Edition. As with Chromium browser, Firefox has versions in different channels on desktop and Android, including stable, beta, and dev versions.
Tools for PWAs
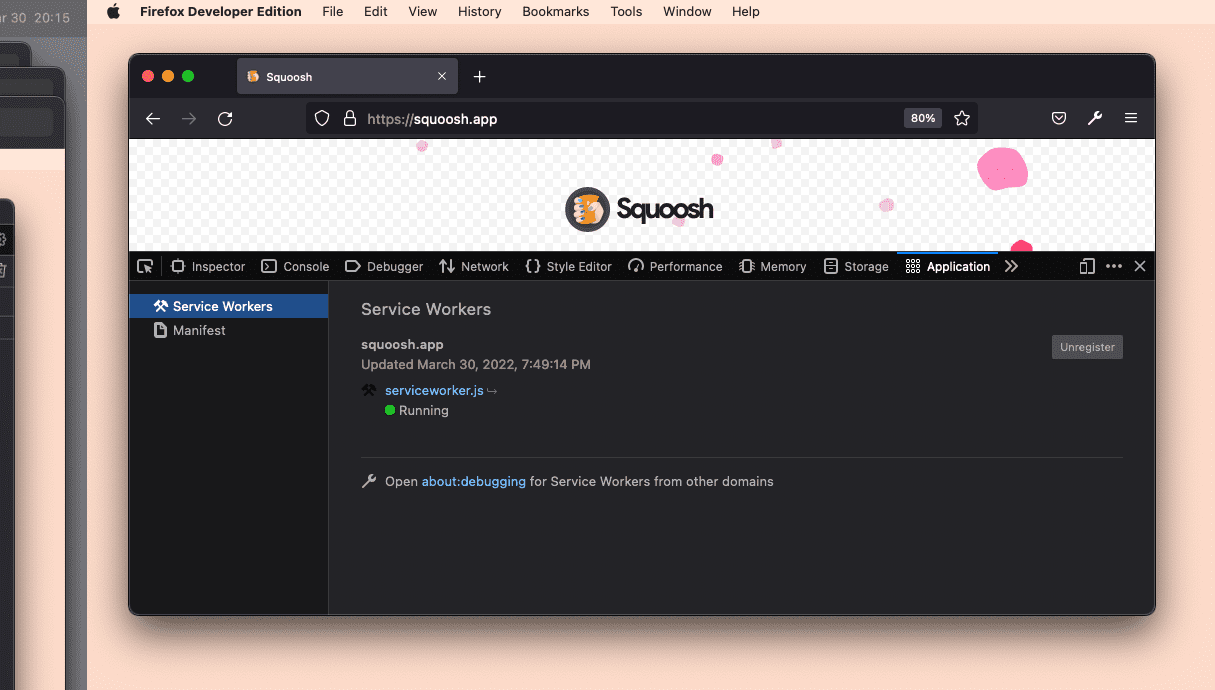
The service worker inspector on Firefox is a basic tool available in Developer Tools under Application, Service Workers. It lets you see the currently registered service worker, check its running status, and unregister it. Debugging the service worker's code may only be available on some developer versions of Firefox.
The manifest tool is available under Application, Manifest, and it only renders the manifest's values with a preview of the icons.
Under Storage, you can manage the origin's storage, including IndexedDB and Cache Storage.
You can read more about Firefox developer tooling for web apps.