Introduction
Painting the elements for a site or application can get really expensive, and it can have a negative knock-on effect on our runtime performance. In this article we take a quick look at what can trigger painting in the browser, and how you can prevent unnecessary paints from taking place.
Painting: A super-quick tour
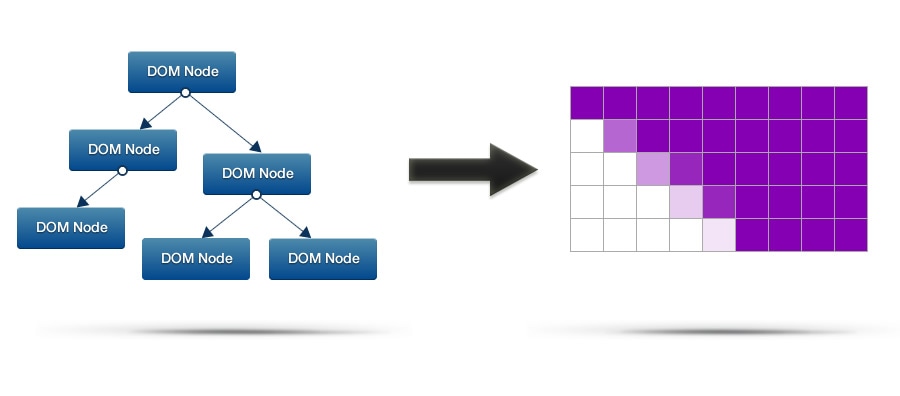
One of the major tasks a browser has to perform is converting your DOM and CSS into pixels on the screen, and it does this through a fairly complex process. It starts by reading the markup and from this it creates a DOM tree. It does a similar thing with the CSS and from that it creates the CSSOM. The DOM and CSSOM are then combined and, eventually, we arrive at a structure from which we can start to paint some pixels.
The painting process itself is interesting. In Chrome that combined tree of DOM and CSS is rasterized by some software called Skia. If you've ever played with the canvas element Skia's API would look awfully familiar to you; there are many moveTo- and lineTo-style functions as well as a bunch of more advanced ones. Essentially all the elements that need to be painted are distilled to a collection of Skia calls that can be executed, and the output of is a bunch of bitmaps. These bitmaps are uploaded to the GPU, and the GPU helps out by compositing them together to give us the final picture on screen.

The thing to take away is that Skia's workload is directly affected by the styles you apply to your elements. If you use algorithmically heavy styles then Skia is going to have more work to do. Colt McAnlis has written an article on how CSS affects page render weight, so you should read that for more insight.
With all that said, paint work takes time to perform, and if we don’t reduce it we will run over our frame budget of ~16ms. Users will notice that we missed frames and see it as jank, which ultimately hurts the user experience of our app. We really don’t want that, so let’s see what kinds of things cause paint work to be necessary, and what we can do about it.
Scrolling
Whenever you scroll up or down in the browser it needs to repaint content before it appears onscreen. All being well that will just be a small area, but even if that’s the case the elements that need to be drawn could have complex styles applied. So just because you have a small area to paint doesn't mean it's going to happen quickly.
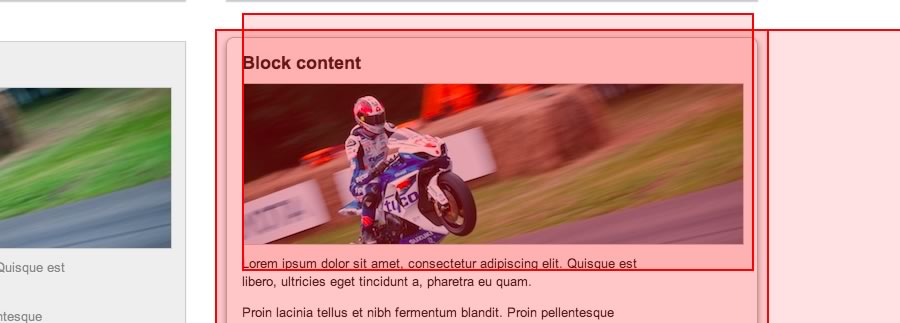
In order to see what areas are being repainted you can use the “Show Paint Rectangles” feature in Chrome’s DevTools (just hit the little cog in the lower right corner). Then, with DevTools open, simply interact with your page and you’ll see flashing rectangles show where and when Chrome painted a part of your page.

Scrolling performance is critical to your site's success; users really notice when your site or application doesn't scroll well, and they don't like it. We therefore have a vested interest in keeping the paint work light during scrolls so users don't see jank.
I've previously written an article on scrolling performance, so take a look at that if you want to know more about the specifics of scrolling performance.
Interactions
Interactions are another cause of paint work: hovers, clicks, touches, drags. Whenever the user performs one of those interactions, let's say a hover, then Chrome will have to repaint the affected element. And, much as with scrolling, if there's a large and complex paint required you're going to see the frame rate drop.
Everyone wants nice, smooth, interaction animations, so again we will need to see if the styles that change in our animation are costing us too much time.
An unfortunate combination

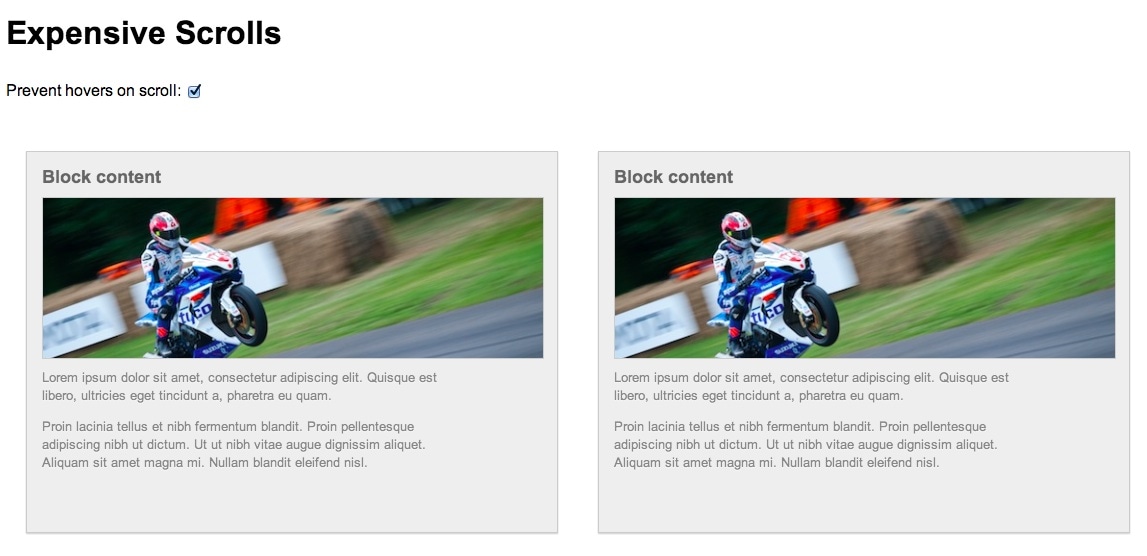
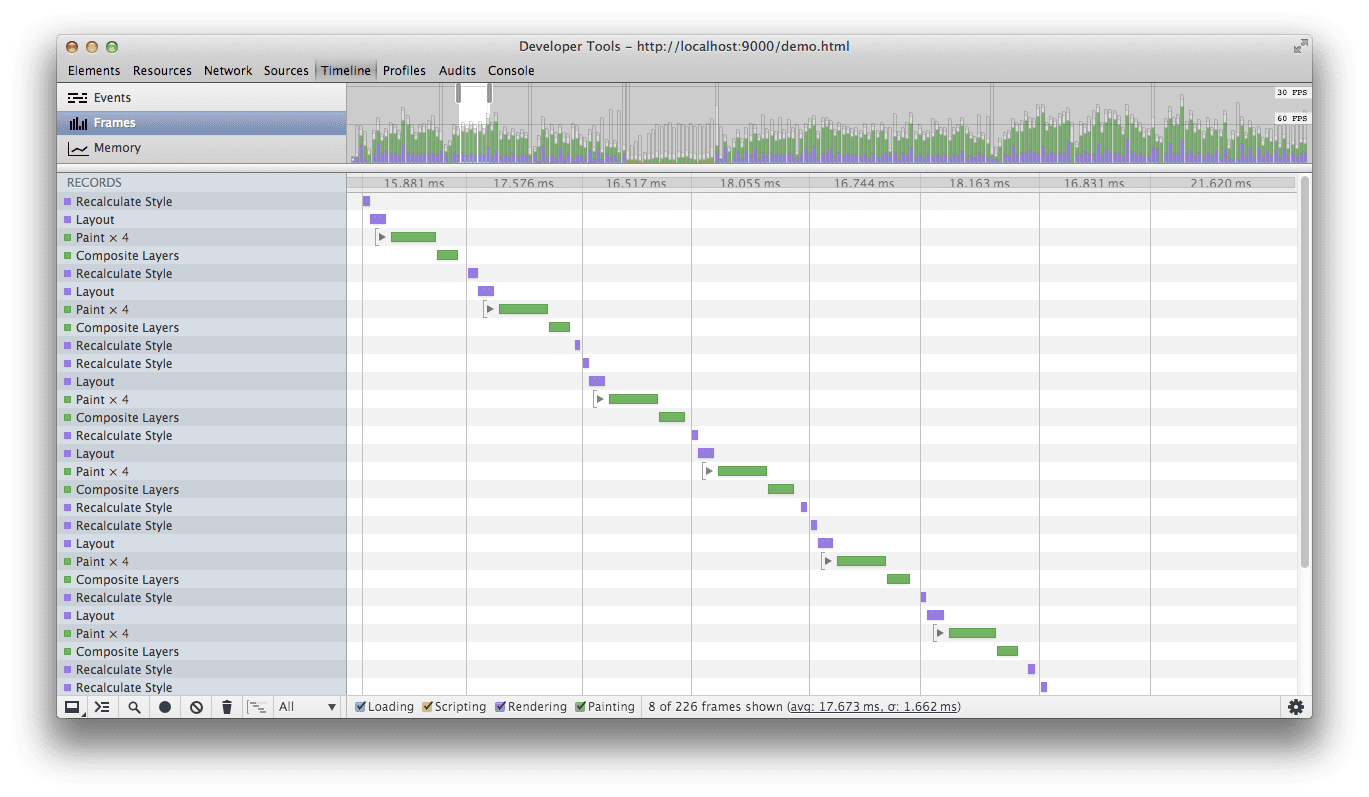
What happens if I scroll and I happen to move the mouse at the same time? It's perfectly possible for me to inadvertently "interact" with an element as I scroll past it, triggering an expensive paint. That, in turn, could push me through my frame budget of ~16.7ms (the time we need to stay under that to hit 60 frames per second). I've created a demo to show you exactly what I mean. Hopefully as you scroll and move your mouse you'll see the hover effects kicking in, but let's see what Chrome's DevTools makes of it:

In the image above you can see that DevTools is registering the paint work when I hover on one of the blocks. I've gone with some super heavy styles in my demo to make the point, and so I'm pushing up to and occasionally through my frame budget. The last thing I want is to have to do this paint work unnecessarily, and especially so during a scroll when there's other work to be done!
So how can we stop this from happening? As it happens the fix is pretty simple to implement. The trick here is to attach a scroll handler that will disable hover effects and set a timer for enabling them again. That means we are guaranteeing that when you scroll we won't need to perform any expensive interaction paints. When you've stopped for long enough we figure it's safe to switch them back on again.
Here's the code:
// Used to track the enabling of hover effects
var enableTimer = 0;

/*
 * Listen for a scroll and use that to remove
 * the possibility of hover effects
 */
window.addEventListener('scroll', function() {
  clearTimeout(enableTimer);
  removeHoverClass();

  // enable after 1 second, choose your own value here!
  enableTimer = setTimeout(addHoverClass, 1000);
}, false);

/**
 * Removes the hover class from the body. Hover styles
 * are reliant on this class being present
 */
function removeHoverClass() {
  document.body.classList.remove('hover');
}

/**
 * Adds the hover class to the body. Hover styles
 * are reliant on this class being present
 */
function addHoverClass() {
  document.body.classList.add('hover');
}
As you can see we use a class on the body to track whether or not hover effects are "allowed", and the underlying styles rely on this class to be present:
/* Expect the hover class to be on the body
 before doing any hover effects */
.hover .block:hover {
 …
}
And that's all there is to it!
Conclusion
Rendering performance is critical to users enjoying your application, and you should always aim to keep your paint workload under 16ms. To help you do that, you should integrate using DevTools throughout your development process to identify and fix bottlenecks as they arise.
Inadvertent interactions, particularly on paint-heavy elements, can be very costly and will kill rendering performance. As you've seen, we can use a small piece of code to fix that.
Take a look at your sites and applications, could they do with a little paint protection?
