
Show stakeholders how site speed improvements can increase revenue.

After a lot of hard work, you've done it. You've made your company's site noticeably faster. Now it's time for the fun part: showing stakeholders how much extra revenue your work has generated!
In this post we'll walk through how to do that by calculating the relative mobile conversion rate. This metric is useful because it quantifies the effects of site improvements while excluding external factors like marketing campaigns, which can obscure your findings. Let's get started!
Relative Mobile Conversion Rate (Rel mCvR)
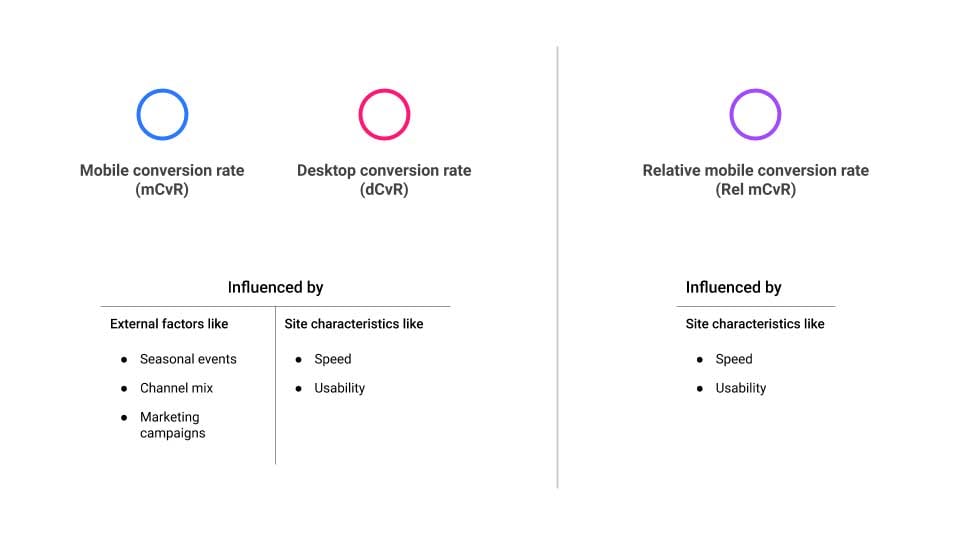
A site's conversion rate can be influenced by site characteristics— like speed and usability—and by external factors—like marketing campaigns, seasonal events, and the mix of marketing channels.
Since you're interested in how site speed affects conversions, the mobile site is most relevant— that's where you're most likely to see the benefits of speed improvements. Rather than looking at the mobile conversion rate alone, though, you'll be analyzing the relative mobile conversion rate (Rel mCvR), which is calculated by dividing the mobile conversion rate by the desktop conversion rate. This approach reduces the noise from external factors, which tend to affect both desktop and mobile, and makes it easier to see whether any increases in the mobile site's effectiveness were actually caused by the speed improvements.
Doing the analysis
Make sure you have access to your site's Google Analytics, or collaborate with the analytics team. If you don't have a Google Analytics account, you can learn how to set one up at Get started with Analytics.
Step 1: Go to Google Analytics and click Admin. Under View, choose View Settings. There, copy the View ID.
Step 2: Go to this spreadsheet and click File, and Make a copy.
Step 3: Insert the View ID from Google Analytics into field B3,
C3 and D3 in
the spreadsheet.
If your Google Analytics has goals instead of Ecommerce Conversion Rate,
change field B6 and C6 so that you remove ga:transactionsPerSession and instead type in
ga:goalConversionRateAll in the two fields.
Step 4: In the spreadsheet, click Add-ons, Google Analytics, and choose Run reports. Then go to the spreadsheet page Rel mCvR and see the results.
You should now have a chart that looks something like this:
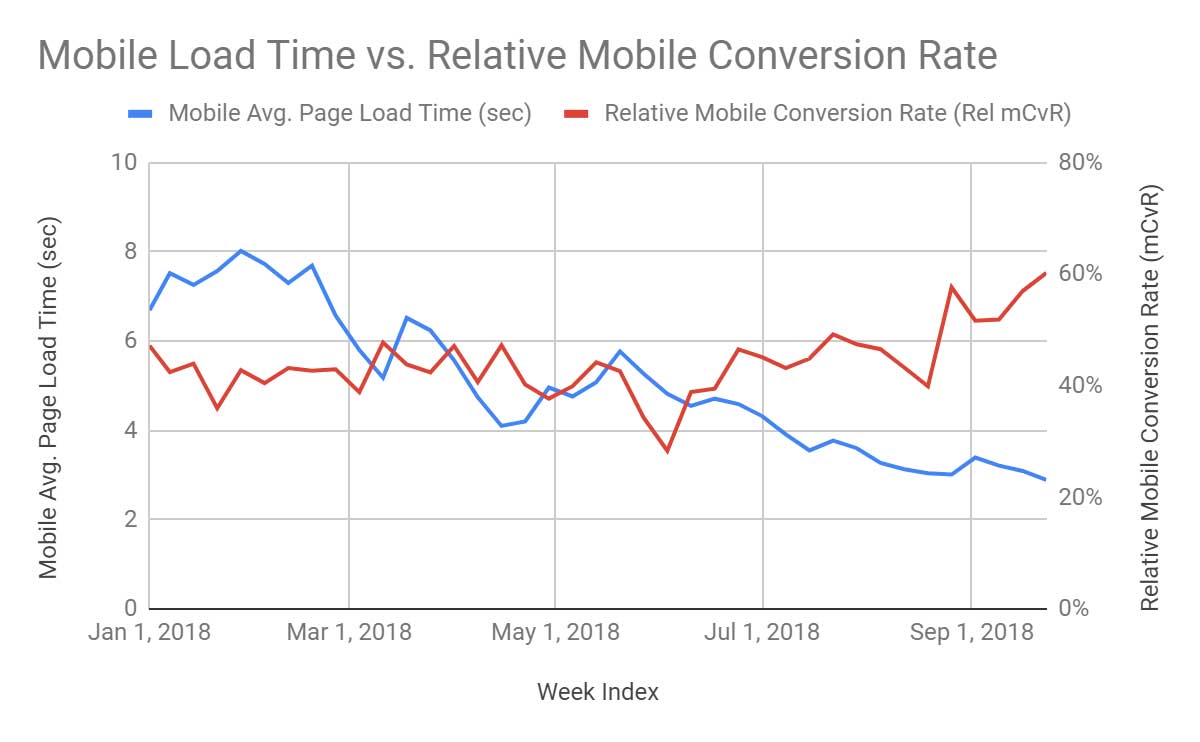
Step 6: Using the chart, identify a period before the speed optimization (when load times were high) and a period after the speed optimization (when load times should be lower) that you want to analyze. In this example, you would compare eight weeks in Jan–Feb to eight weeks in Aug–Sept.
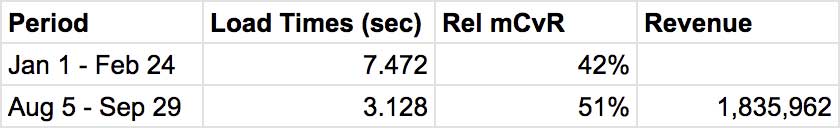
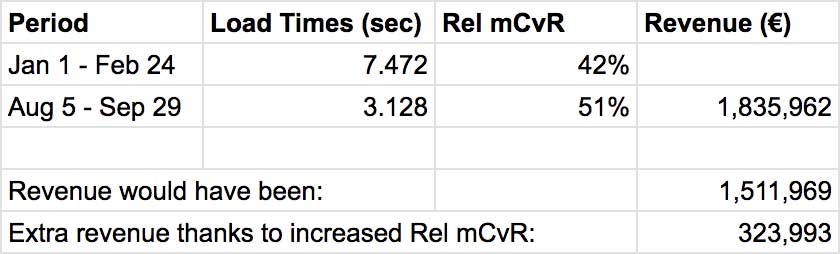
Step 7: In a new sheet, calculate the average load time and rel mCvR for the two periods. Then add the revenue coming from mobile visitors during the period after the speed optimization (Aug–Sept in the example). You can find revenue data in Google Analytics under the section Audience > Mobile > Overview.
Step 8: Now calculate what the revenue would have been if Rel mCvR had not improved. Do this by dividing the revenue (€1,835,962) by the current Rel mCvR (51%) and multiplying by the Rel mCvR for the period before the speed optimization (42%).
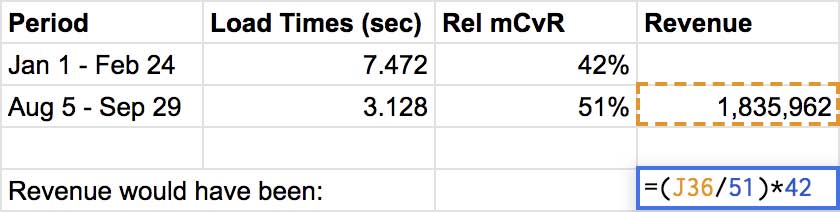
Step 9: Subtract the revenue that the company earned from what it would have earned if Rel mCvR had not improved.
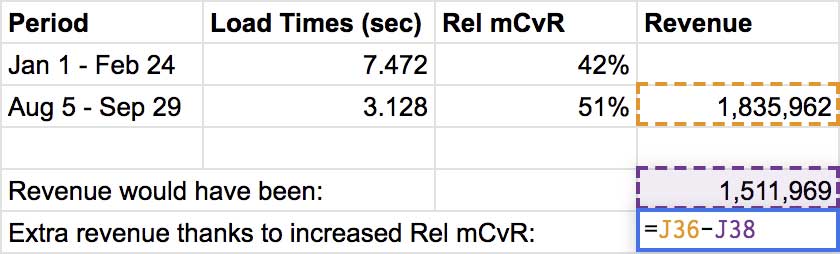
In this example, the company earned an additional €323,993 in eight weeks thanks to Rel mCvR improving —that is, thanks to the mobile site becoming faster.
Things to consider when analyzing Rel mCvR
As noted above, other changes to the site, such as UX improvements, can influence Rel mCvR.
- Check that speed was the only big change to the site during the period you want to study. If there were other changes, Rel mCvR can tell you the effect of the changes as a group, but not of an individual change.
- Watch out for any changes or events that affected the desktop site but not the mobile site —they can skew your results. If you discover any desktop-only changes, omit the affected period from your analysis.
- You might wonder whether an increase in Rel mCvR is caused by a shift in conversions from desktop to mobile rather than an increase in conversions overall. While there is likely to be some change in the mix of desktop and mobile conversions due to speed improvements, keep in mind that Rel mCvR calculates the mobile conversion rate relative to the desktop conversion rate. So, you only see an increase in Rel mCvR when mCvR goes up more than dCvR. In other words, when doing this calculation you're already counting low, which means you have a safety margin that can compensate for any shifts in the channel mix.
Summing up
While it has some limitations, Rel mCvR is a great low-cost way to estimate how much a speed optimization increased revenue without, for example, having to run server-side or slow-down tests. And quantifying the relationship between performance and revenue can help you demonstrate the value of development projects whose benefits might not be immediately clear to non-technical stakeholders.
Next steps
Aircraft instrument panel image by Arie Wubben on Unsplash