If you can not measure it, you can not improve it.
Lord Kelvin
To get your HTML5 games to run faster, you have to first pinpoint the performance bottlenecks, but this can be difficult. Evaluating frames per second (FPS) data is a start, but to see the full picture, you have to grasp the nuances in the Chrome activities.
The about:tracing tool provides the insight that helps you avoid hasty workarounds aimed at performance improvement, but which are essentially well-intentioned guesswork. You’ll save a lot of time and energy, get a clearer picture of what Chrome is doing with each frame, and use this information to optimize your game.
Hello about:tracing
Chrome's about:tracing tool gives you a window into all of Chrome's activities over a period of time with so much granularity that you might find it overwhelming at first. Many of the functions in Chrome are instrumented for tracing out of the box, so without doing any manual instrumentation you can still use about:tracing to track your performance. (See a later section on manually instrumenting your JS)
To see the tracing view simply type "about:tracing" into Chrome's omnibox (address bar).

From the tracing tool, you can start recording, run your game for a few seconds, and then view the trace data. This is an example of what the data might look like:
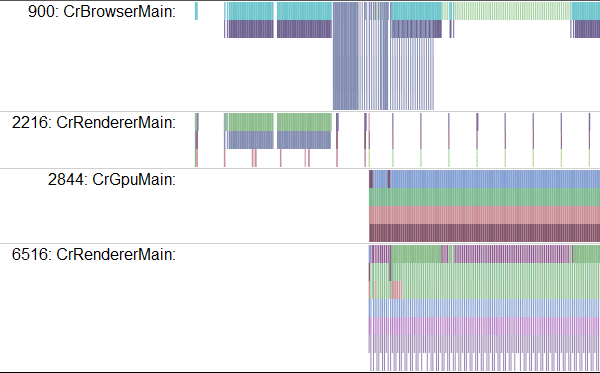
Yep, that's confusing all right. Let's talk about how to read it.
Each row represents a process being profiled, the left-right axis indicates time, and each colored box is an instrumented function call. There are rows for a number of different kinds of resources. The ones that are most interesting for game profiling are CrGpuMain, which shows what the Graphics Processing Unit (GPU) is doing, and CrRendererMain. Each trace contains CrRendererMain lines for each open tab during the trace period (including the about:tracing tab itself).
When reading trace data your first task is to determine which CrRendererMain row corresponds to your game.
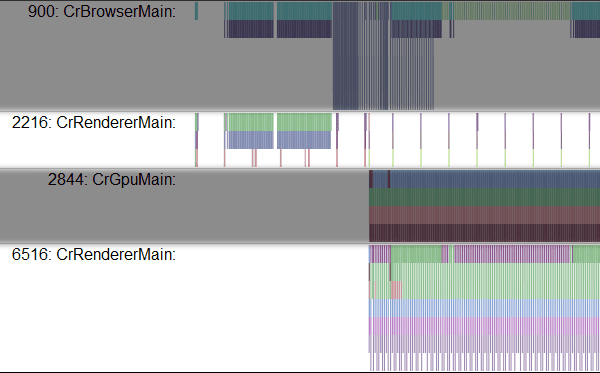
In this example the two candidates are: 2216 and 6516. Unfortunately there currently isn't a polished way to pick out your application except to look for the line that's doing a lot of periodic updating (or if you've manually instrumented your code with trace points, to look for the line that contains your trace data). In this example, it looks like 6516 is running a main loop from the frequency of updates. If you close all other tabs before starting trace, finding out the correct CrRendererMain will be easier. But there still may be CrRendererMain rows for processes other than your game.
Finding your frame
Once you've located the correct row in the tracing tool for your game, the next step is to find the main loop. The main loop looks like a repeating pattern in the tracing data. You can navigate the tracing data by using the W, A, S, D keys: A and D to move left or right (back and forth in time) and W and S to zoom in and out on the data. You would expect your main loop to be a pattern that repeats every 16 milliseconds if your game is running at 60Hz.

Once you've located your game's heartbeat, you can dig into what exactly your code is doing at each frame. Use W, A, S, D to zoom in until you can read the text in the function boxes.
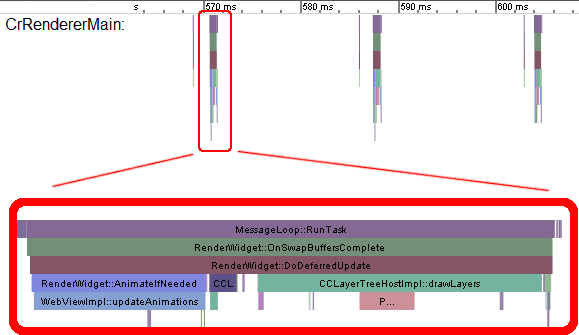
This collection of boxes shows a series of function calls, with each call represented by a colored box. Each function was called by the box above it, so in this case, you can see that MessageLoop::RunTask called RenderWidget::OnSwapBuffersComplete, which in turn called RenderWidget::DoDeferredUpdate, and so on. Reading this data, you can get a full view of what called what and how long each execution took.
But here's where it gets a little sticky. The information exposed by about:tracing is the raw function calls from the Chrome source code. You can make educated guesses about what each function is doing from the name, but the information is not exactly user friendly. It's useful to see the overall flow of your frame, but you need something a little more human readable to actually figure out what's going on.
Adding trace tags
Fortunately there's a friendly way to add manual instrumentation to your code to create trace data: console.time and console.timeEnd.
console.time("update");
update();
console.timeEnd("update");
console.time("render");
update();
console.timeEnd("render");
The above code creates new boxes in the tracing view name with the tags specified, so if you re-run the app you'll see "update" and "render" boxes that show the time elapsed between the start and end calls for each tag.

Using this, you can create human readable tracing data to track hotspots in your code.
GPU or CPU?
With hardware accelerated graphics, one of the most important questions you can ask during profiling is: Is this code GPU bound or CPU bound? With each frame you'll be doing some rendering work on the GPU and some logic on the CPU; in order to understand what's making your game slow you'll need to see how the work is balanced across the two resources.
First, find the line on the tracing view named CrGPUMain, which indicates whether the GPU is busy at a particular time.
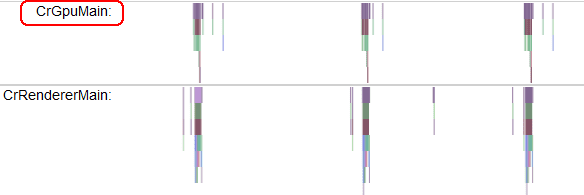
You can see that every frame of your game causes CPU work in the CrRendererMain as well as on the GPU. The above trace shows a very simple use case where both the CPU and GPU are idle for most of each 16ms frame.
The tracing view really becomes helpful when you've got a game that's running slowly and you're not sure which resource you're maxing out. Looking at how the GPU and CPU lines relate is the key to debugging. Take the same example as before, but add a little extra work in the update loop.
console.time("update");
doExtraWork();
update(Math.min(50, now - time));
console.timeEnd("update");

console.time("render");
render();
console.timeEnd("render");
Now you'll see a trace that looks like this:

What does this trace tell us? We can see that the frame pictured goes from about 2270ms to 2320ms, meaning that each frame is taking about 50ms (a frame rate of 20Hz). You can see slivers of colored boxes representing the render function next to the update box, but the frame is entirely dominated by update itself.
In contrast to what's going on on the CPU, you can see that the GPU is still sitting around idle for most of every frame. To optimize this code, you could look for operations that can be done in shader code and move them to the GPU to make best use of resources.
What about when the shader code itself is slow and the GPU is overworked? What if we remove the unnecessary work from the CPU and instead add some work in the fragment shader code. Here's a needlessly expensive fragment shader:
#ifdef GL_ES
precision highp float;
#endif
void main(void) {
  for(int i=0; i<9999; i++) {
    gl_FragColor = vec4(1.0, 0, 0, 1.0);
  }
}
What does a trace of code using that shader look like?

Again, note the duration of a frame. Here the repeating pattern goes from about 2750ms to 2950ms, a duration of 200ms (frame rate of about 5Hz). The CrRendererMain line is almost completely empty meaning that the CPU is idle most of the time, while the GPU is overloaded. This is a sure sign that your shaders are too heavy.
If you didn't have visibility into exactly what was causing the low framerate, you could observe the 5 Hz update and be tempted to go into the game code and start trying to optimize or remove game logic. In this case, that would do absolutely no good, because logic in the game loop isn't what is eating up time. In fact, what this trace indicates is that doing more CPU work each frame would be essentially "free" in that the CPU is hanging around idle, so giving it more work will not effect how long the frame takes.
Real Examples
Now let's check out what tracing data from a real game looks like. One of the cool things about games built with open web technologies is that you can see what's going on in your favorite products. If you want to test out profiling tools you can pick your favorite WebGL title from the Chrome Web Store and profile it with about:tracing. This is an example trace taken from the excellent WebGL game Skid Racer.
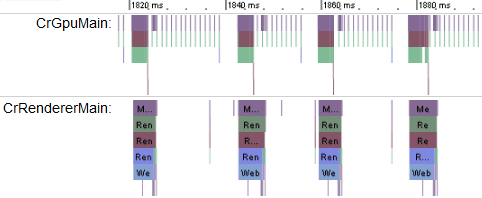
Looks like each frame takes about 20ms, which means that the frame rate is about 50 FPS. You can see that the work is balanced between the CPU and GPU, but the GPU is the resource that's most in demand. If you want to see what it's like to profile real examples of WebGL games try playing around with some of the Chrome Web Store titles built with WebGL including:
Conclusion
If you want your game to run at 60Hz, then for every frame all your operations have to fit into 16ms of CPU and 16ms of GPU time. You have two resources that can be utilized in parallel, and you can shift work between them to maximize performance. Chrome's about:tracing view is an invaluable tool for getting insight into what your code is actually doing and will help you maximize your development time by tackling the right problems.
What's next?
Besides GPU, you can also trace other parts of the Chrome runtime. Chrome Canary, the early stage version of Chrome, is instrumented to trace IO, IndexedDB and several other activities. You should read this Chromium article for a deeper understanding of the current state of tracing events.
If you are a web game developer, make sure you watch the video below. It is a presentation from Google's Game Developer Advocate team at GDC 2012 about performance optimization for Chrome games:

