Introduction
While JavaScript employs garbage collection for automatic memory management, it is not a substitute for effective memory management in applications. JavaScript applications suffer from the same memory related problems that native applications do, such as memory leaks and bloat, yet they must also deal with garbage collection pauses. Large-scale applications like Gmail encounter the same problems facing your smaller applications. Read on to learn how the Gmail team used Chrome DevTools to identify, isolate, and fix their memory problems.
Google I/O 2013 Session
We presented this material at Google I/O 2013. Check out the video below:
Gmail, we have a problem…
The Gmail team was facing a serious problem. Anecdotes of Gmail tabs consuming multiple gigabytes of memory on resource-constrained laptops and desktops were being heard increasingly frequently, often with a conclusion of bringing the entire browser down. Stories of CPUs being pinned at 100%, unresponsive apps, and Chrome sad tabs ("He's dead, Jim."). The team was at a loss as to how to even begin diagnosing the problem, let alone fix it. They had no idea how widespread the problem was and the available tools didn't scale up to large applications. The team joined forces with the Chrome teams, and together they developed new techniques to triage memory problems, improved existing tools, and enabled the collection of memory data from the field. But, before getting to the tools, let's cover the basics of JavaScript memory management.
Memory Management Basics
Before you can effectively manage memory in JavaScript you must understand the fundamentals. This section will cover primitive types, the object graph, and provide definitions for memory bloat in general and a memory leak in JavaScript. Memory in JavaScript can be conceptualized as a graph and because of this Graph theory plays a part in JavaScript memory management and the Heap Profiler.
Primitive Types
JavaScript has three primitive types:
- Number (e.g. 4, 3.14159)
- Boolean (true or false)
- String ("Hello World")
These primitive types cannot reference any other values. In the object graph these values are always leaf or terminating nodes, meaning they never have an outgoing edge.
There is only one container type: the Object. In JavaScript the Object is an associative array. A non-empty object is an inner node with outgoing edges to other values (nodes).
What About Arrays?
An Array in JavaScript is actually an Object that has numeric keys. This is a simplification, because JavaScript runtimes will optimize Array-like Objects and represent them under the hood as arrays.
Terminology
- Value - An instance of a primitive type, Object, Array, etc.
- Variable - A name that references a value.
- Property - A name in an Object that references a value.
Object Graph
All values in JavaScript are part of the object graph. The graph begins with roots, for example, the window object. Managing the lifetime of GC roots is not in your control, as they are created by the browser and destroyed when the page is unloaded. Global variables are actually properties on window.
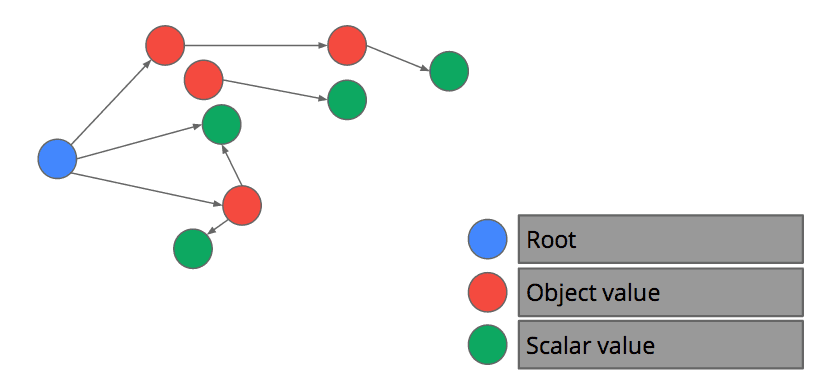
When Does a Value Become Garbage?
A value becomes garbage when there is no path from a root to the value. In other words, starting at the roots and exhaustively searching all Object properties and variables that are alive in the stack frame, a value cannot be reached, it has become garbage.
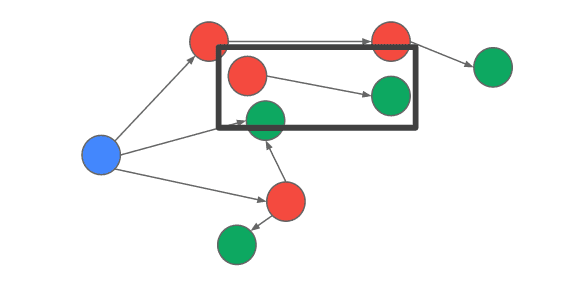
What is a Memory Leak in JavaScript?
A memory leak in JavaScript most commonly occurs when there are DOM nodes that are not reachable from the page's DOM tree, but are still referenced by a JavaScript object. While modern browsers are making it increasingly difficult to inadvertently create leaks, it's still easier than one might think. Let's say you append an element to the DOM tree like this:
email.message = document.createElement("div");
displayList.appendChild(email.message);
And later, you remove the element from the display list:
displayList.removeAllChildren();
As long as email exists, the DOM element referenced by message will not be removed, even though it is now detached from the page's DOM tree.
What is Bloat?
Your page is bloated when you're using more memory than necessary for optimal page speed. Indirectly, memory leaks also cause bloat but that is not by design. An application cache that does not have any size bound is a common source of memory bloat. Also, your page can be bloated by host data, for example, pixel data loaded from images.
What is Garbage Collection?
Garbage collection is how memory is reclaimed in JavaScript. The browser decides when this happens. During a collection, all script execution on your page is suspended while live values are discovered by a traversal of the object graph starting at the GC roots. All the values which are not reachable are classified as garbage. Memory for garbage values is reclaimed by the memory manager.
V8 Garbage Collector in Detail
To help further understand how garbage collection happens, let's take a look at the V8 garbage collector in detail. V8 uses a generational collector. Memory is divided into two generations: the young and the old. Allocation and collection within the young generation is fast and frequent. Allocation and collection within the old generation is slower and less frequent.
Generational Collector
V8 uses a two generation collector. The age of an value is defined as the number of bytes allocated since it was allocated. In practice, the age of an value is often approximated by the number of young generation collections that it survived. After a value is sufficiently old it is tenured into the old generation.
In practice, freshly allocated values do not live long. A study of Smalltalk programs, showed that only 7% of values survive after a young generation collection. Similar studies across runtimes found that on average between, 90% and 70% of freshly allocated values are never tenured into the old generation.
Young Generation
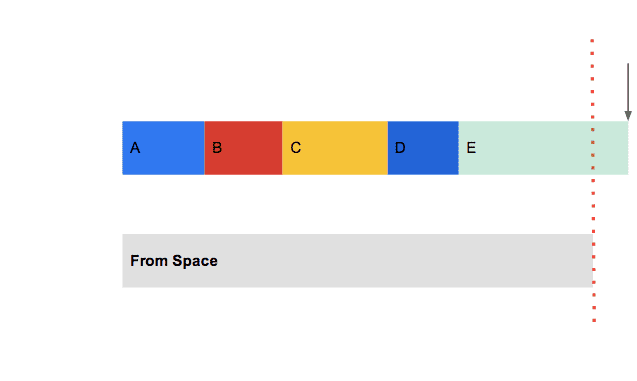
The young generation heap in V8 is split into two spaces, named from and to. Memory is allocated from the to space. Allocating is very fast, until, the to space is full at which point a young generation collection is triggered. Young generation collection first swaps the from and to space, the old to space (now the from space) is scanned and all live values are copied into the to space or tenured into the old generation. A typical young generation collection will take on the order of 10 milliseconds (ms).
Intuitively, you should understand that each allocation your application makes brings you closer exhausting the to space and incurring a GC pause. Game developers, take note: to ensure a 16ms frame time (required to achieve 60 frames per second), your application must make zero allocations, because a single young generation collection will eat up most of the frame time.
Old Generation
The old generation heap in V8 uses a mark-compact algorithm for collection. Old generation allocations occur whenever a value is tenured from the young generation to the old generation. Whenever an old generation collection occurs a young generation collection is done as well. Your application will paused on the order of seconds. In practice this is acceptable because old generation collections are infrequent.
V8 GC Summary
Automatic memory management with garbage collection is great for developer productivity, but, each time you allocate a value, you move ever closer to a garbage collection pause. Garbage collection pauses can ruin the feel of your application by introducing jank. Now that you understand how JavaScript manages memory, you can make the right choices for your application.
Fixing Gmail
Over the past year, numerous features and bug fixes have made their way into the Chrome DevTools making them more powerful than ever. In addition, the browser itself made a key change to the performance.memory API making it possible for Gmail and any other application to collect memory statistics from the field. Armed with these awesome tools, what once seemed like an impossible task soon became an exciting game of tracking down culprits.
Tools and Techniques
Field Data and performance.memory API
As of Chrome 22, the performance.memory API is enabled by default. For long-running applications like Gmail, data from real users is invaluable. This information allows us to distinguish between power users-- those who spend 8-16 hours a day on Gmail, receiving hundreds of messages a day-- from more average users who spend a few minutes a day in Gmail, receiving a dozen or so messages a week.
This API returns three pieces of data:
- jsHeapSizeLimit - The amount of memory (in bytes) that the JavaScript heap is limited to.
- totalJSHeapSize - The amount of memory (in bytes) that the JavaScript heap has allocated including free space.
- usedJSHeapSize - The amount of memory (in bytes) currently being used.
One thing to keep in mind is that the API returns memory values for the entire Chrome process. Although it is not the default mode, under certain circumstances, Chrome may open multiple tabs in the same renderer process. This means that the values returned by performance.memory may contain the memory footprint of other browser tabs in addition to the one containing your app.
Measuring Memory At Scale
Gmail instrumented their JavaScript to use the performance.memory API to collect memory information approximately once every 30 minutes. Because many Gmail users leave the app up for days at a time, the team was able to track memory growth over time as well as overall memory footprint statistics. Within a few days of instrumenting Gmail to collect memory information from a random sampling of users, the team had enough data to understand how widespread the memory problems were among average users. They set a baseline and used the stream of incoming data to track progress toward the goal of reducing memory consumption. Eventually this data would also be used to catch any memory regressions.
Beyond tracking purposes, the field measurements also provide a keen insight into the correlation between memory footprint and application performance. Contrary to the popular belief that "more memory results in better performance", the Gmail team found that the larger the memory footprint, the longer latencies were for common Gmail actions. Armed with this revelation, they were more motivated than ever to rein in their memory consumption.

Identifying a Memory Problem with the DevTools Timeline
The first step in solving any performance problem is to prove that the problem exists, create a reproducible test, and take a baseline measurement of the problem. Without a reproducible program, you cannot reliably measure the problem. Without a baseline measurement you don't know by how much you've improved performance.
The DevTools Timeline panel is an ideal candidate for proving that the problem exists. It gives a complete overview of where time is spent when loading and interacting with your web app or page. All events, from loading resources to parsing JavaScript, calculating styles, garbage collection pauses, and repainting are plotted on a timeline. For the purposes of investigating memory issues, the Timeline panel also has a Memory mode which tracks total allocated memory, number of DOM nodes, number of window objects, and the number of event listeners allocated.
Proving a problem exists
Start by identifying a sequence of actions you suspect to be leaking memory. Start recording the timeline, and perform the sequence of actions. Use the trash can button at the bottom to force a full garbage collection. If, after a few iterations, you see a sawtooth shaped graph, you are allocating lots of shortly lived objects. But if the sequence of actions is not expected to result in any retained memory, and the DOM node count does not drop down back to the baseline where you began, you have good reason to suspect there is a leak.
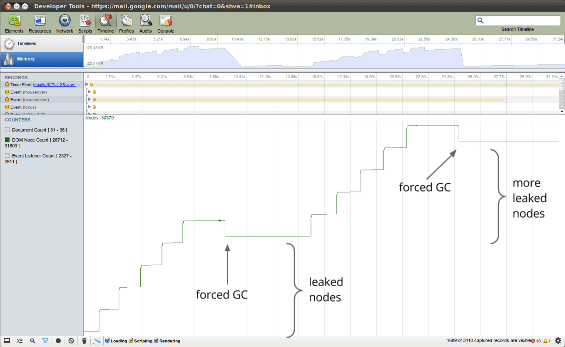
Once you've confirmed that the problem exists, you can get help identifying the source of the problem from the DevTools Heap Profiler.
Finding Memory Leaks with the DevTools Heap Profiler
The Profiler panel provides both a CPU profiler and a Heap profiler. Heap profiling works by taking a snapshot of the object graph. Before a snapshot is taken both the young and old generations are garbage collected. In other words, you will only see values which were alive when the snapshot was taken.
There is too much functionality in the Heap profiler to cover sufficiently in this article, but detailed documentation can be found on the Chrome Developers site. We'll focus here on the Heap Allocation profiler.
Using the Heap Allocation Profiler
The Heap Allocation profiler combines the detailed snapshot information of the Heap Profiler with the incremental updating and tracking of the Timeline panel. Open the Profiles panel, start a Record Heap Allocations profile, perform a sequence of actions, then stop the recording for analysis. The allocation profiler takes heap snapshots periodically throughout the recording (as frequently as every 50 ms!) and one final snapshot at the end of the recording.
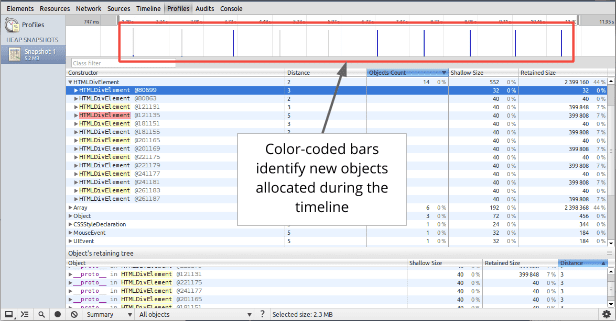
The bars at the top indicate when new objects are found in the heap. The height of each bar corresponds to the size of the recently allocated objects, and the color of the bars indicate whether or not those objects are still live in the final heap snapshot: blue bars indicate objects that are still live at the end of the timeline, gray bars indicate objects that were allocated during the timeline, but have since been garbage collected.
In the example above, an action was performed 10 times. The sample program caches five objects, so the last five blue bars are expected. But the leftmost blue bar indicates a potential problem. You can then use the sliders in the timeline above to zoom in on that particular snapshot and see the objects that were recently allocated at that point. Clicking on a specific object in the heap will show its retaining tree in the bottom portion of the heap snapshot. Examining the retaining path to the object should give you enough information to understand why the object was not collected, and you can make the necessary code changes to remove the unnecessary reference.
Resolving Gmail's Memory Crisis
By using the tools and techniques discussed above, the Gmail team was able to identify a few categories of bugs: unbounded caches, infinitely growing arrays of callbacks waiting for something to happen that never actually happens, and event listeners unintentionally retaining their targets. By fixing these issues, the overall memory usage of Gmail was dramatically reduced. Users in the 99% percent used 80% less memory than before and the memory consumption of the median users dropped by nearly 50%.
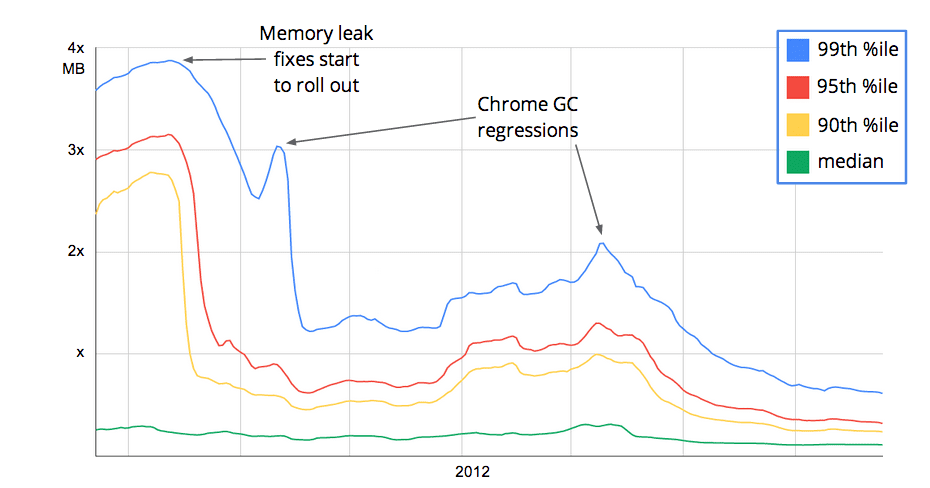
Because Gmail used less memory the GC pause latency was reduced, increasing the overall user experience.
Also of note, with the Gmail team collecting statistics on memory usage, they were able to uncover garbage collection regressions inside Chrome. Specifically, two fragmentation bugs were discovered when Gmail's memory data began showing a dramatic increase in the gap between total memory allocated and live memory.
Call to Action
Ask yourself these questions:
- How much memory is my app using? It's possible that you are using too much memory which contrary to popular belief has a net negative on overall application performance. It's hard to know exactly what the right number is, but, be sure to verify that any extra caching your page is using has a measurable performance impact.
- Is my page leak free? If your page has memory leaks it can not only impact your page's performance but other tabs as well. Use the object tracker to help narrow in on any leaks.
- How frequently is my page GCing? You can see any GC pause using Timeline panel in Chrome Developer Tools. If your page is GCing frequently, chances are you are allocating too frequently, churning through your young generation memory.
Conclusion
We started off in a crisis. Covered the core basics of memory management in JavaScript and V8 in particular. You learned how to use the tools, including the new object tracker feature available in the latest builds of Chrome. The Gmail team, armed with this knowledge, solved their memory usage problem and saw improved performance. You can do the same with your web apps!


