Supercharge your performance detective skills with Lighthouse and Chrome DevTools.
As a developer, you often don't have control over which third-party scripts your site loads. Before you can optimize third-party content you have to do some detective work to find out what's making your site slow. 🕵️
In this post, you'll learn how to use Lighthouse and Chrome DevTools to identify slow third-party resources. The post walks through increasingly robust techniques which are best used in combination.
If you only have 5 minutes
The Lighthouse Performance audit helps you discover opportunities to speed up page loads. Slow third-party scripts are likely to appear in the Diagnostics section under the Reduce JavaScript execution time and Avoid enormous network payloads audits.
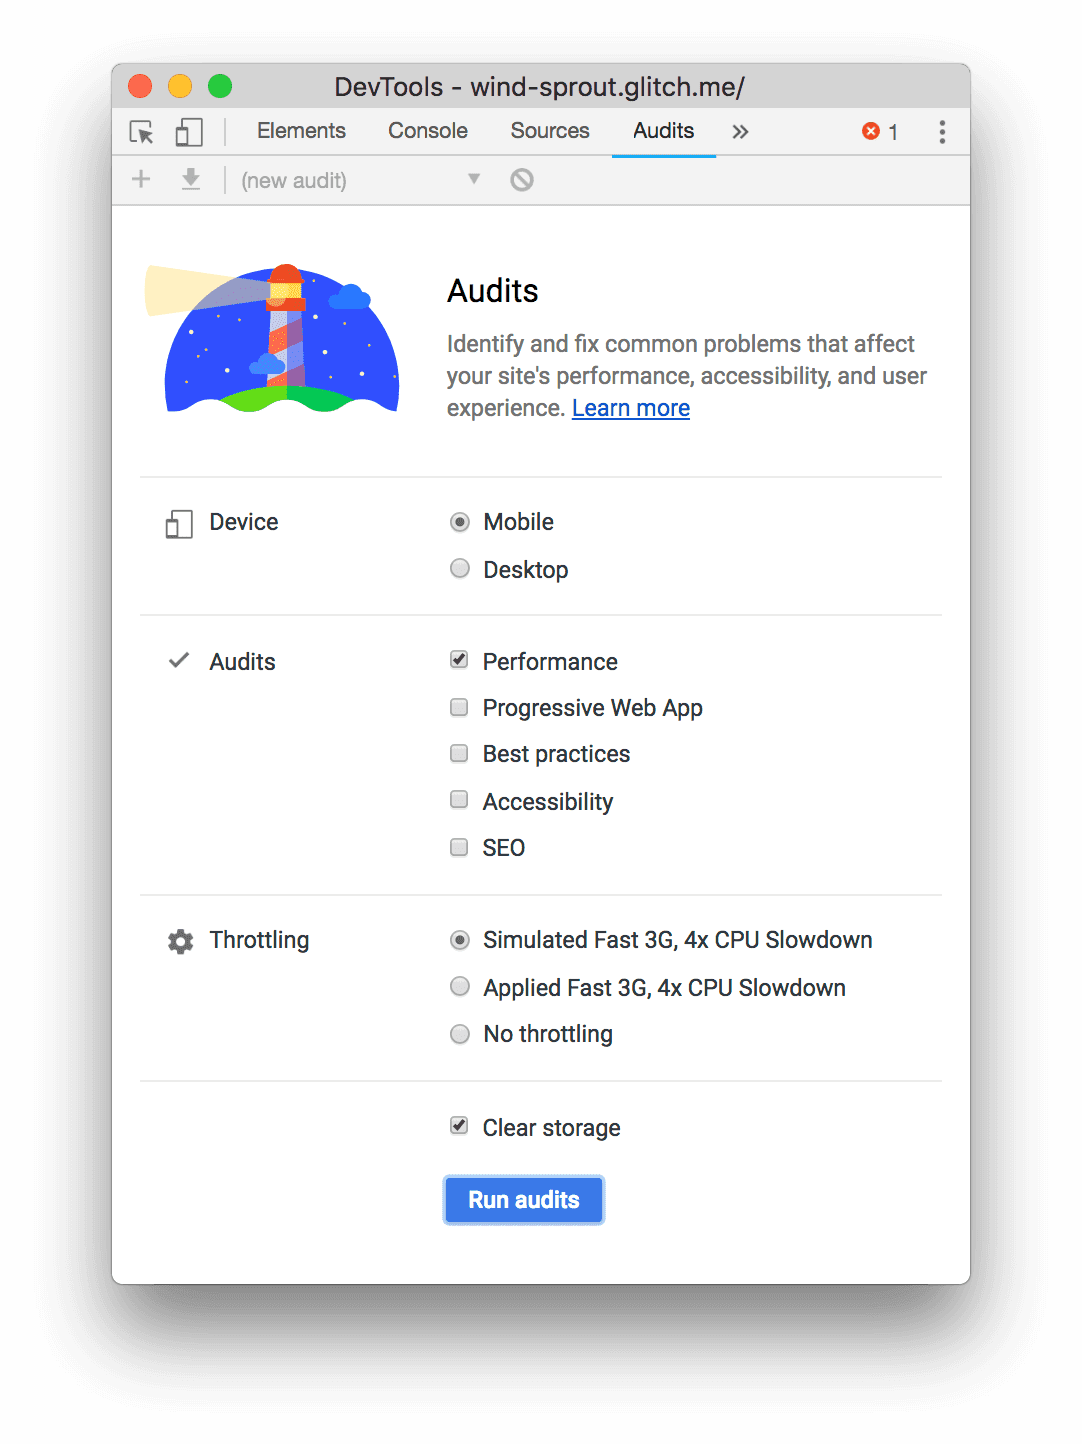
To run an audit:
- Press `Control+Shift+J` (or `Command+Option+J` on Mac) to open DevTools.
- Click the Lighthouse tab.
- Click Mobile.
- Select the Performance checkbox. (You can clear the rest of the checkboxes in the Audits section.)
- Click Simulated Fast 3G, 4x CPU Slowdown.
- Select the Clear Storage checkbox.
- Click Run audits.
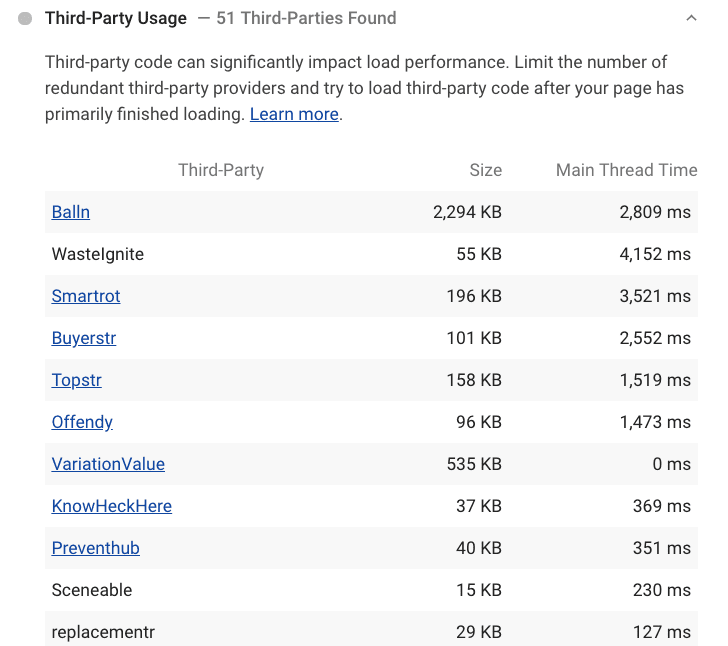
Third-party usage
The Lighthouse Third-party usage audit shows a list of the third-party providers a page uses. This overview can help you better understand the big picture and identify redundant third-party code. The audit is available in the Lighthouse extension and will soon be added to DevTools in Chrome 77.
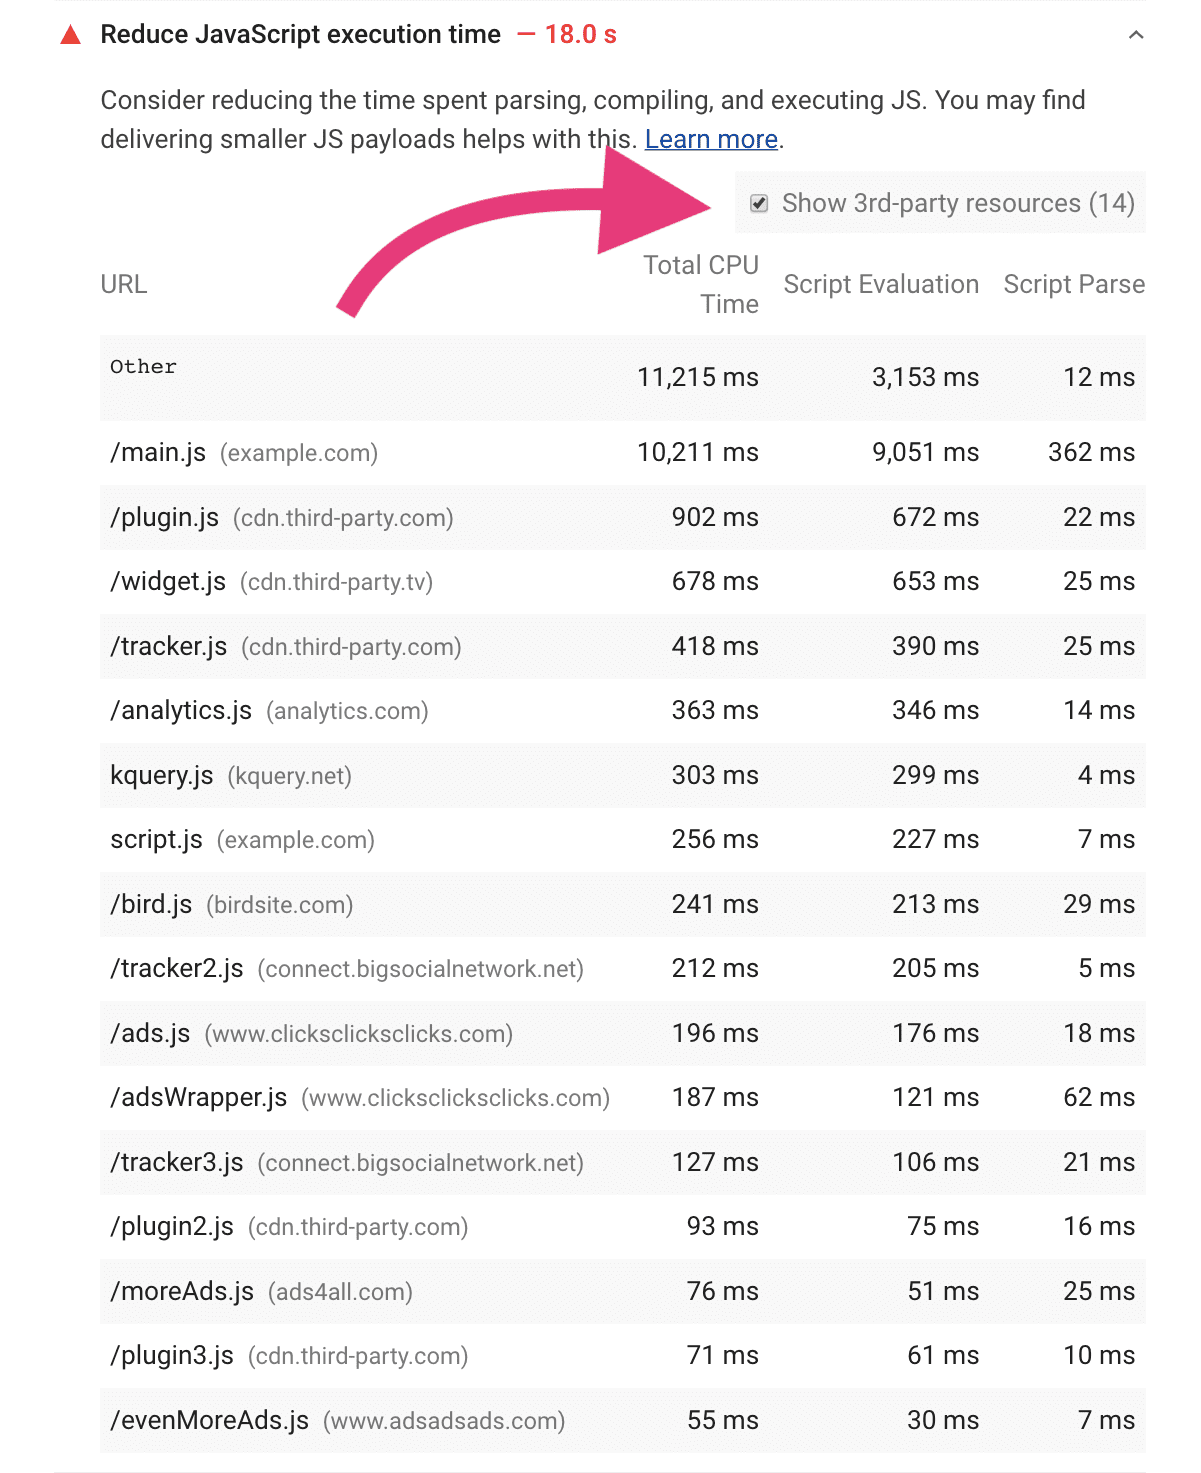
Reduce JavaScript execution time
The Lighthouse Reduce JavaScript execution time audit highlights scripts that take a long time to parse, compile, or evaluate. Select the Show 3rd-party resources checkbox to discover CPU-intensive third-party scripts.
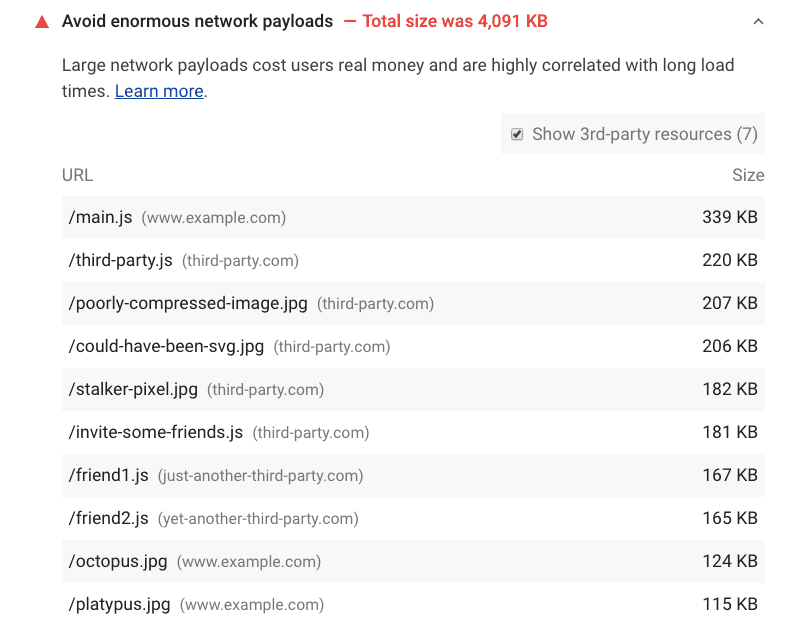
Avoid enormous network payloads
The Lighthouse Avoid enormous network payloads audit identifies network requests—including those from third-parties—that may slow down page load time. The audit fails when your network payload exceeds 4,000 KB.
Block network requests in Chrome DevTools
Chrome DevTools network request blocking allows you to see how your page behaves when a particular script, stylesheet, or other resource isn't available. After you identify third-party scripts that you suspect affect performance, measure how your load time changes by blocking the requests to those scripts.
To enable request blocking: 1. Press `Control+Shift+J` (or `Command+Option+J` on Mac) to open DevTools. 1. Click the Network tab. 1. Right-click any request in the Network panel. 1. Select Block request URL.
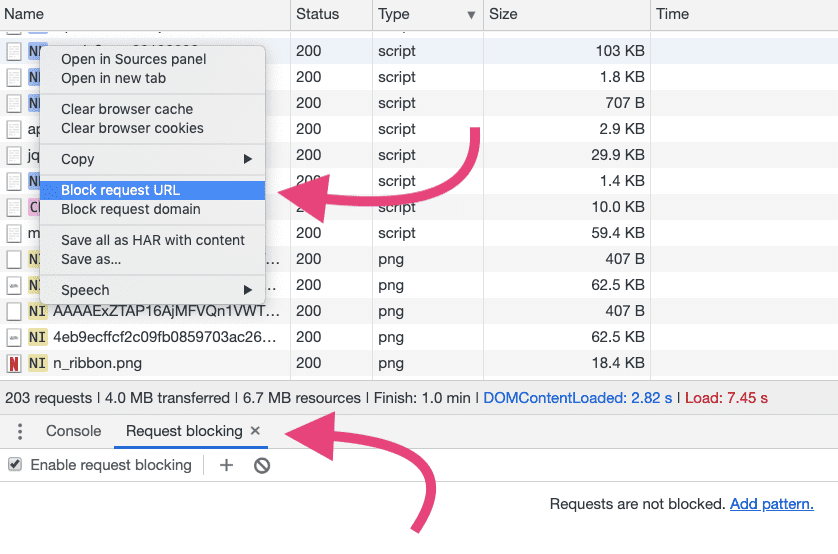
A Request blocking tab will appear in the DevTools drawer. You can manage which requests have been blocked there.
To measure the impact of third-party scripts:
- Measure how long your page takes to load using the Network panel. To emulate real-world conditions, turn on network throttling and CPU throttling. (On faster connections and desktop hardware, the impact of expensive scripts may not be as representative as it would be on a mobile phone.)
- Block the URLs or domains responsible for third-party scripts you believe are an issue.
- Reload the page and re-measure how long it takes to load without the blocked third-party scripts.
You should hopefully see a speed improvement, but occasionally blocking third-party scripts might not have the effect you expect. If that's the case, reduce the list of blocked URLs until you isolate the one that's causing slowness.
Note that doing three or more runs of measurement and looking at the median values will likely produce more stable results. As third-party content can occasionally pull in different resources per page load, this approach can give you a more realistic estimate. DevTools now supports multiple recordings in the Performance panel, making this a little easier.

