The developer experience
Now that I have covered mini apps per se, I want to focus on the developer experience for the various super app platforms. Mini app development on all platforms happens in IDEs that are provided for free by the super app platforms. While there are more, I want to focus on the four most popular ones, and a fifth for Quick App for comparison.
Mini app IDEs
Like the super apps, the majority of the IDEs are available only in Chinese. You actually want to make sure that you install the Chinese version and not a sometimes available English (or overseas) version, since it might not be up-to-date. If you are a macOS developer, be aware that not all IDEs are signed, which means macOS refuses to run the installer. You can, at your own risk, bypass this as outlined by Apple help.
Mini app starter projects
To get started quickly with mini app development, all super app providers offer demo apps that can be downloaded and tested immediately, and that are sometimes also integrated in the "New Project" wizards of the various IDEs.
Development flow
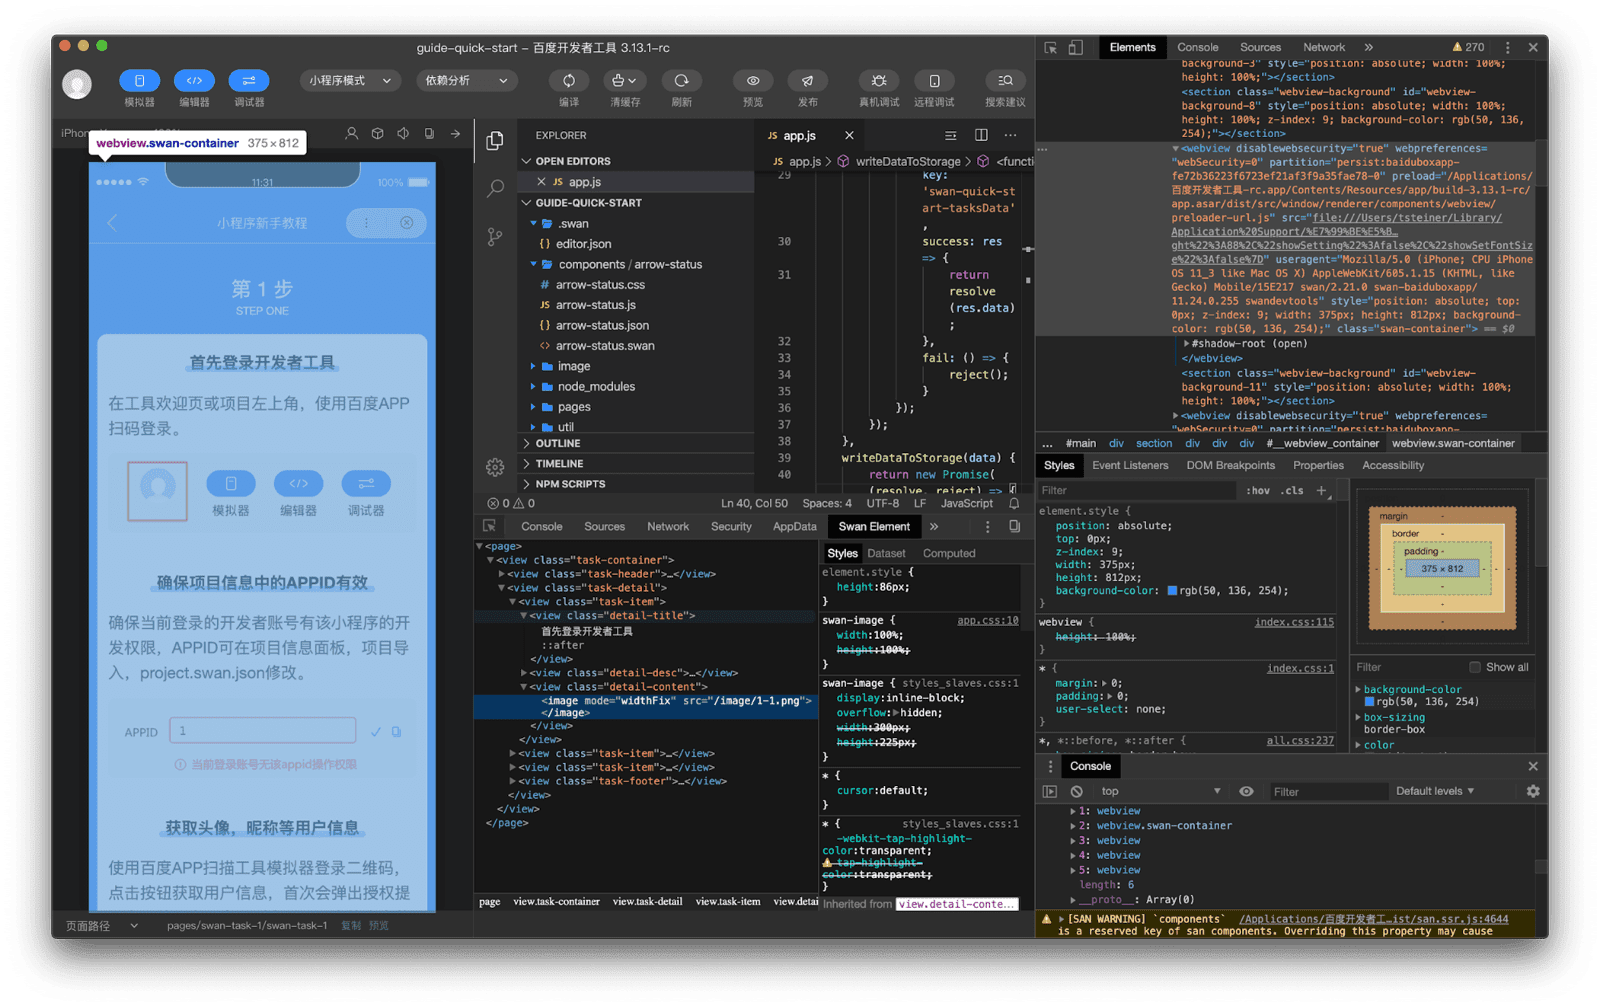
After launching the IDE and loading or creating a (demo) mini app, the first step is always to log in. Usually you just need to scan a QR code with the super app (where you are already logged in) that is generated by the IDE. Very rarely do you have to enter a password. Once you are logged in, the IDE knows your identity and lets you start programming, debugging, testing, and submitting your app for review. In the following, you can see screenshots of the five IDEs mentioned in the paragraph above.
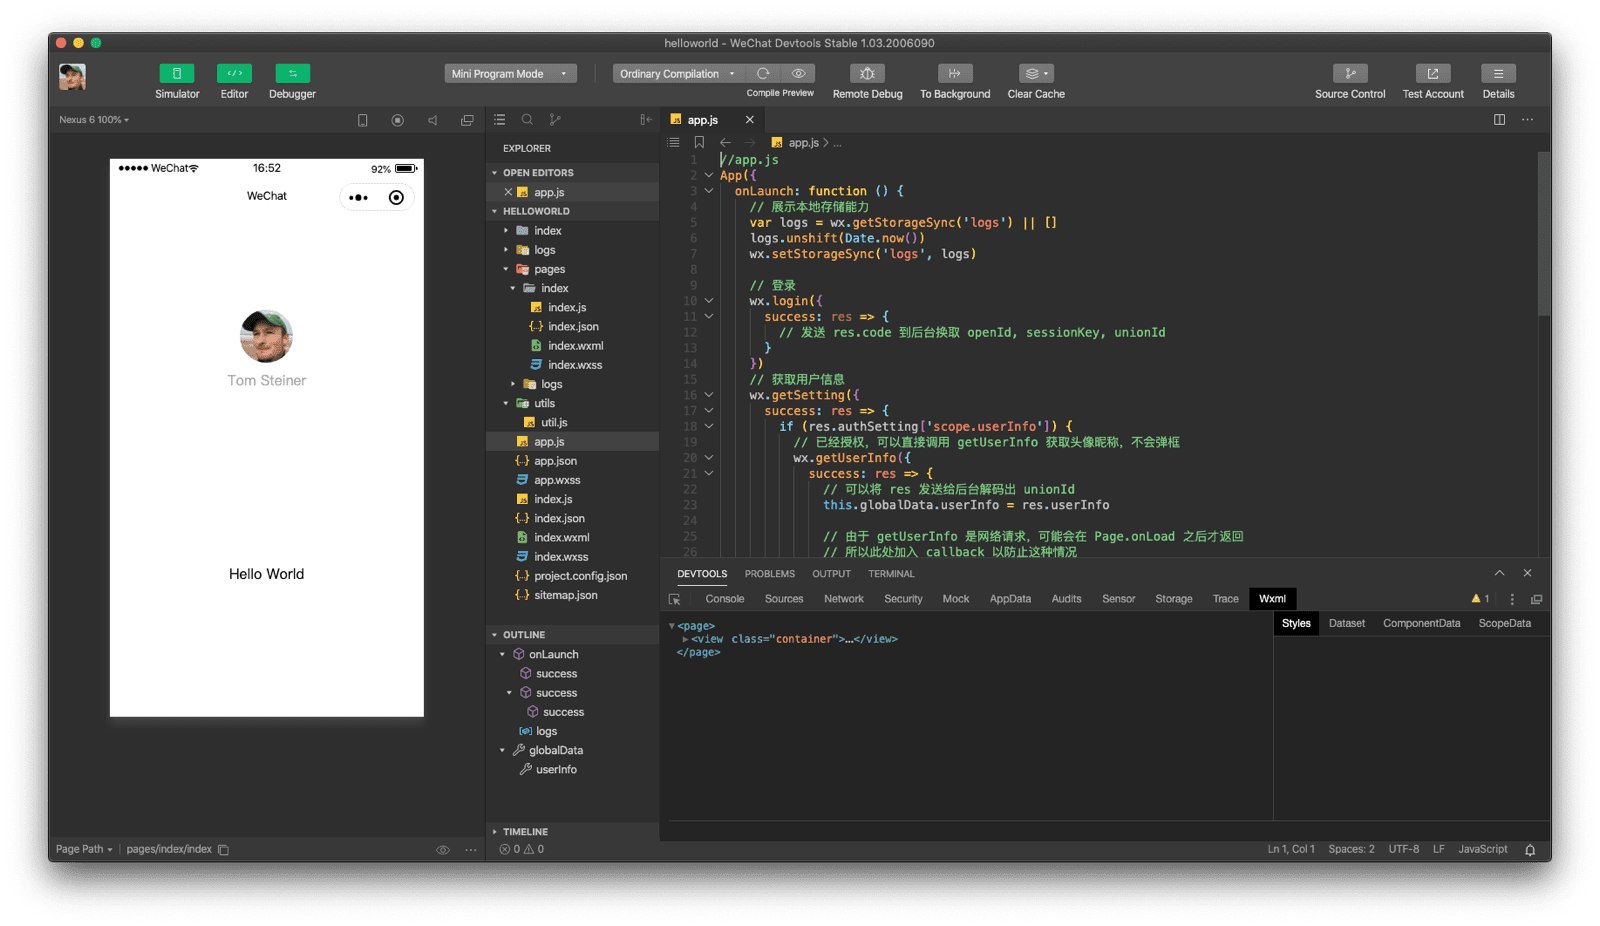
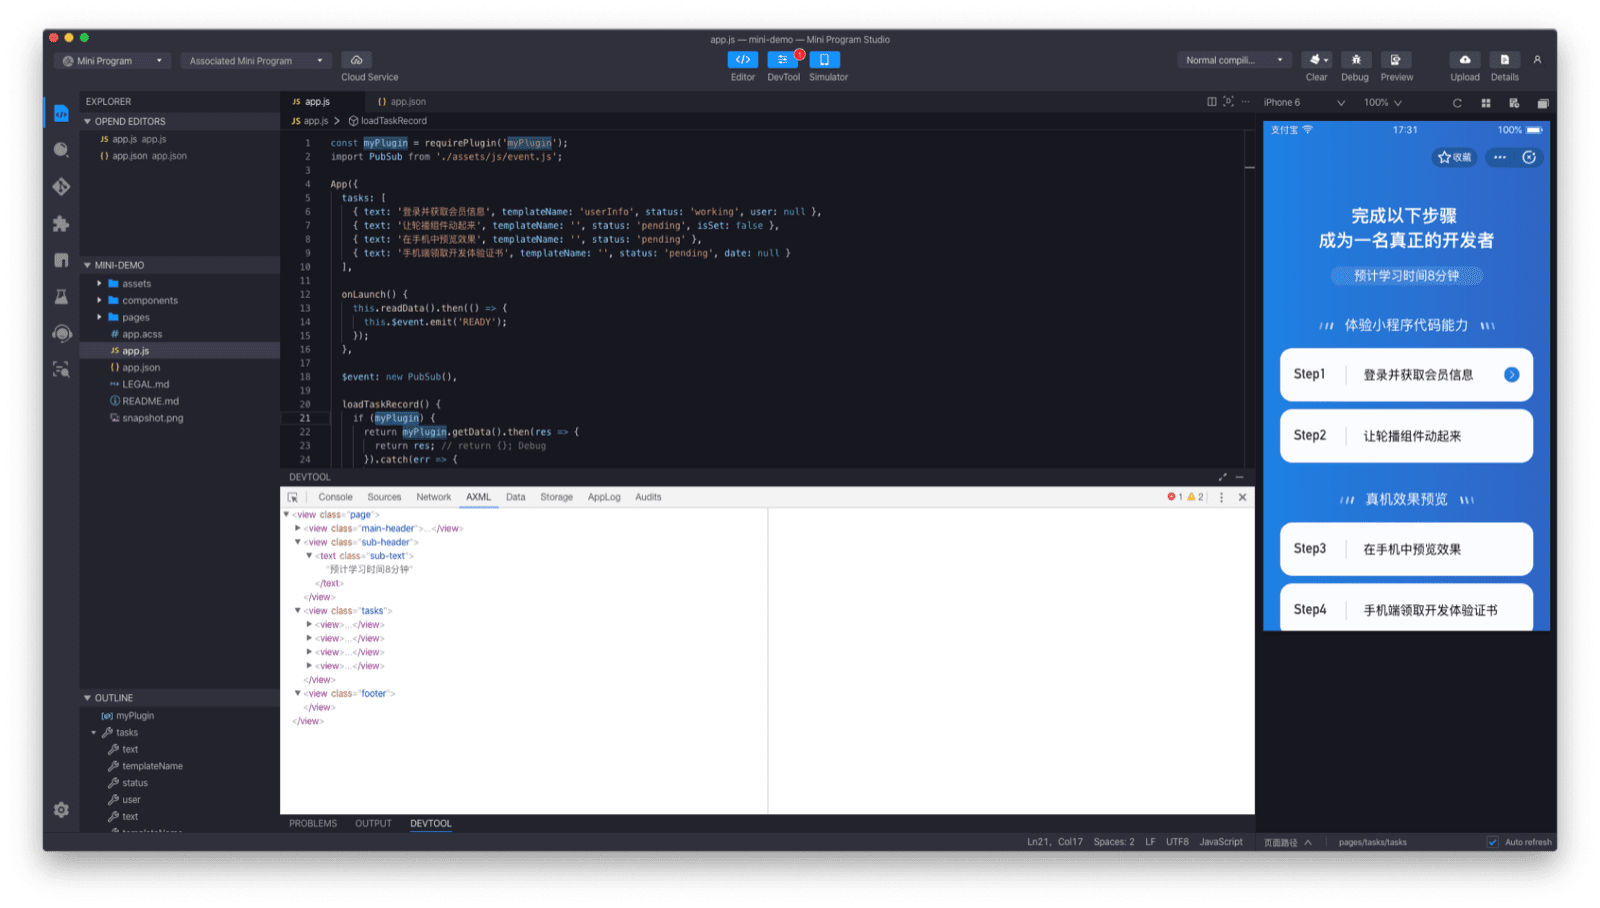
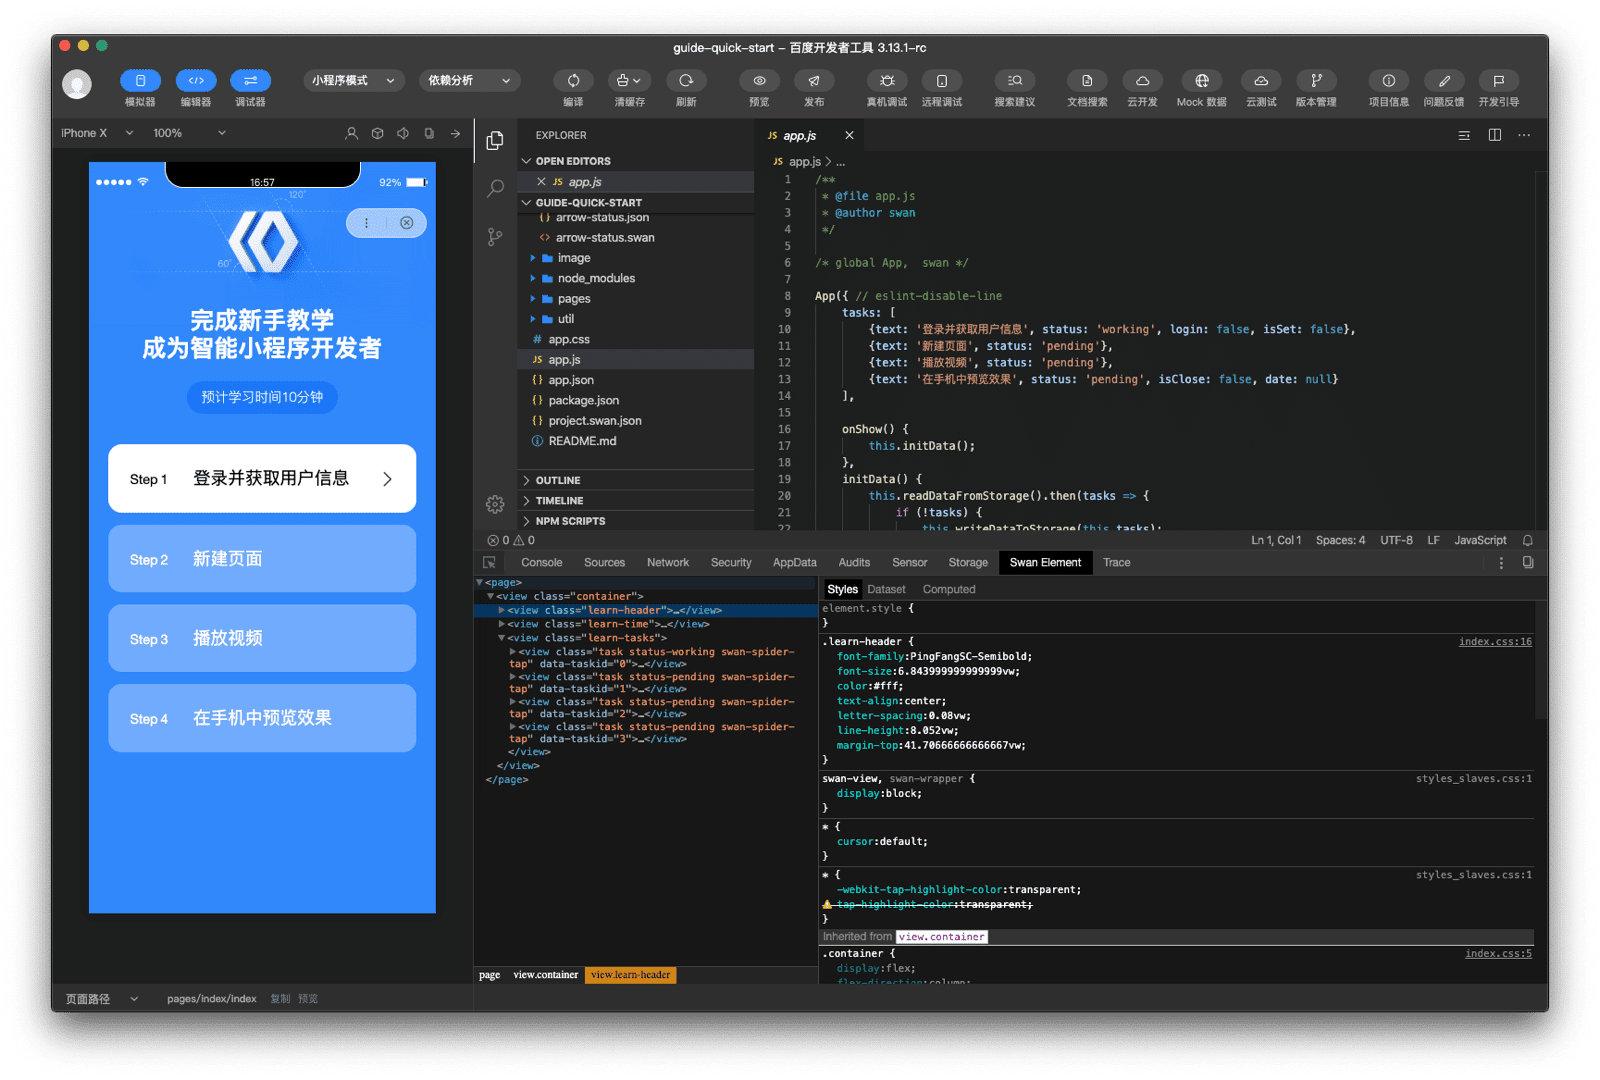
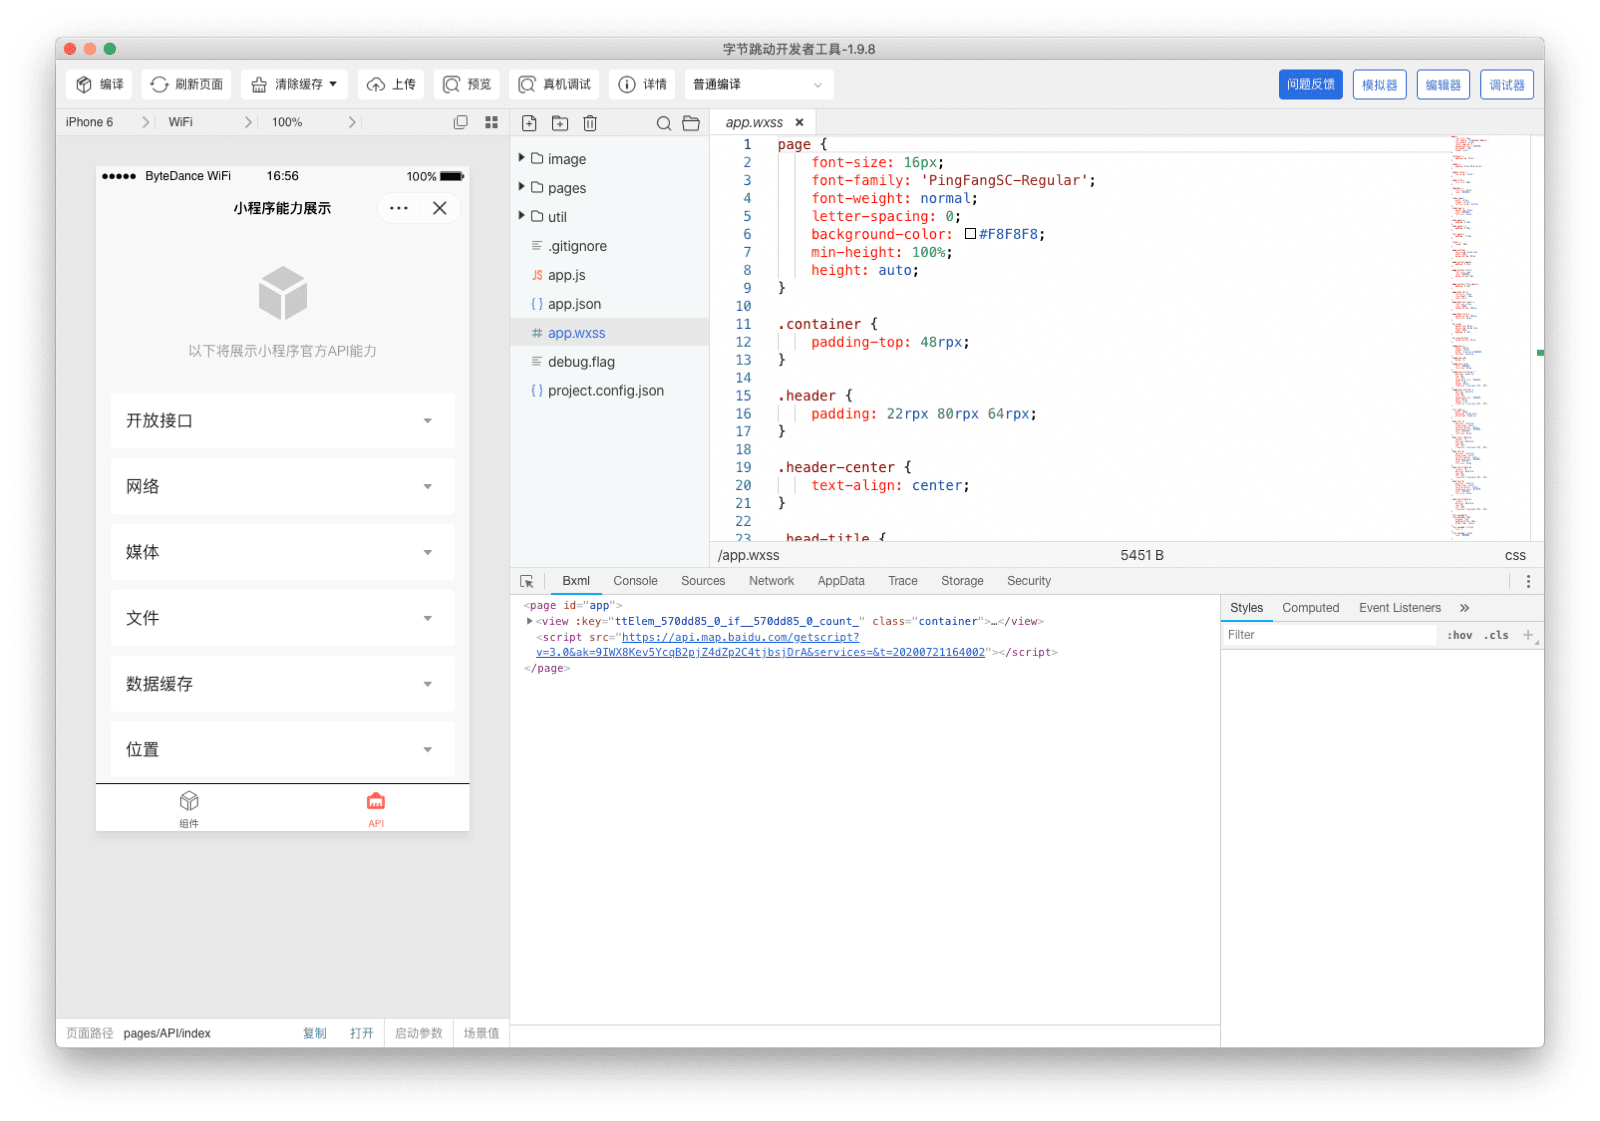
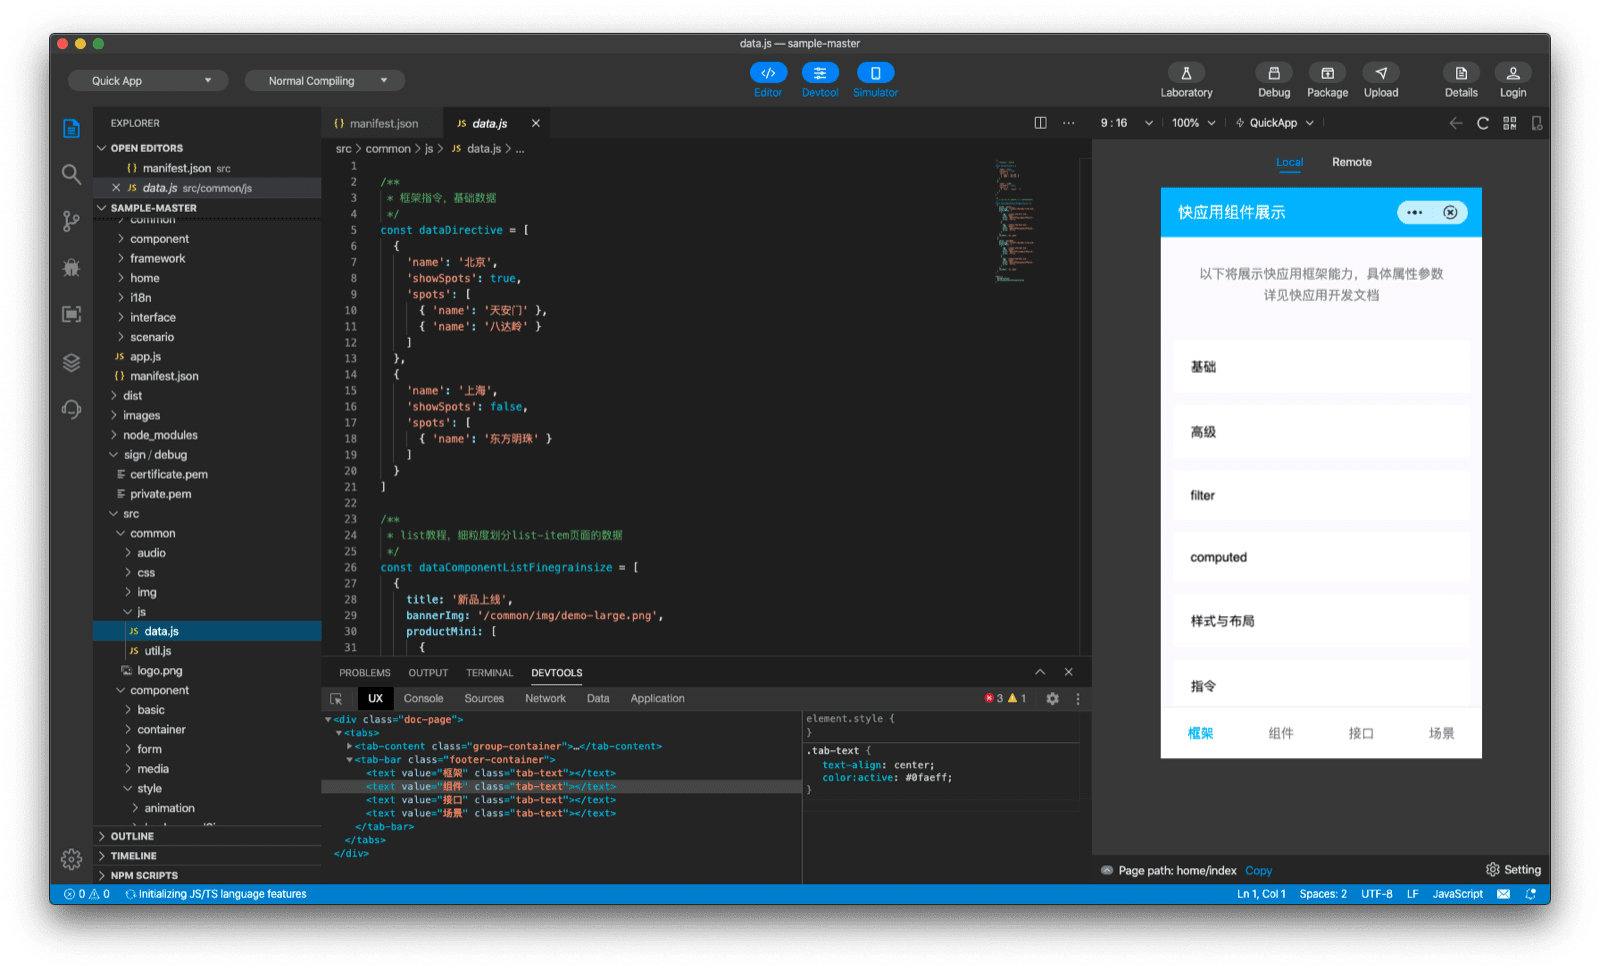
As you can see, the fundamental components of all IDEs are very similar. You always have a code
editor based on the Monaco Editor, the same project
that also powers VS Code. In all IDEs, there is a debugger
based on the Chrome DevTools frontend with
some modifications, more on those later (see Debugger). The IDEs per se are
implemented either as NW.js or as Electron apps,
the simulators in the IDEs are realized as an
NW.js <webview> tag or
Electron <webview> tag, which in turn are based on
a Chromium <webview> tag. If you are interested in
the IDE internals, you can oftentimes simply inspect them with Chrome DevTools with the keyboard
shortcut Control+Alt+I (or
Command+Option+I on Mac).
<webview> tag.
Simulator and real device testing and debugging
The simulator is comparable with what you might know from Chrome DevTools' device mode. You can simulate different Android and iOS devices, change the scale and device orientation, but also simulate various network states, memory pressure, a barcode reading event, unexpected termination, and dark mode.
While the built-in simulator suffices to get a rough feeling for how the app behaves, on-device
testing, like with regular web apps, is irreplaceable. Testing an in-development mini app is just a
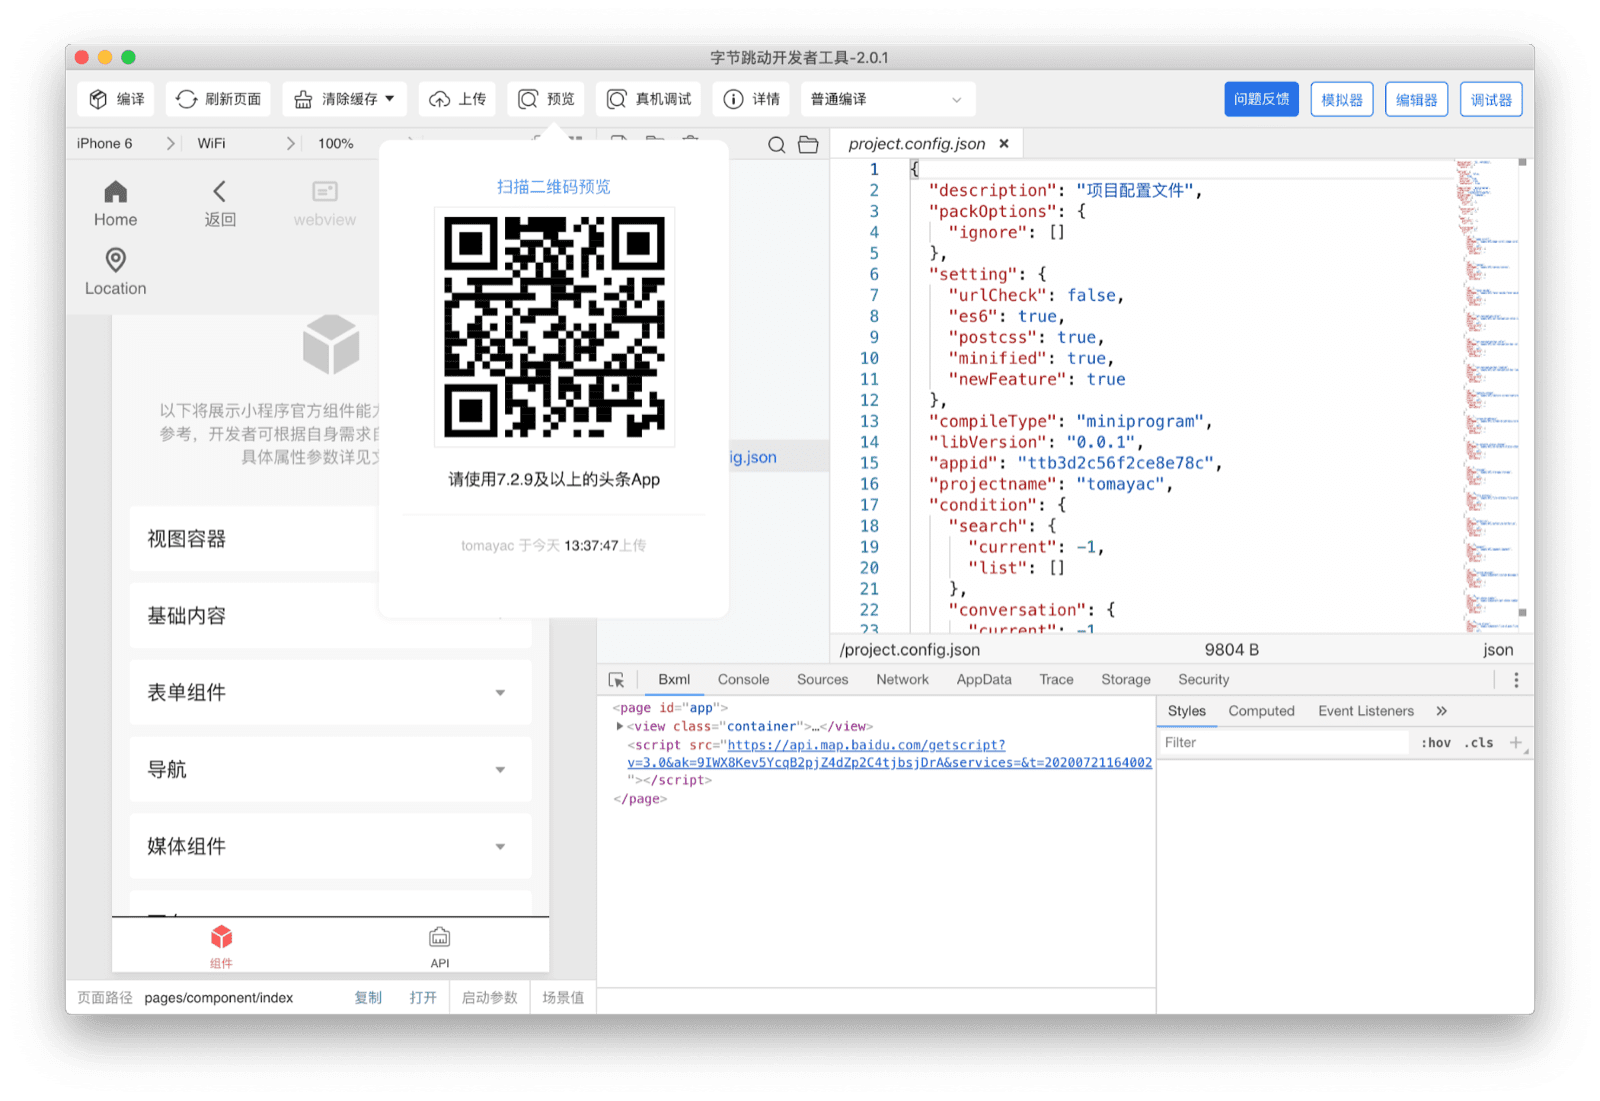
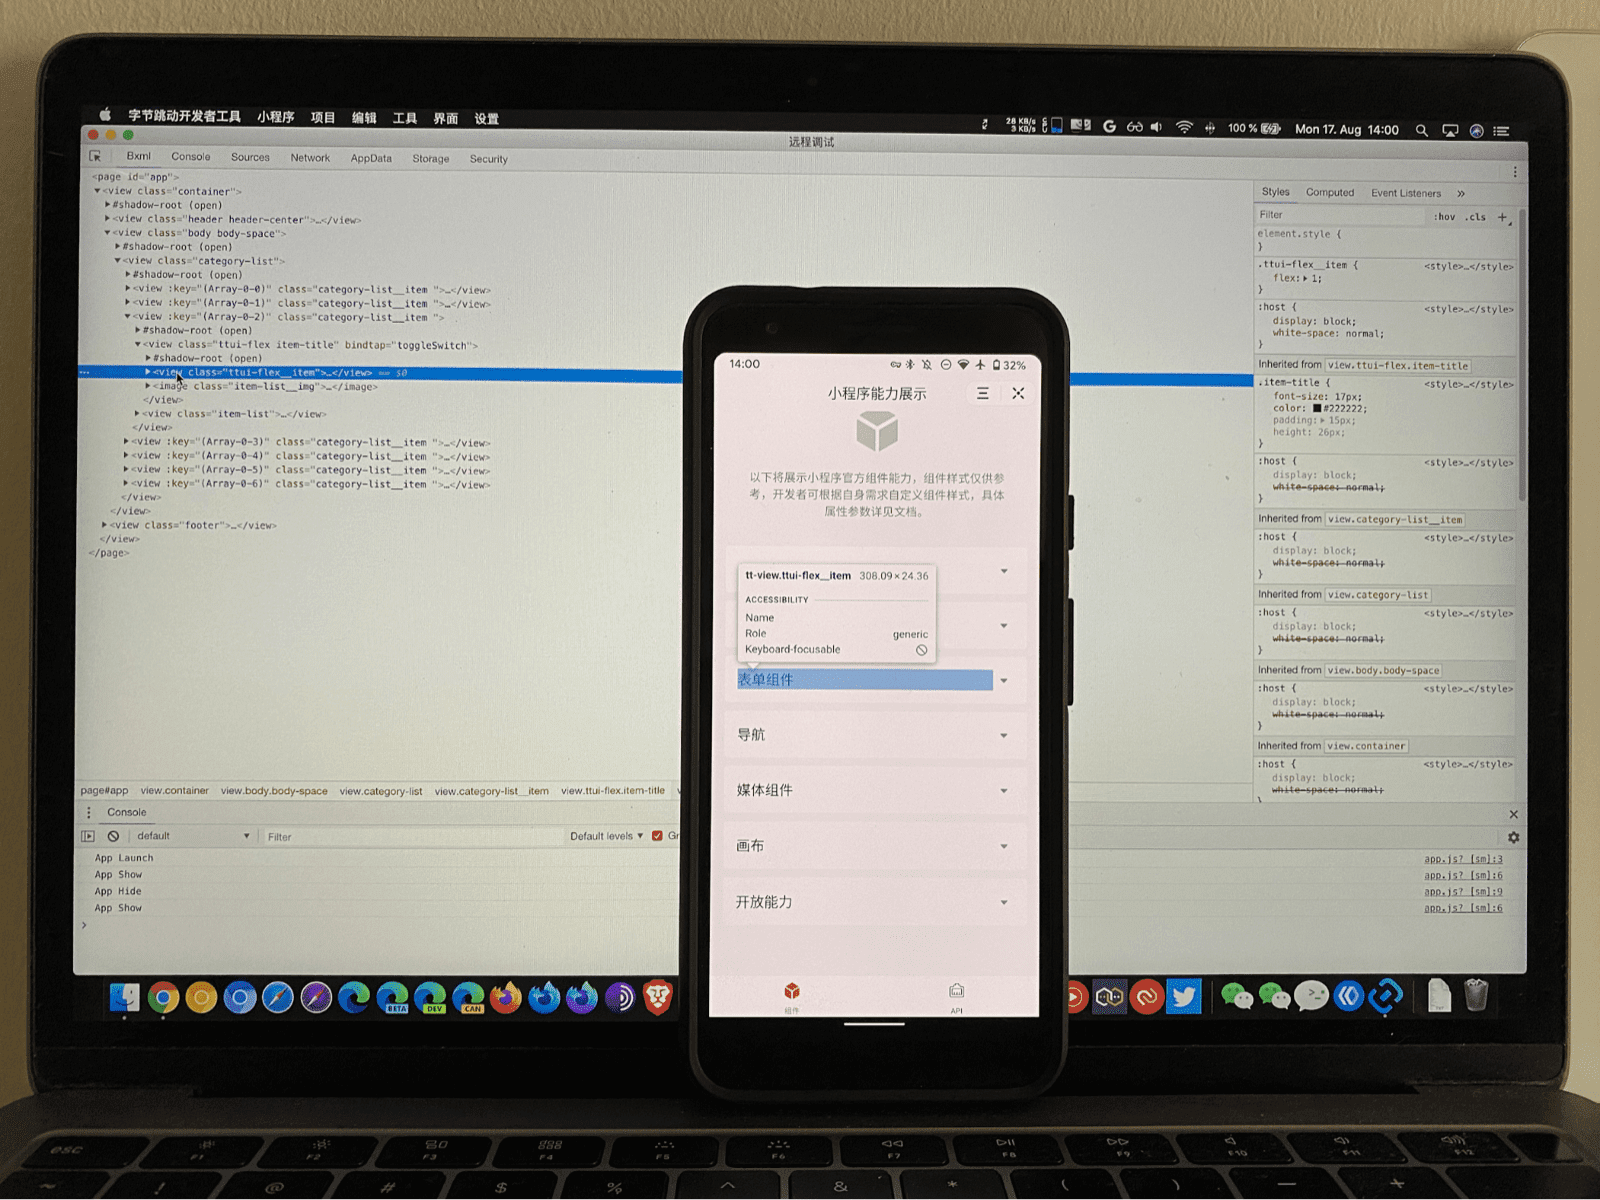
QR code scan away. For example, in ByteDance DevTools, scanning a QR code dynamically generated by the IDE
with a real device leads to a cloud-hosted version of the mini app that can then immediately be
tested on the device. The way this works for ByteDance is that the URL behind the QR code
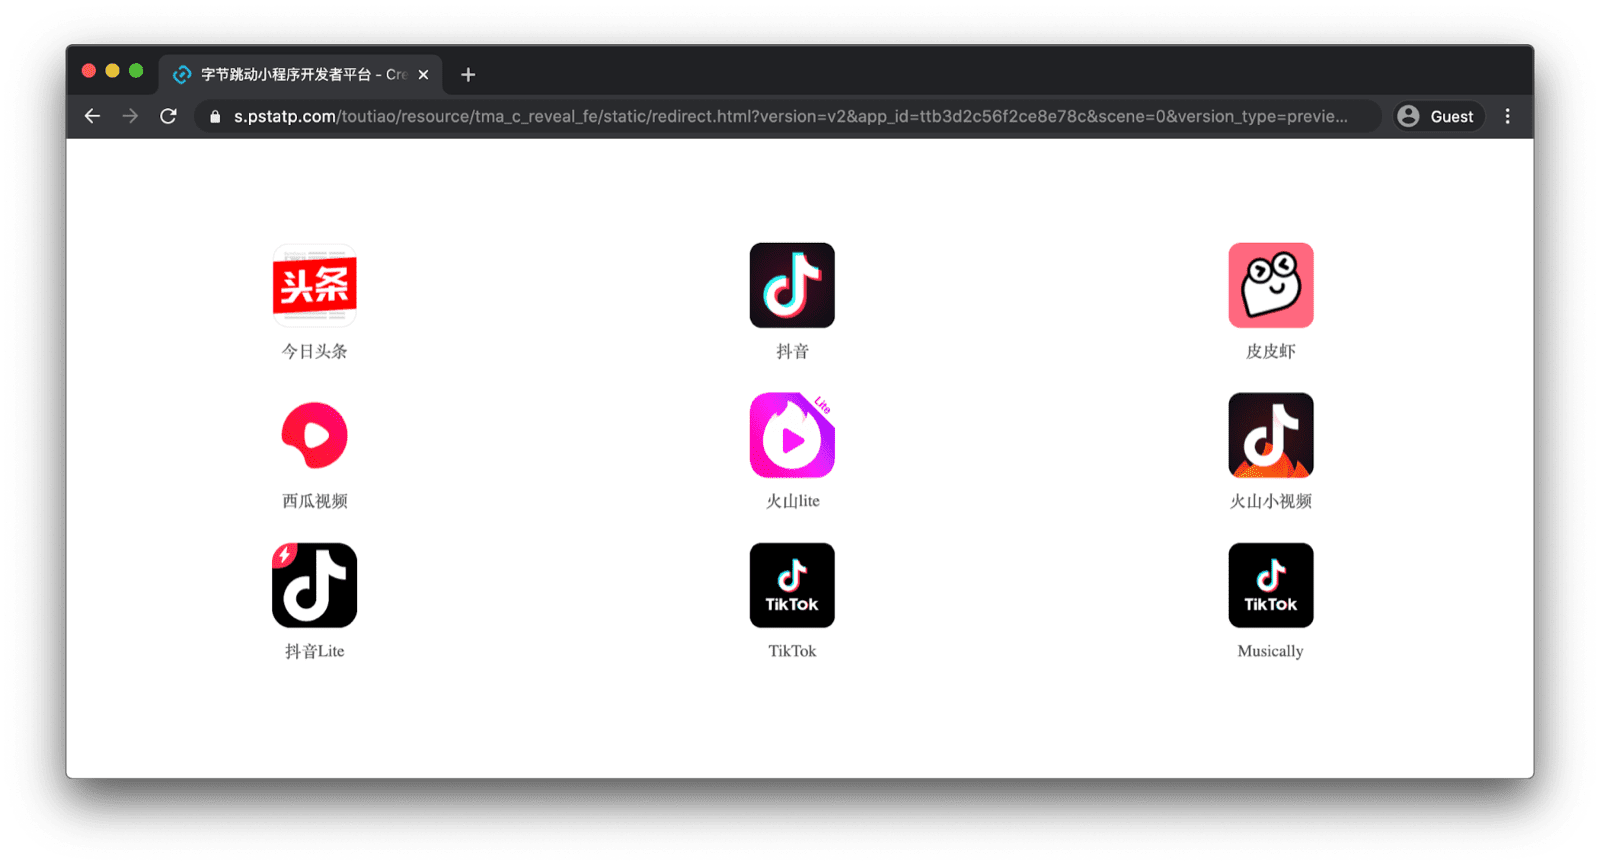
(example) redirects to a hosted page
(example),
that contains links with special URI schemes like, for example, snssdk1128://, to preview the mini
app on the various ByteDance super apps like Douyin or Toutiao
(here is an example).
Other super app providers do not go through an intermediate page, but open the preview directly.
An even more compelling feature is cloud-based preview remote debugging. After simply scanning a special likewise IDE-generated QR code, the mini app opens on the physical device, with a Chrome DevTools window running on the computer for remote debugging.
Debugger
Elements debugging
The mini app debugging experience is very familiar to anyone who has ever worked with Chrome DevTools. There are some important differences, though, that make the workflow tailored to mini apps. Instead of the Chrome DevTools' Elements panel, mini app IDEs have a customized panel that is tailored to their particular dialect of HTML. For example, in the case of WeChat, the panel is called Wxml, which stands for WeiXin Markup Language. In Baidu DevTools, it's called Swan Element. ByteDance DevTools calls it Bxml. Alipay names it AXML, and Quick App references the panel simply as UX. I will dive into these markup languages later.
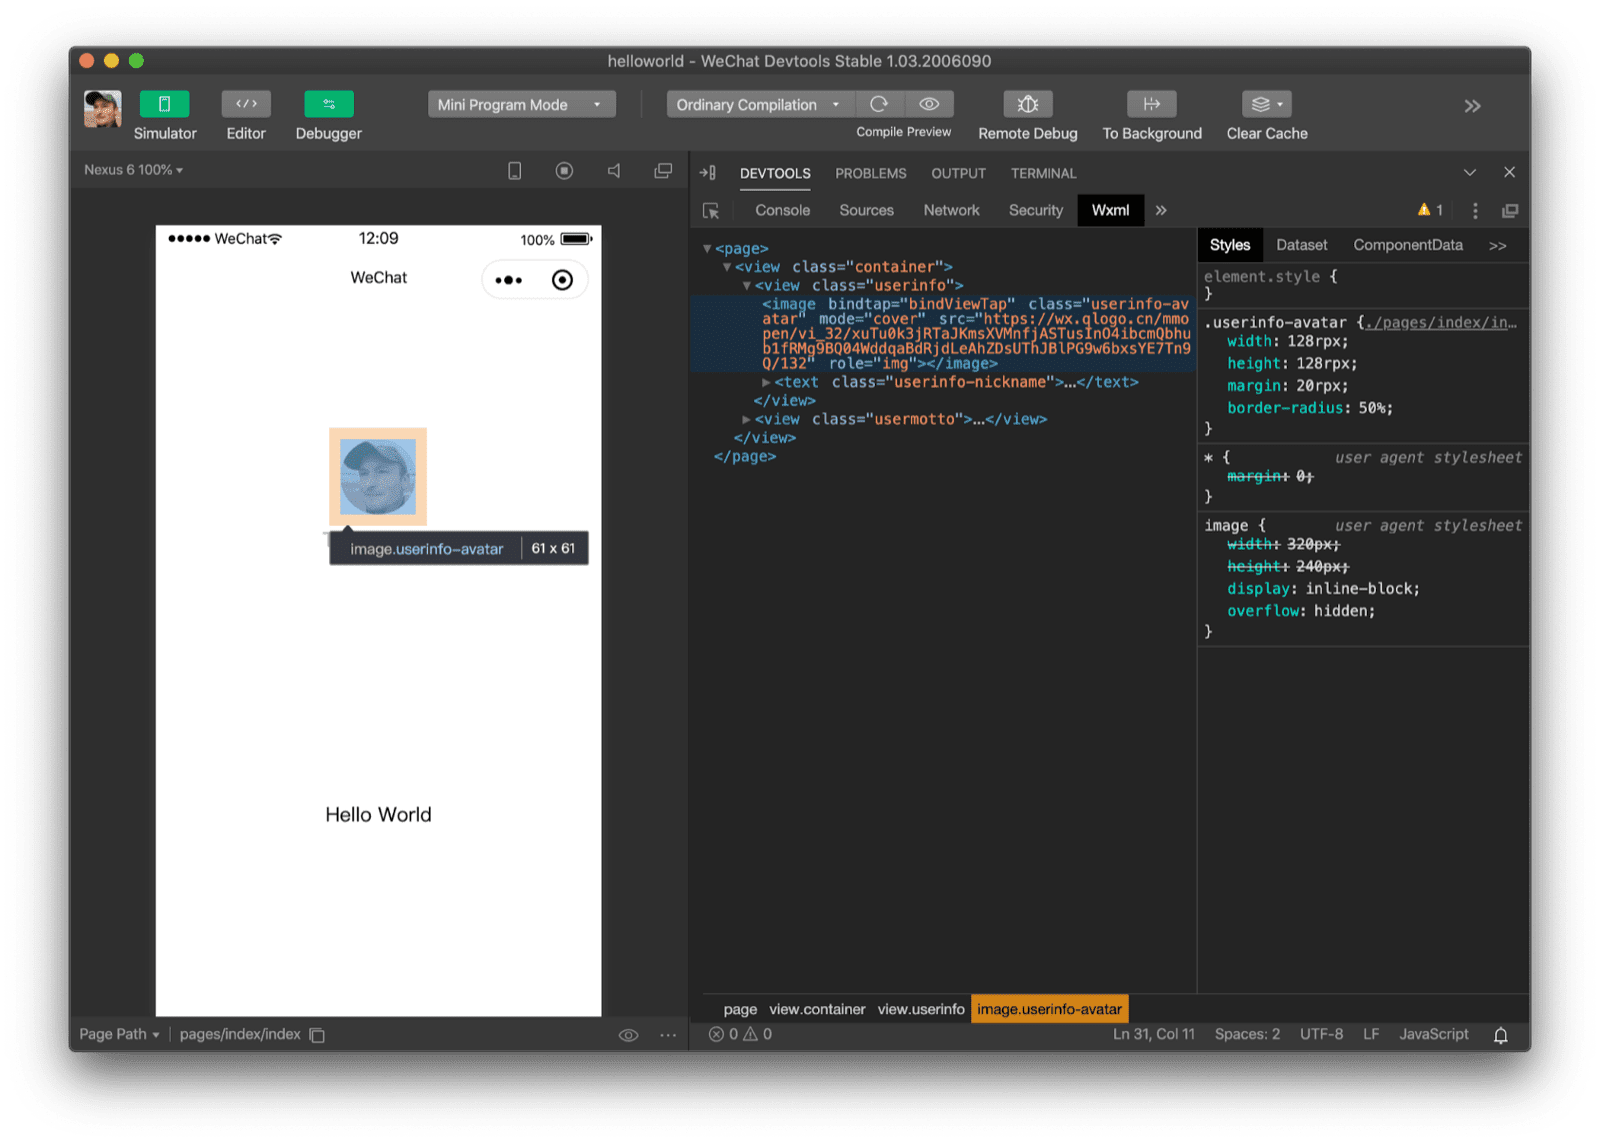
<image> element with WeChat DevTools.
Custom elements under the hood
Inspecting the WebView on a real device via about://inspect/#devices
reveals that WeChat DevTools was deliberately hiding the truth. Where WeChat DevTools showed an
<image>, the actual thing I am looking at is a custom element called <wx-image> with a <div>
as its only child. It is interesting to note that this custom element does not use
Shadow DOM. More on
these components later.
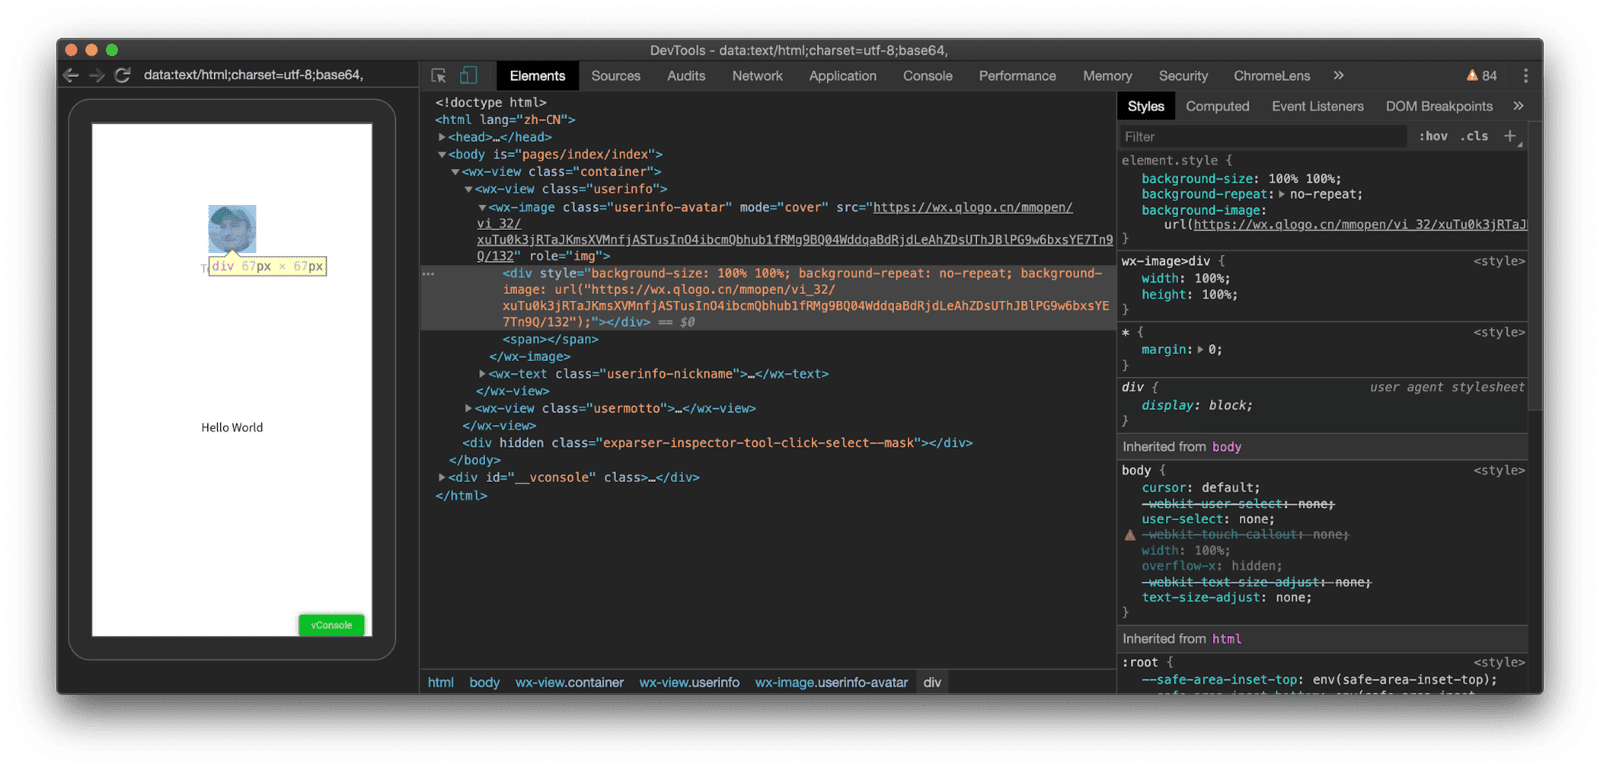
<image> element with WeChat DevTools reveals that it is actually a <wx-image> custom element.
CSS debugging
Another difference is the new length unit rpx for responsive pixel in the various dialects of CSS
(more on this unit later). WeChat DevTools uses device-independent CSS length units to
make developing for different device sizes more intuitive.
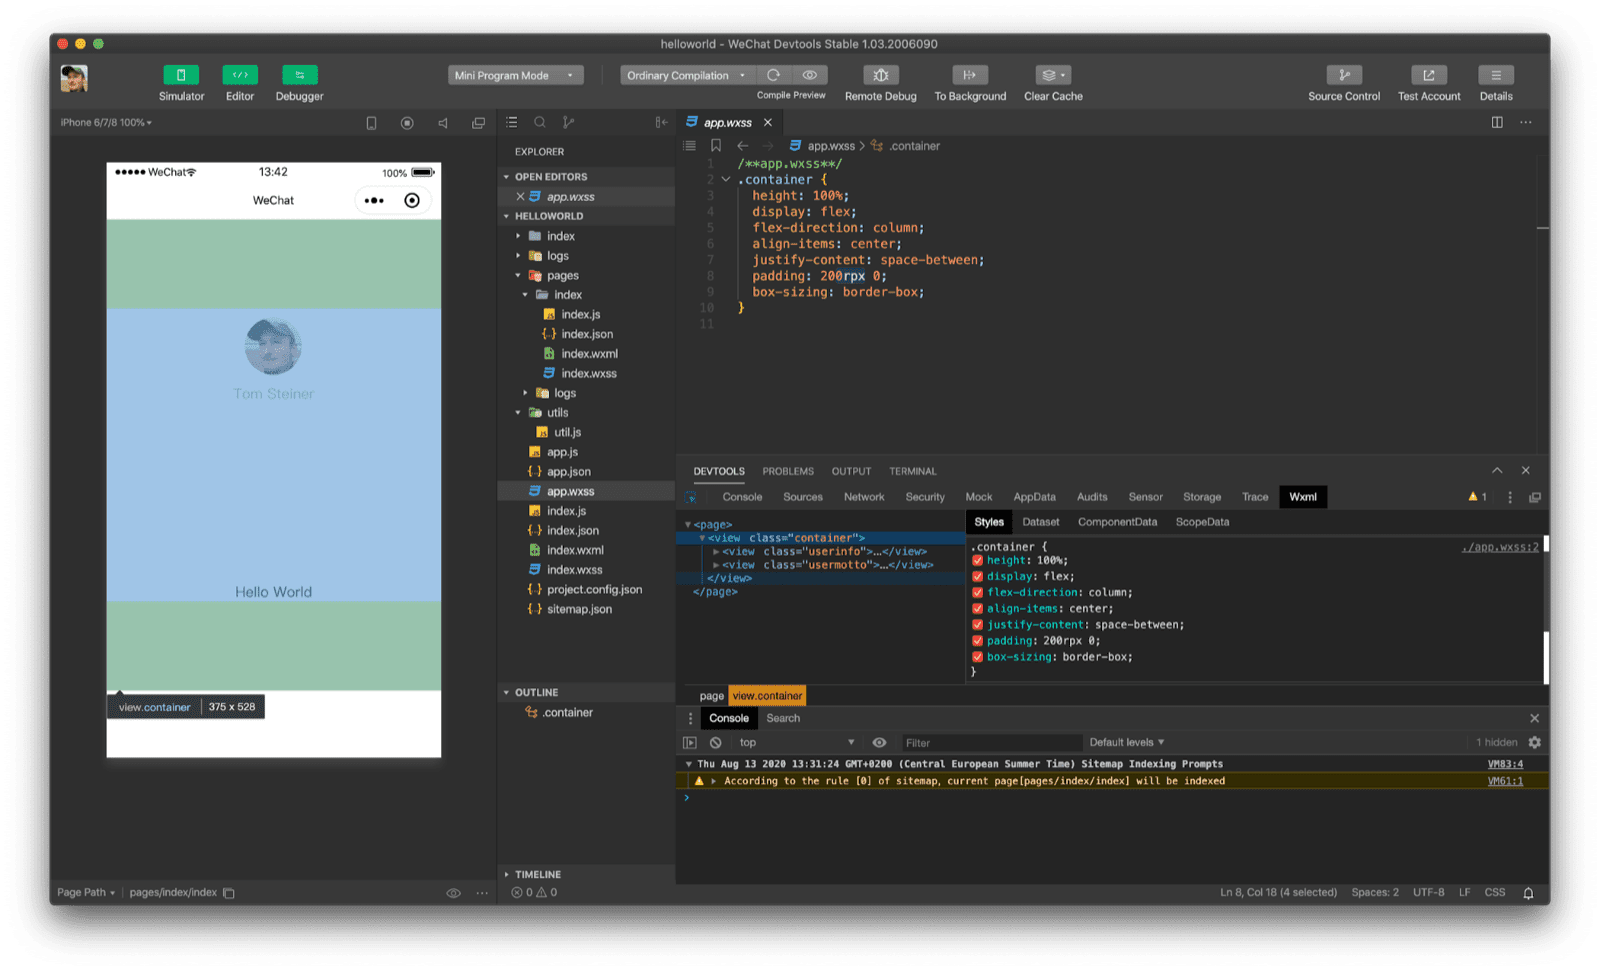
200rpx 0) of a view with WeChat DevTools.
Performance auditing
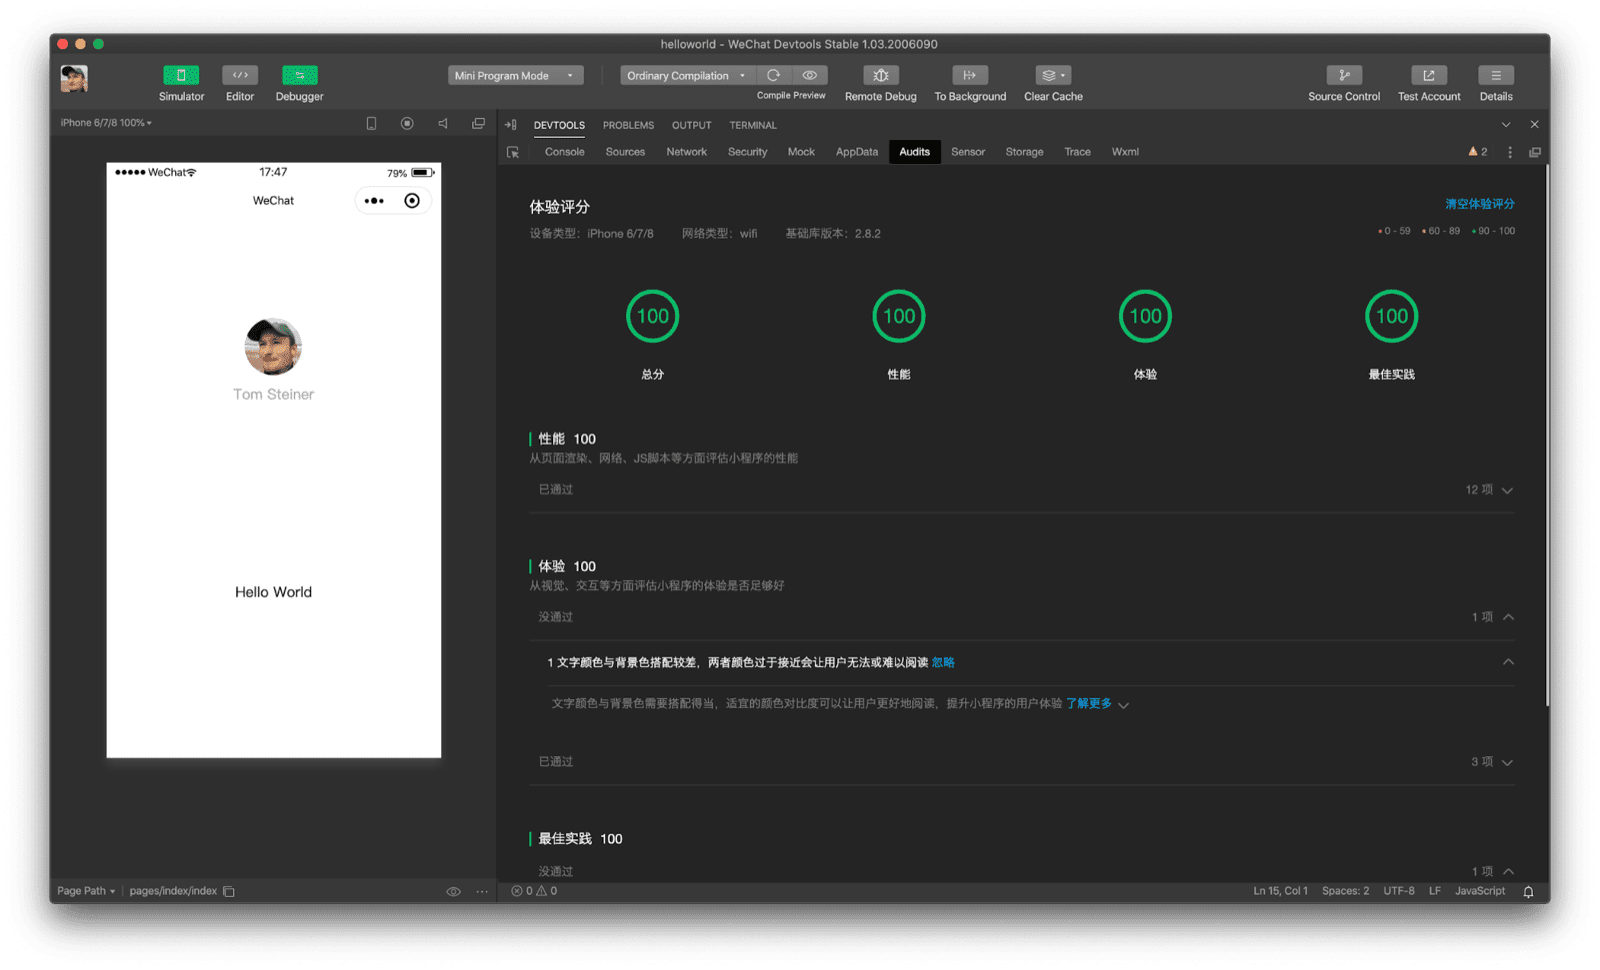
Performance is front and center for mini apps, so it is no surprise that WeChat DevTools and some other DevTools have an integrated Lighthouse-inspired auditing tool. The focus areas of the audits are Total, Performance, Experience, and Best Practice. The view of the IDE can be customized. In the screenshot below I have temporarily hidden the code editor to have more screen real estate for the audit tool.
API mocking
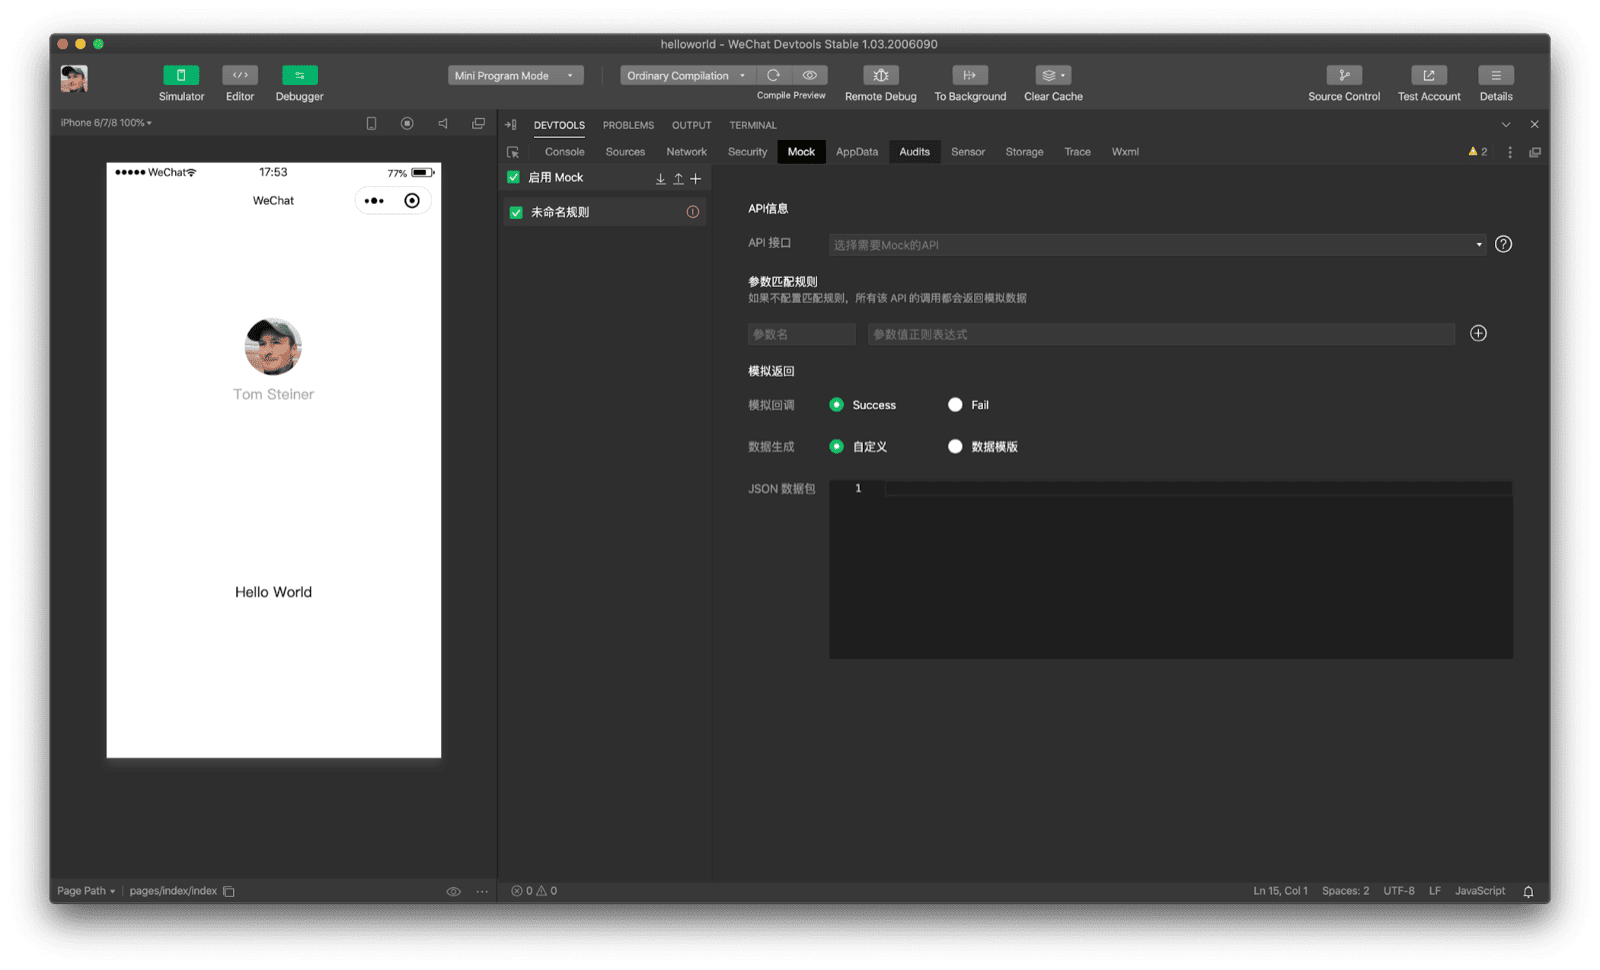
Rather than requiring the developer to set up a separate service, mocking API responses is directly part of WeChat DevTools. Via an easy-to-use interface the developer can set up API endpoints and the desired mock responses.
Acknowledgements
This article was reviewed by Joe Medley, Kayce Basques, Milica Mihajlija, Alan Kent, and Keith Gu.

