

JavaScript is often a trigger for visual changes. Sometimes it makes those changes directly through style manipulations, and sometimes through calculations that result in visual changes, like searching or sorting data. Badly-timed or long-running JavaScript can be a common cause of performance issues, and you should look to minimize its impact where you can.
Style calculation
Changing the DOM by adding and removing elements, changing attributes, classes, or playing animations causes the browser to recalculate element styles and, in many cases, the layout of part or all of the page. This process is called style calculation.
The browser starts calculating styles by creating a set of matching selectors to determine which classes, pseudo-selectors, and IDs apply to any given element. Then, it processes the style rules from the matching selectors and figures out what final styles the element has.
The role of style recalculation in interaction latency
Interaction to Next Paint (INP) is a user-centric runtime performance metric that assesses a page's overall responsiveness to user input. It measures interaction latency from when the user interacts with the page until the browser paints the next frame showing the corresponding visual updates to the user interface.
A significant component of an interaction is the time it takes to paint the next frame. Rendering work done to present the next frame is made up of many parts, including calculation of page styles that occur just before layout, paint, and compositing work. This guide focuses on style calculation costs, but reducing any part of the interaction's total rendering duration also reduces its total latency.
Reduce the complexity of your selectors
Simplifying CSS selectors can help speed up your page's style calculations. The simplest selectors reference an element in CSS with just a class name:
.title {
  /* styles */
}
But, as any project grows, it likely needs more complex CSS, and you might end up with selectors that look like this:
.box:nth-last-child(-n+1) .title {
  /* styles */
}
To determine how these styles apply to the page, the browser has to effectively
ask "is this an element with a class of title with a parent of a class of
box that's the minus-nth-plus-1 child of its parent element? Figuring this out
can take some time for the browser. To simplify this, you can change the
selector to be a more specific class name:
.final-box-title {
  /* styles */
}
These replacement class names might seem awkward, but they make the browser's
job a lot simpler. In the previous version, for example, for the browser to know
an element is the last of its type, it must first know everything about all the
other elements to determine whether any elements that come after it that could
be the nth-last-child. This can be a lot more computationally expensive than
matching a selector to an element on the sole basis of its class name.
Reduce the number of elements being styled
Another performance consideration—and often a more important one than selector complexity—is the amount of work that needs to happen when an element changes.
In general terms, the worst case cost of calculating the computed elements style is the number of elements multiplied by the selector count, because the browser needs to check each element at least once against every style to see if it matches.
Style calculations can target a few elements directly instead of invalidating the whole page. In modern browsers, this tends to be less of an issue because the browser doesn't always need to check all the elements a change might affect. Older browsers, on the other hand, aren't always optimized for such tasks. Where you can, you should reduce the number of invalidated elements.
Measure your style recalculation cost
There are a couple of ways you can measure the cost of style recalculation in the browser. Each of them depends on whether want to measure it in the browser in your development environment, or if you want to measure how long this process takes for real users on your website.
Measure style recalculation cost in Chrome DevTools
One way to measure the cost of style recalculations is to use the performance panel in Chrome DevTools. Do the following to get started:
- Open DevTools.
- Navigate to the Performance tab.
- Check the Selector stats checkbox (optional).
- Click Record.
- Interact with the page.
When you stop recording, you'll see something like the following image:
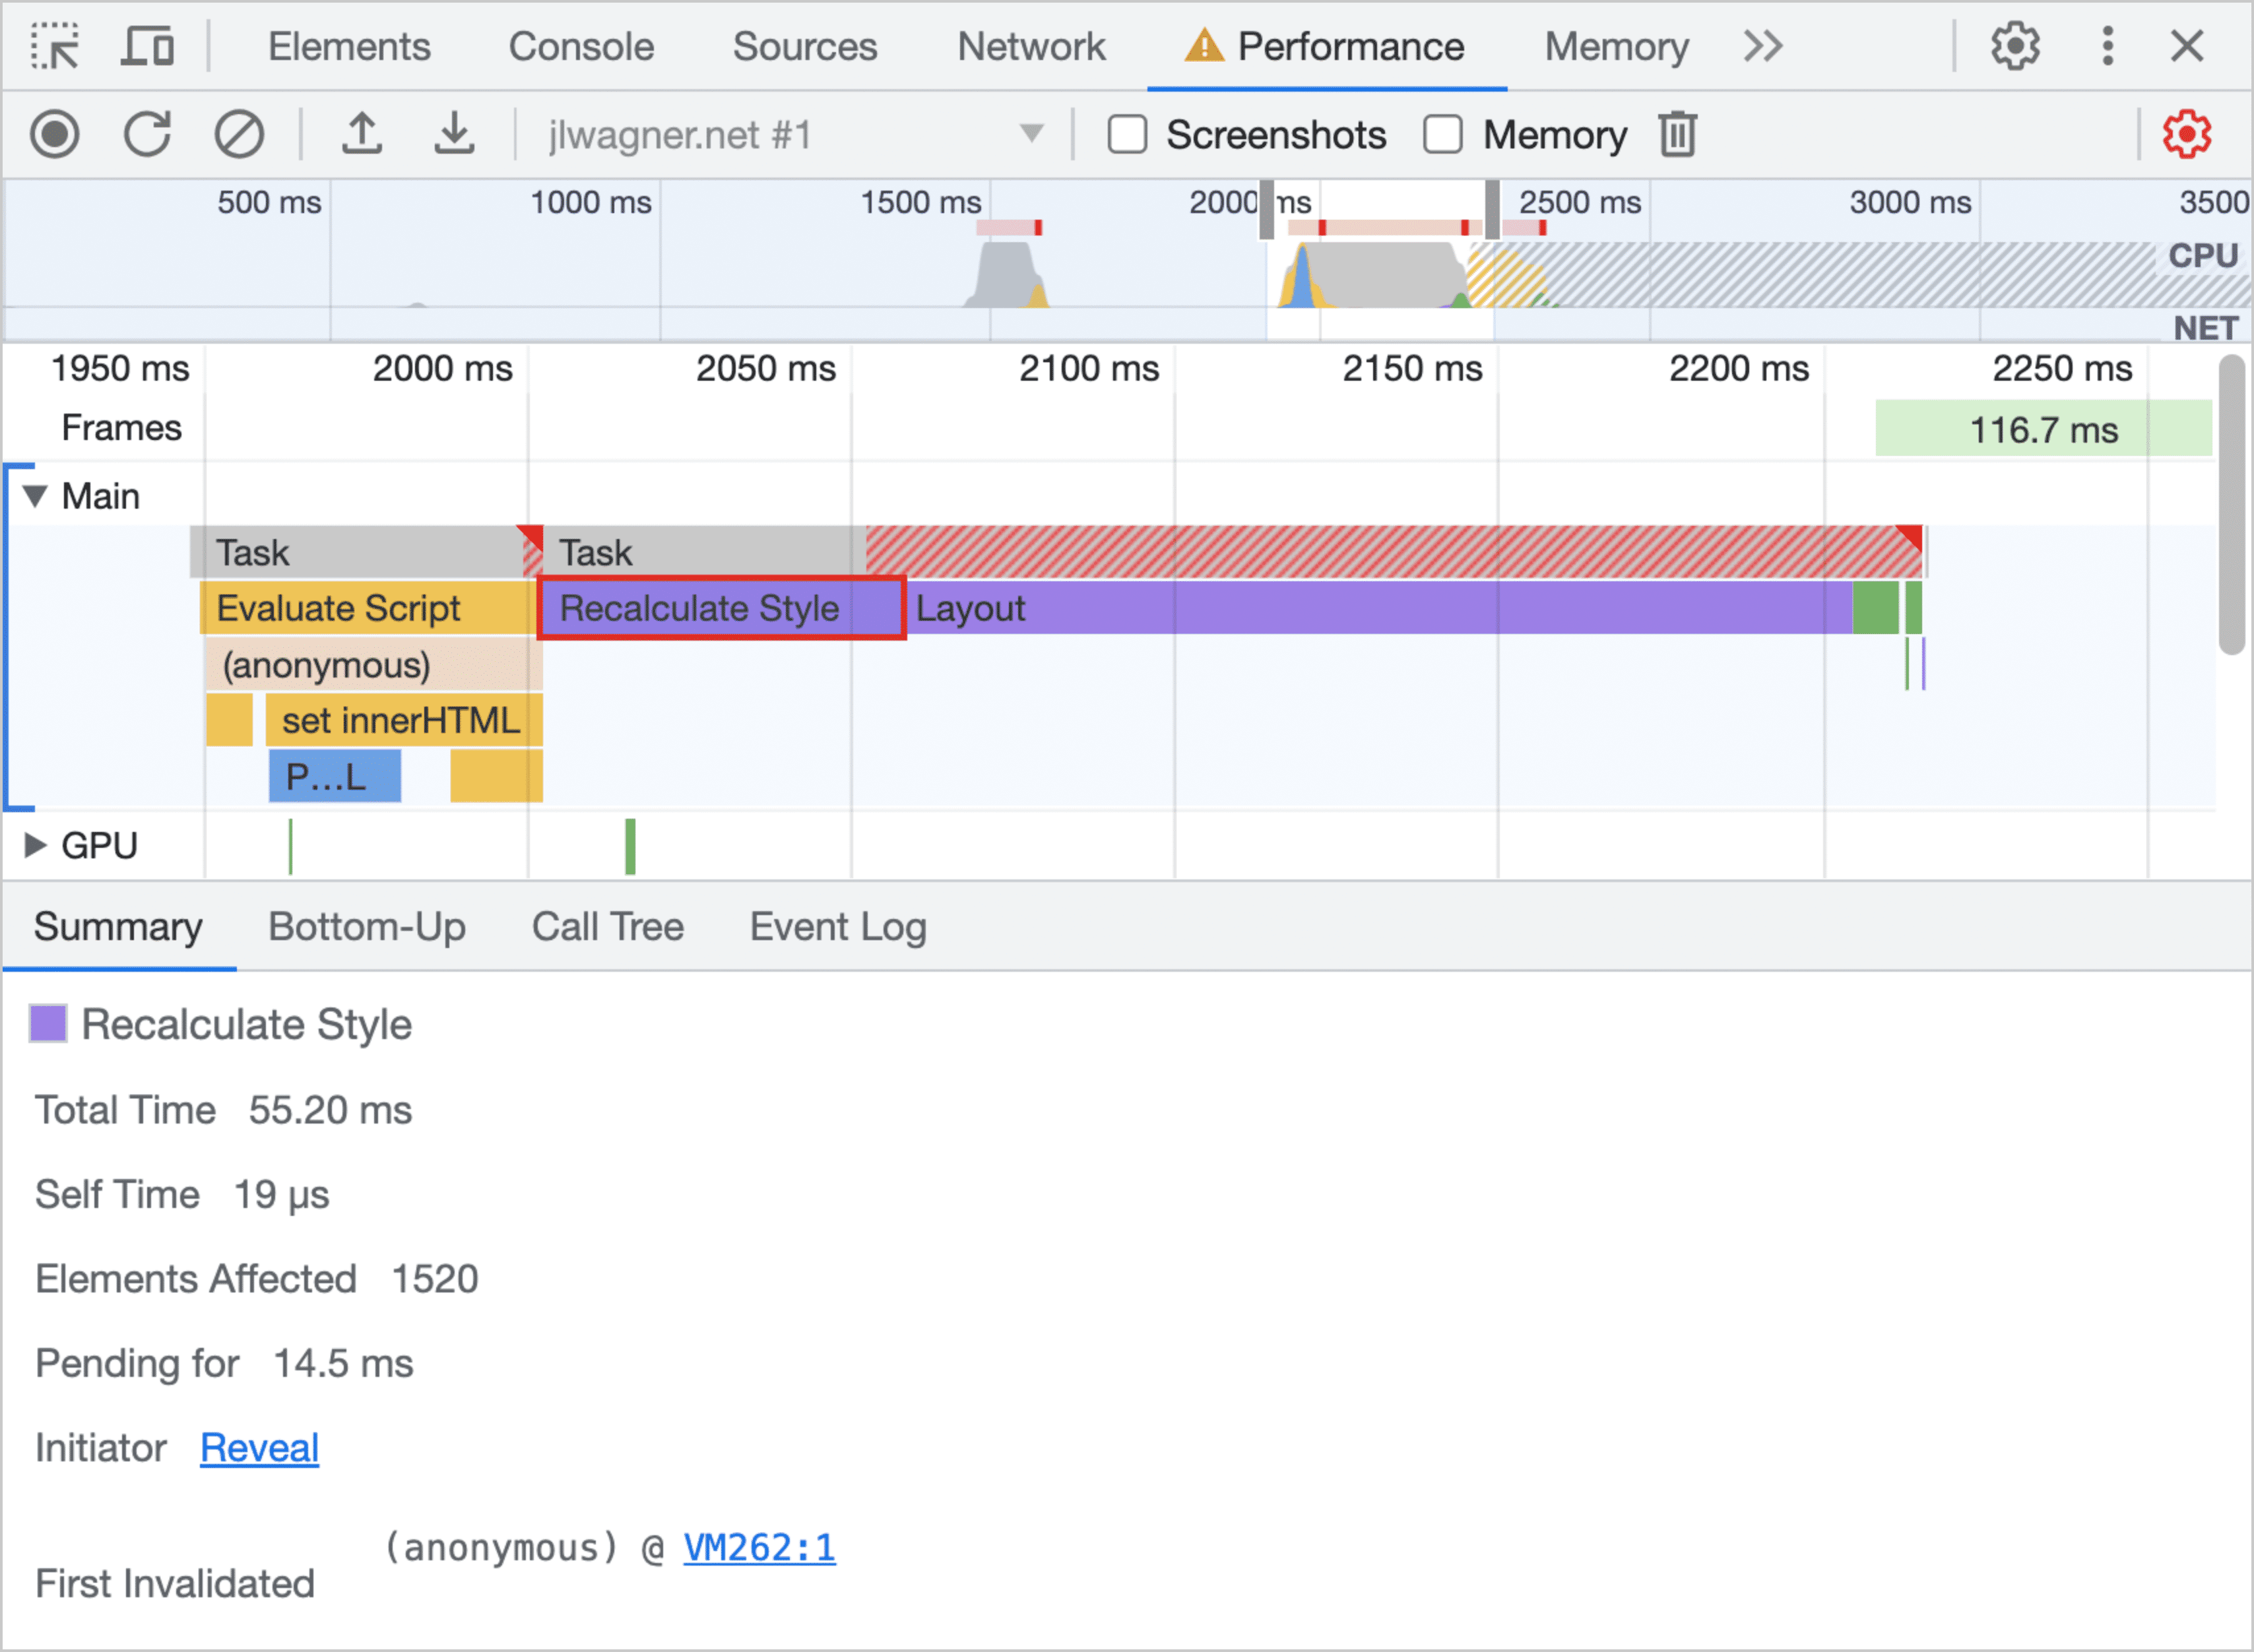
The strip at the top is a miniature flame chart that also plots frames per second. The closer the activity is to the bottom of the strip, the faster frames are being painted by the browser. If you see the flame chart leveling out at the top with red bars above it, then you have work that's causing long-running frames.
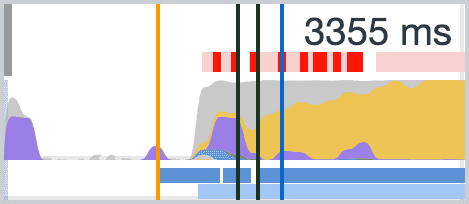
Long-running frames during an interaction like scrolling are worth a closer look. If you see a large purple block, zoom in on the activity and select any work labeled Recalculate Style to get more information on potentially expensive style recalculation work.
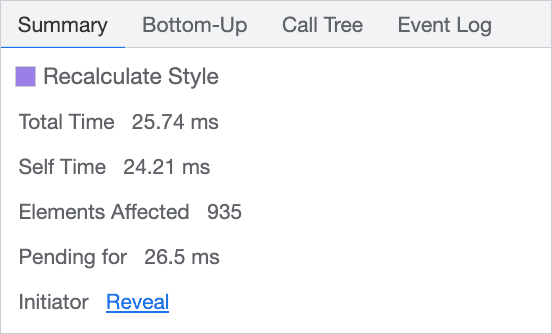
Clicking the event shows its call stack. If the rendering work was caused by a user interaction, it calls out the JavaScript that triggered the style change. It also shows the number of elements that the change affects—just over 900 elements in this case—and how long the style calculation took. You can use this information to start trying to find a fix in your code.
If you checked the Selector stats checkbox in the Performance Panel settings before doing a trace, then the bottom panel in the trace will have an additional tab by the same name.
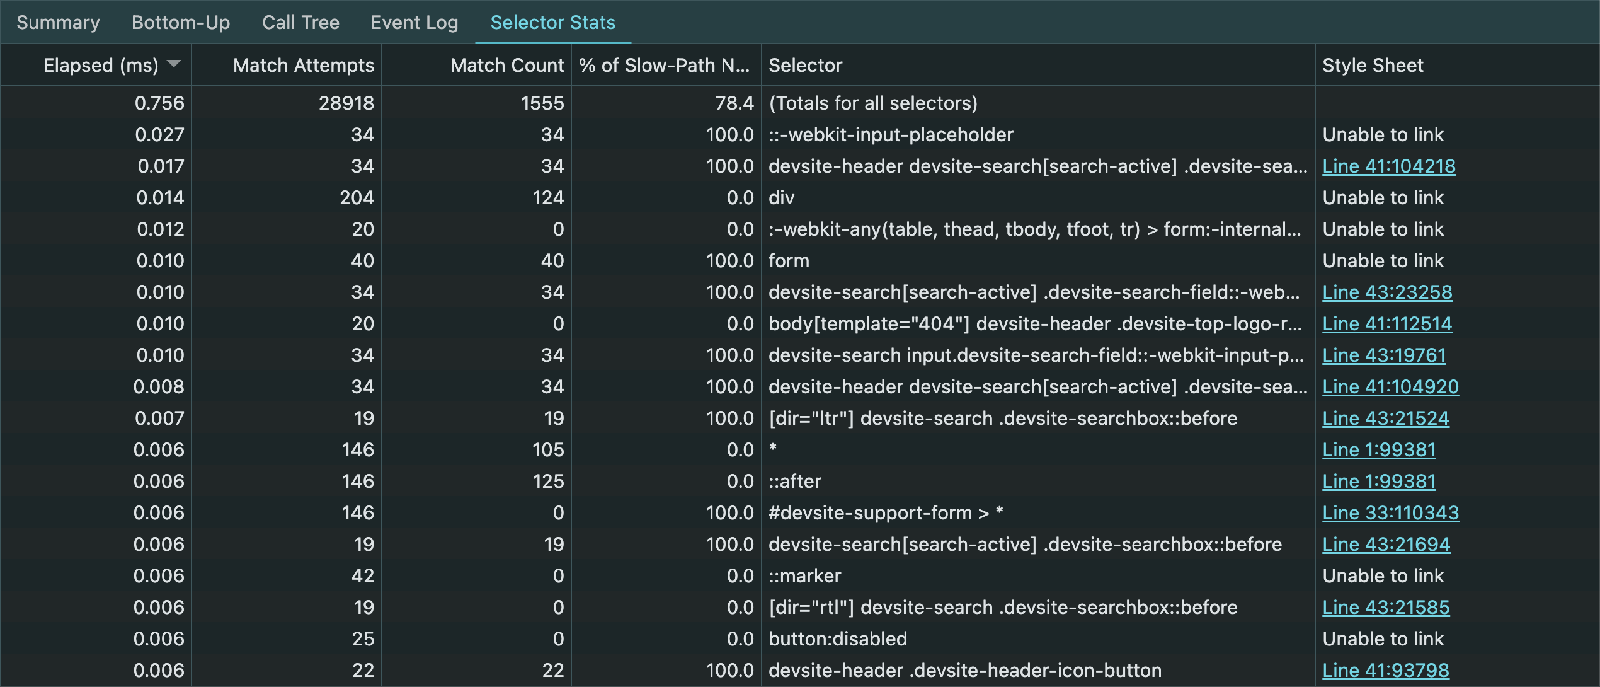
This panel provides useful data on the relative cost of each selector, allowing you to identify expensive CSS selectors.
For more information, see the CSS Selector Stats documentation.
Measure style recalculation cost for real users
If you're curious to know how long it takes for style recalculation to occur for
real users of your website, the Long Animation Frames API
gives you the tools necessary to do so. Data from this API was added to the
web-vitals JavaScript library,
including style recalculation time.
If you suspect that the presentation delay of an interaction is the primary contributor to a page's INP, you'll want to figure out how much of that time is spent recalculating styles on the page. For more information, read about how to measure style recalculation time in the field.