Learn about the latest in PageSpeed Insights to help you better measure and optimize your page and site quality.
Over the years, PageSpeed Insights (PSI) has evolved into a one-stop source for both field and lab data. It integrates information from the Chrome UX Report (CrUX) and Lighthouse diagnostics to provide insights that help improve the performance of your website.
Today, we are excited to announce an updated version of PSI! While it is a critical element in our speed tooling suite, the PSI code base was ten years old, contained a lot of legacy code, and was due for a redesign. We used this as an opportunity to address interface-related issues in PSI which have sometimes made it difficult for users to navigate the report. Our primary goals were to:
- Make the UI more intuitive by clearly differentiating between data derived from a synthetic environment and data collected from users in the field.
- Clearly communicate how the Core Web Vitals assessment is calculated in the UI.
- Modernize the look and feel of PSI, leveraging Material Design.
This post introduces the new features in PSI which will be released later this year.
What's new?
The PSI UI redesign aims to improve the presentation of the report data and add clarity and granularity to the data available in the report. The new UI is aimed to be more intuitive and helps developers quickly discover lab and field performance insights for their pages. The fundamental changes to the UI include:
Clear separation of field and lab data
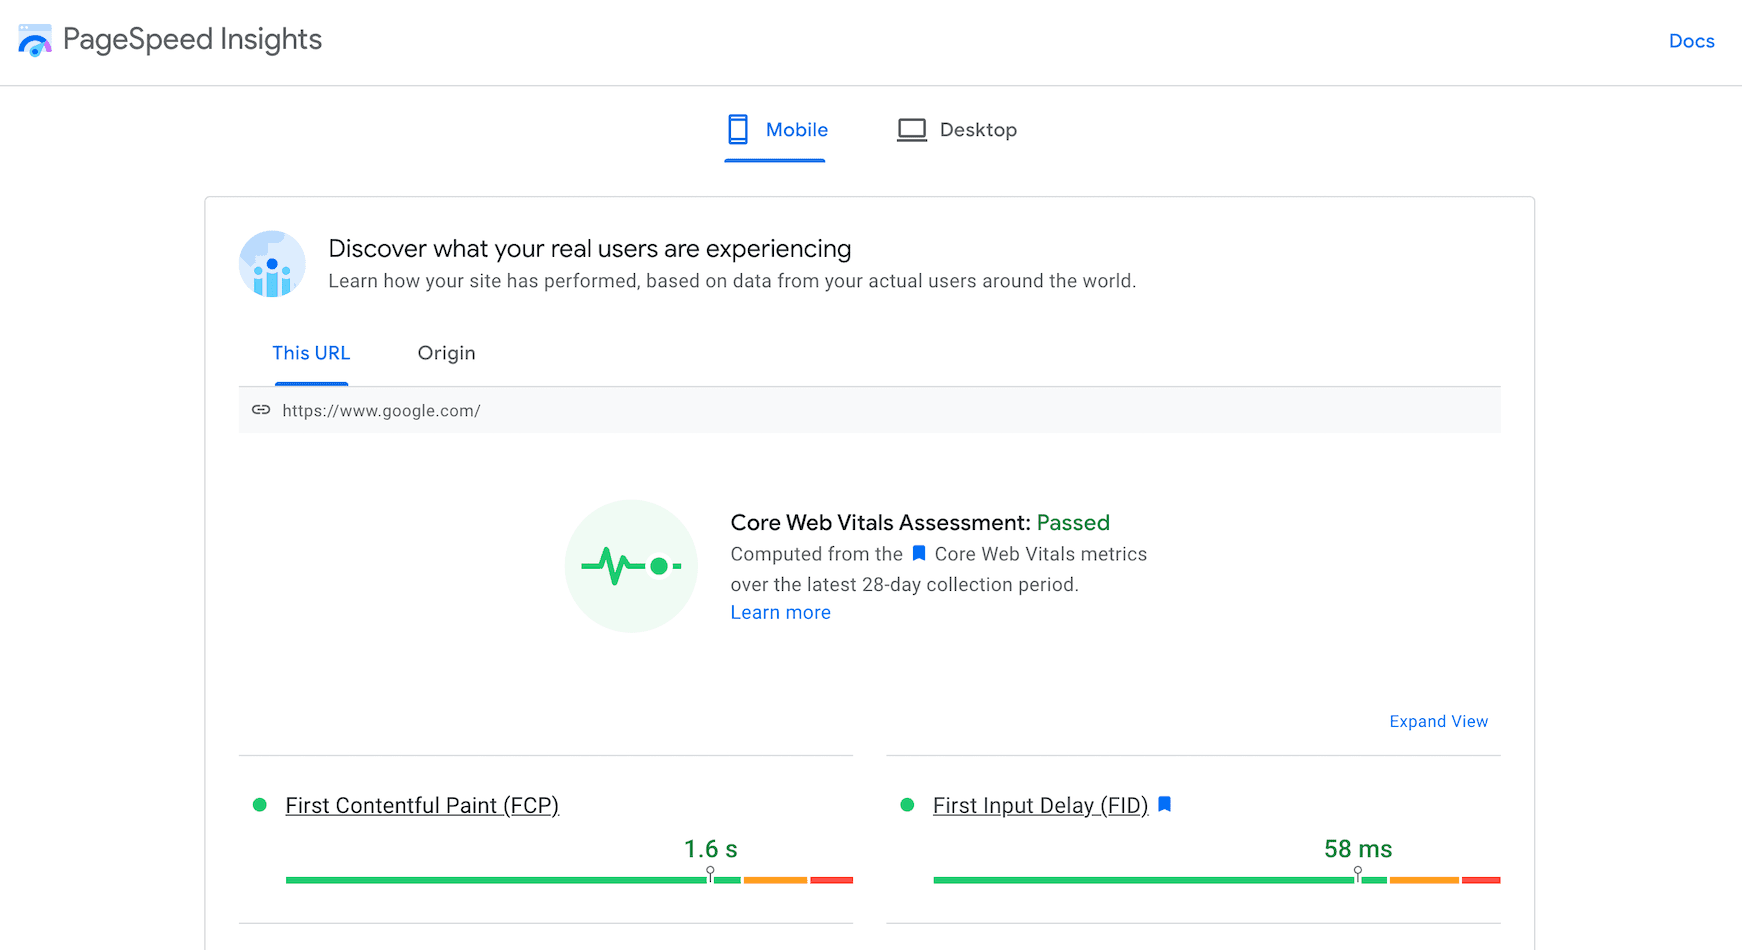
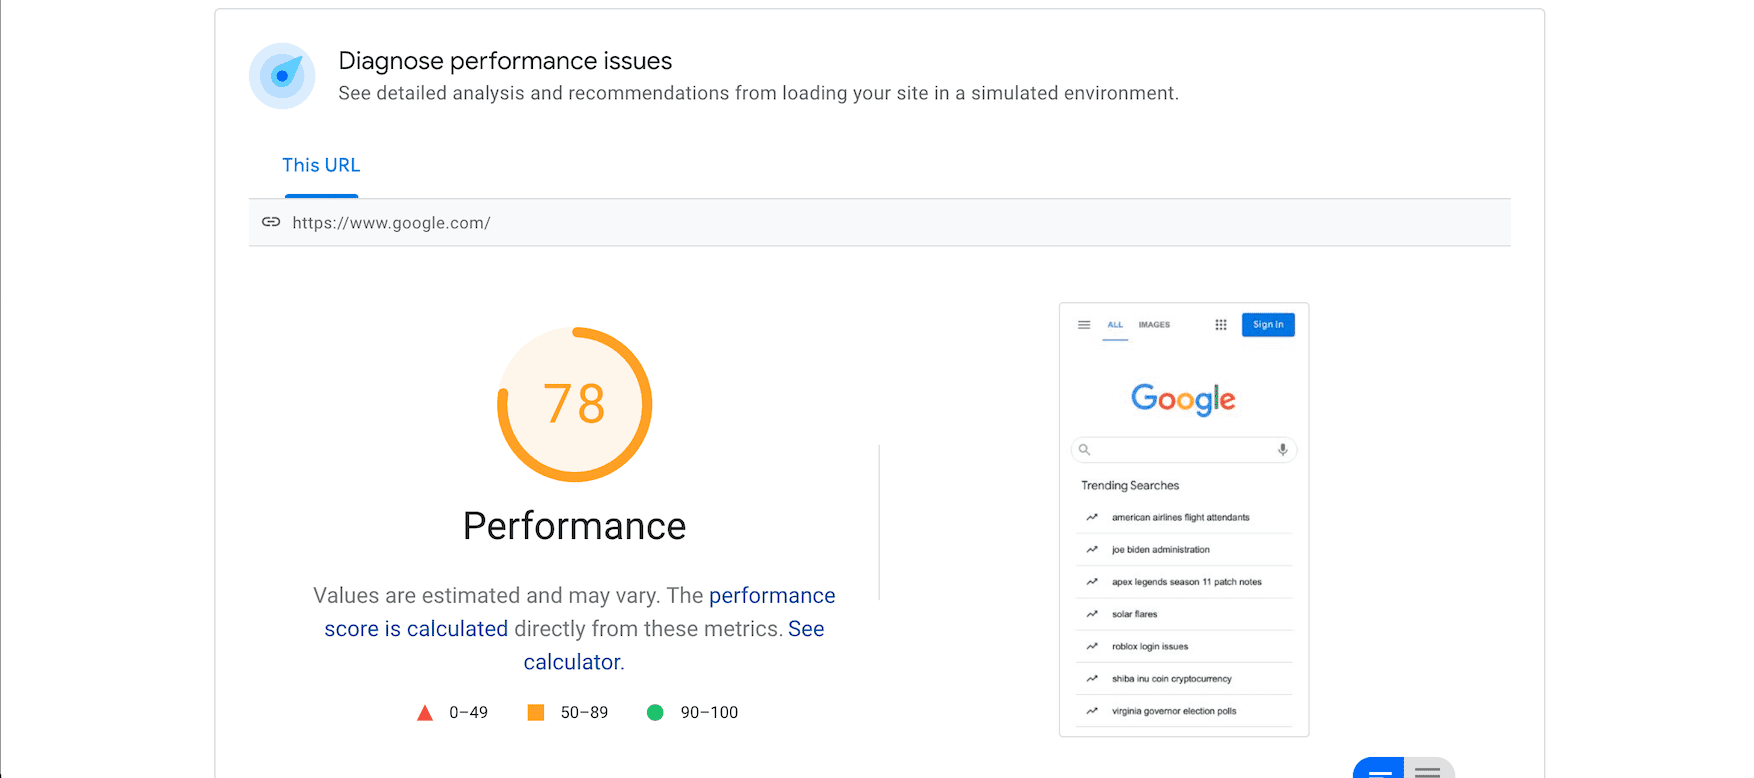
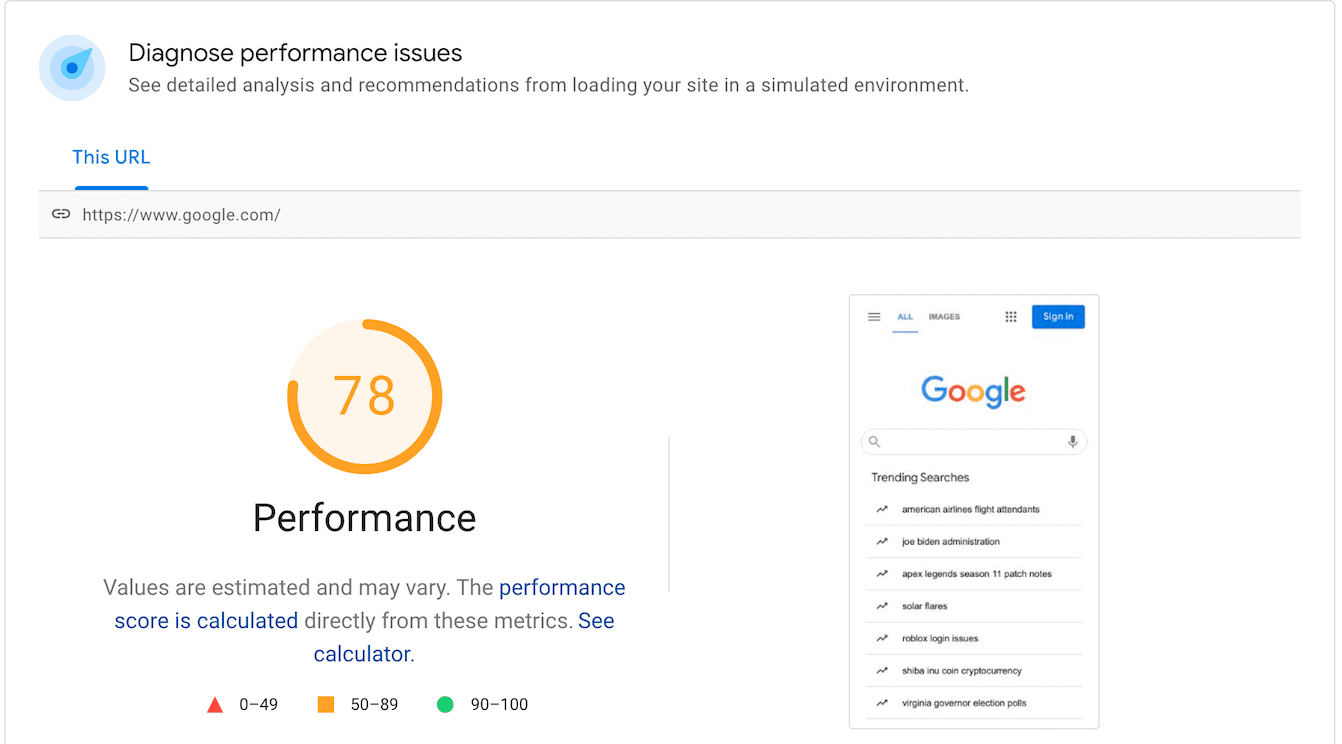
We have changed the UI to distinctly separate field data from lab data. Labels for "Field Data" and "Lab data" have been replaced with text that indicates what the data means and how it can help. We have also brought the Field data section to the top. The traditional lab-based performance score, which is currently shown at the top, has been moved down to the Lab data section to avoid ambiguity about the origin of the score.
Core Web Vitals assessment
The Core Web Vitals assessment result, which earlier appeared as a single word "passed" or "failed" in Field Data, now stands out as a separate subsection with a distinct icon.
Note that there is no change in the assessment process for Core Web Vitals. The Core Web Vitals metrics FID, LCP, and CLS, may be aggregated at either the page or origin level. For aggregations with sufficient data in all three metrics, the aggregation passes the Core Web Vitals assessment if the 75th percentiles of all three metrics are Good. Otherwise, the aggregation does not pass the assessment. If the aggregation has insufficient FID data, it will pass the assessment if both the 75th percentiles of LCP and CLS are Good. If either LCP or CLS has insufficient data, the page or origin-level aggregation cannot be assessed.
Labels for mobile and desktop performance
We changed the navigation menu at the top and included links for mobile and desktop centrally on the report page. The links are now easily visible and distinctly indicate the platform for which the data is being shown. Doing this also helped make the navigation bar cleaner.


Origin Summary
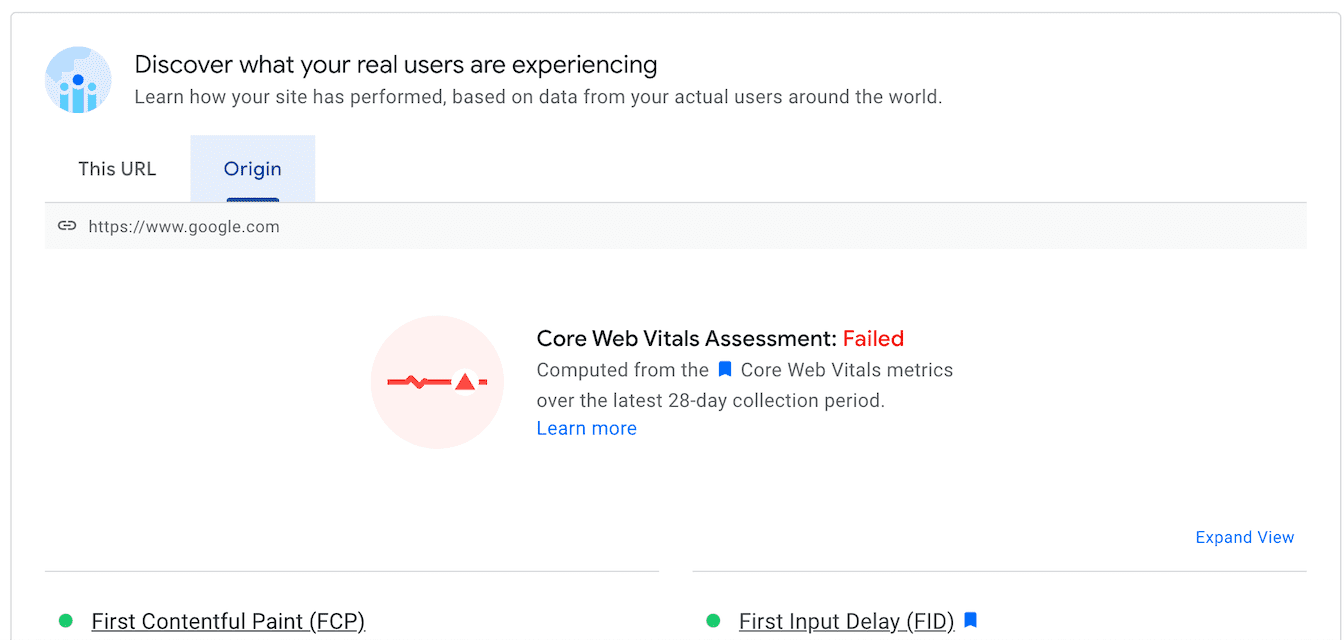
The Origin Summary, which provides the aggregated CrUX score for all pages from the origin, currently appears on click of a checkbox. We have moved this report section to a new tab, "Origin", under the Field Data section.
Additional helpful information
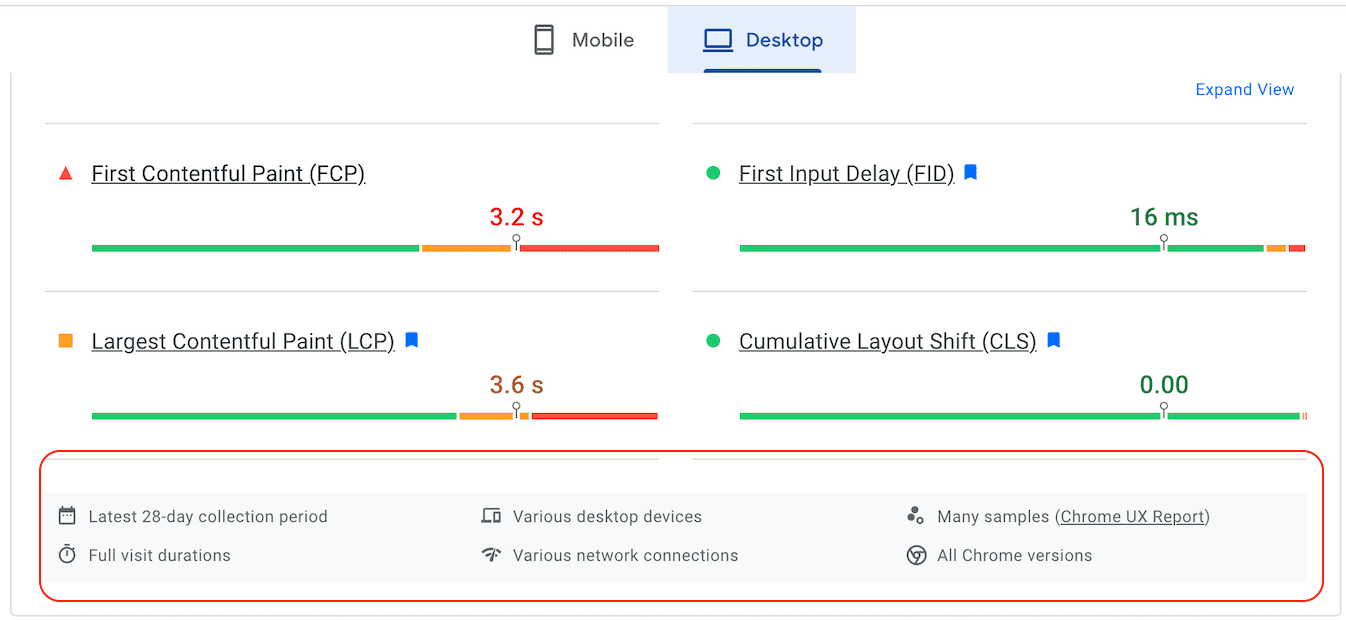
The report now includes a new information section at the bottom of each field and lab card sharing the following details about the sampled data:
- Data collection period
- Visit durations
- Devices
- Network connections
- Sample size
- Chrome versions
This information should enhance the distinction between lab and field data and help users who have previously been uncertain how the two data sources (lab and field) might differ.
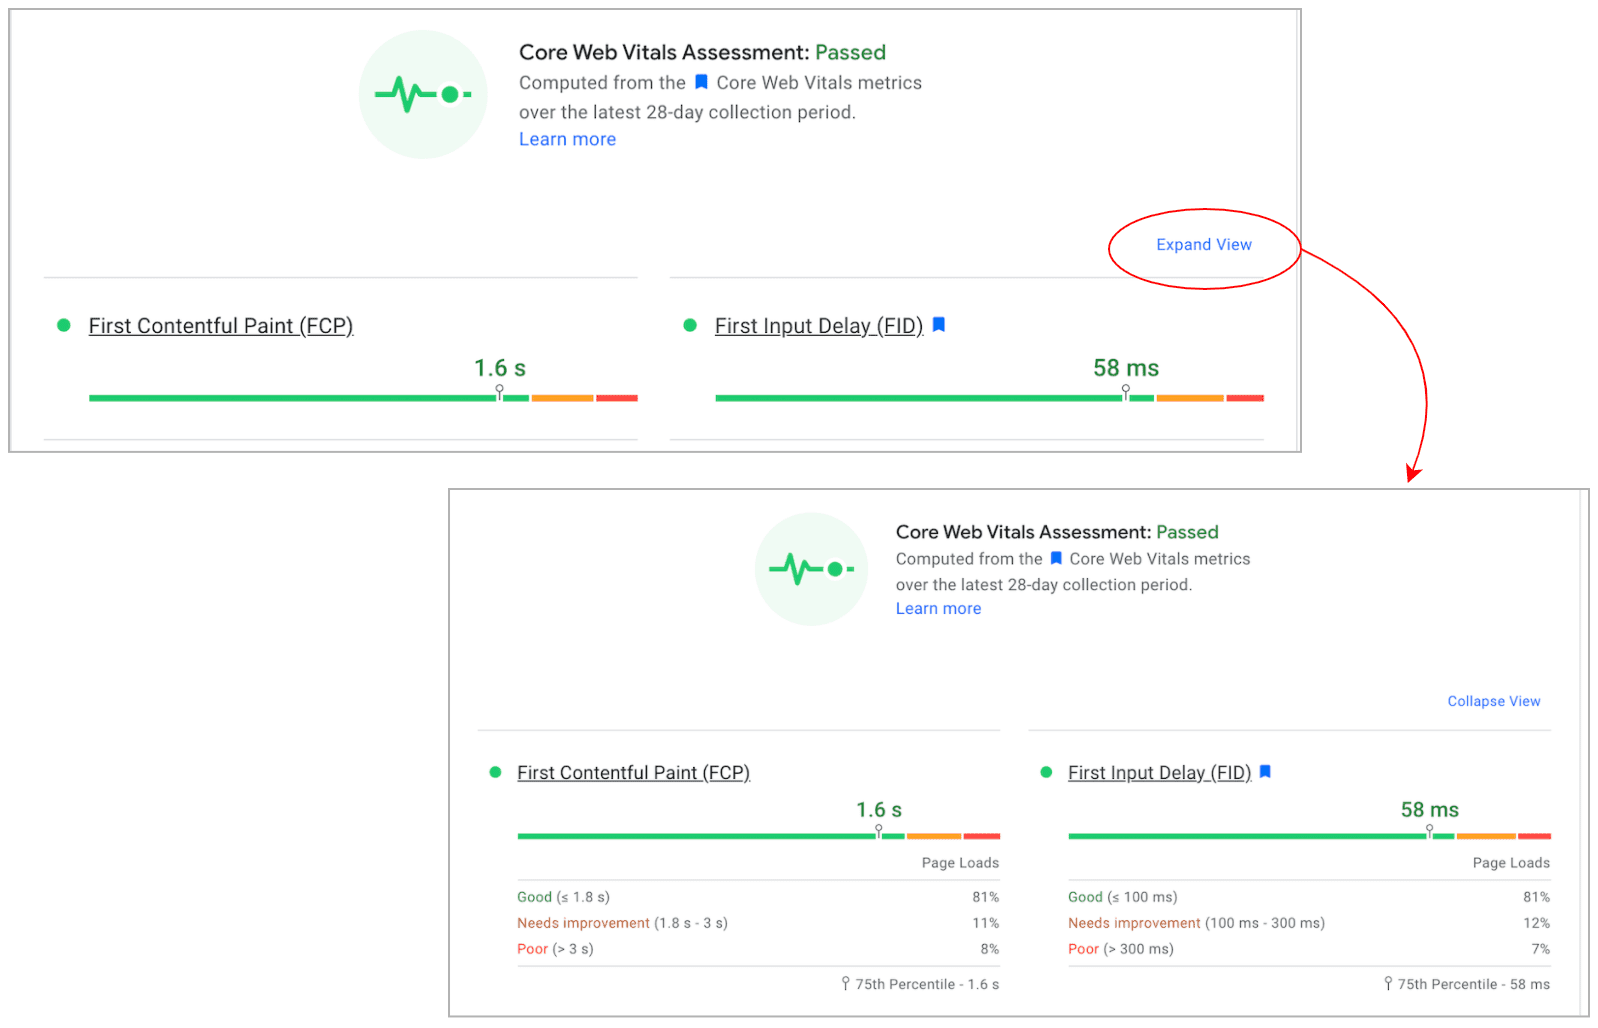
Expand view
We have a new "Expand view" feature that adds a drill-down function to the field data section and allows you to view granular details for the Core Web Vitals metrics.
Page image
We have removed the image of the loaded page, which appears right next to the field data. The image and thumbnails of the page displaying the loading sequence will both be available in the lab data section.
For up to date product documentation, visit https://developers.google.com/speed/docs/insights/.
Updates to web.dev/measure
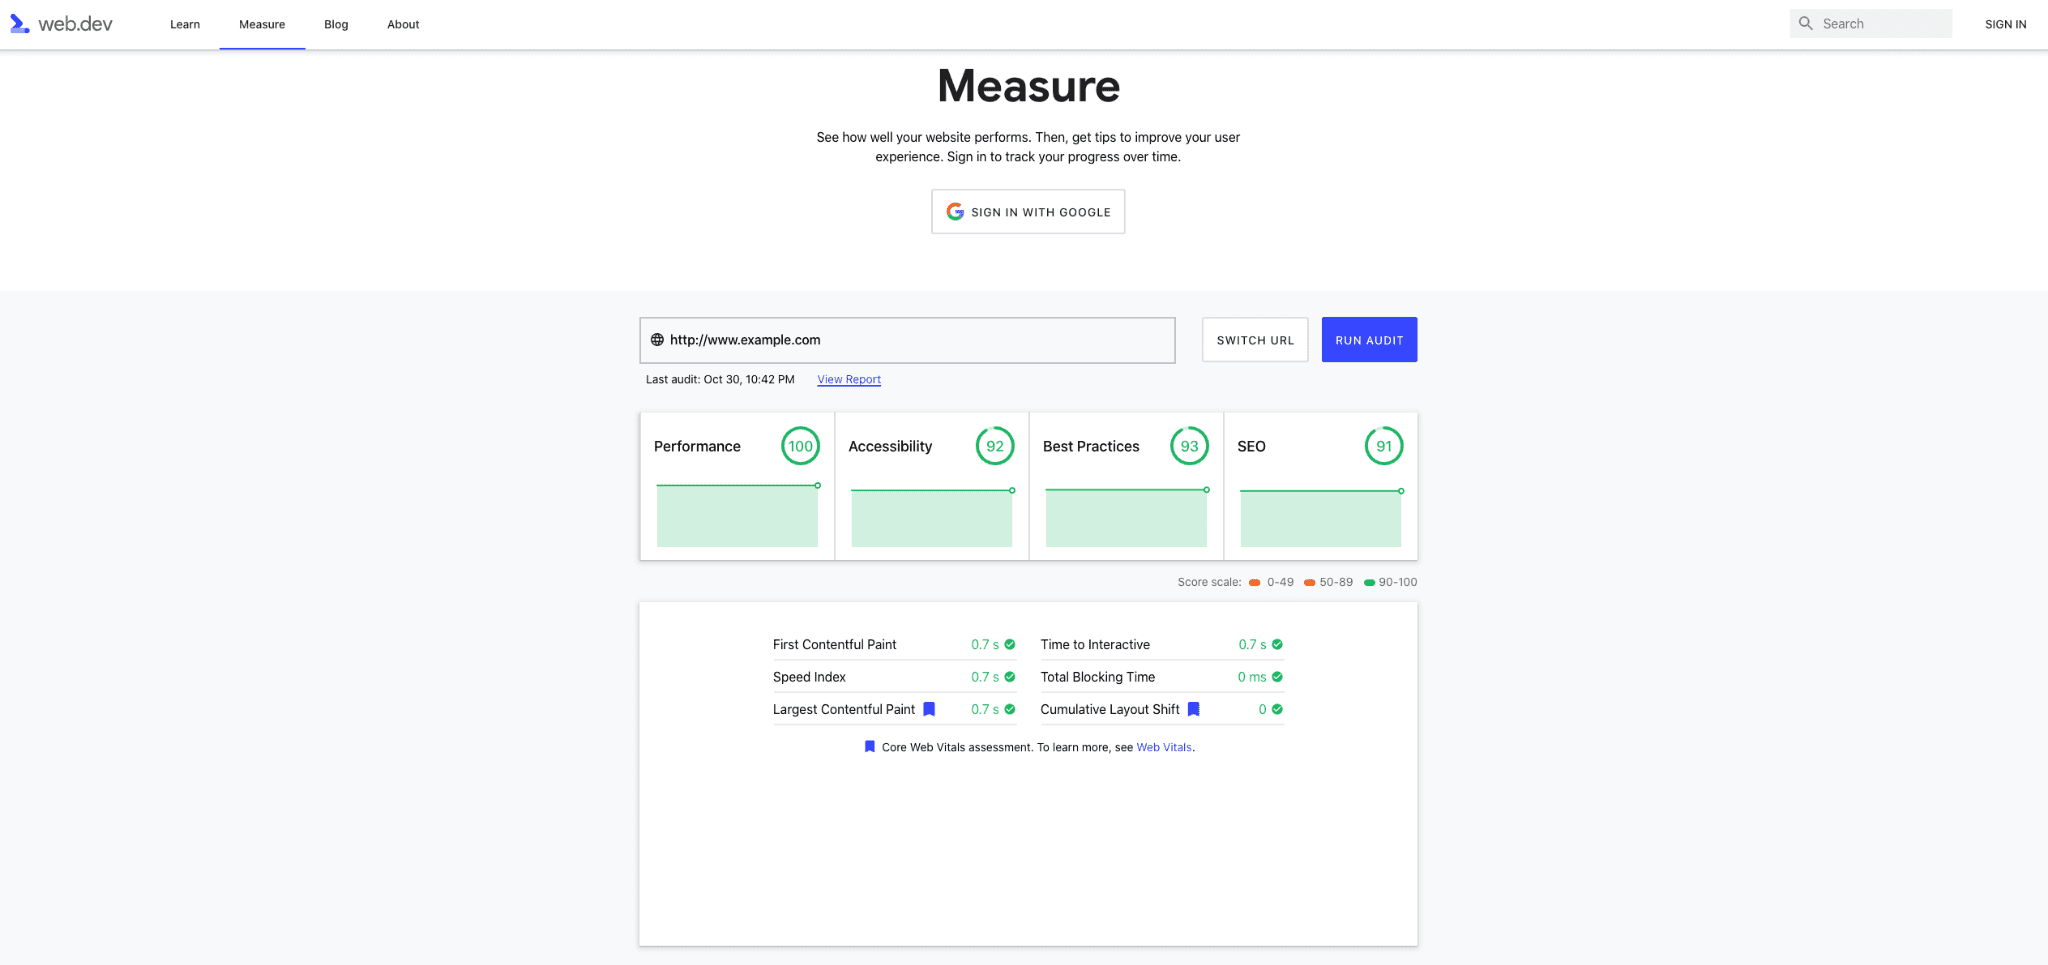
To reduce inconsistency between the different tools in our performance toolbox, we are also updating web.dev/measure to be directly powered by the PageSpeed Insights API.
Previously, developers would run reports via both the PSI tool and /measure and see different Lighthouse numbers. One of the main reasons for differences was because /measure originated all tests from the U.S. (due to it previously having a cloud backend that was US-based).
With /measure calling the same API directly as the PSI UI, developers will get a more consistent experience when using PSI and /measure. We have also made a few tweaks to /measure based on how users use the tool. This means that the signed-in experience for /measure will be going away, but the most used functionality—seeing multiple categories—will still be available for use.
PSI today
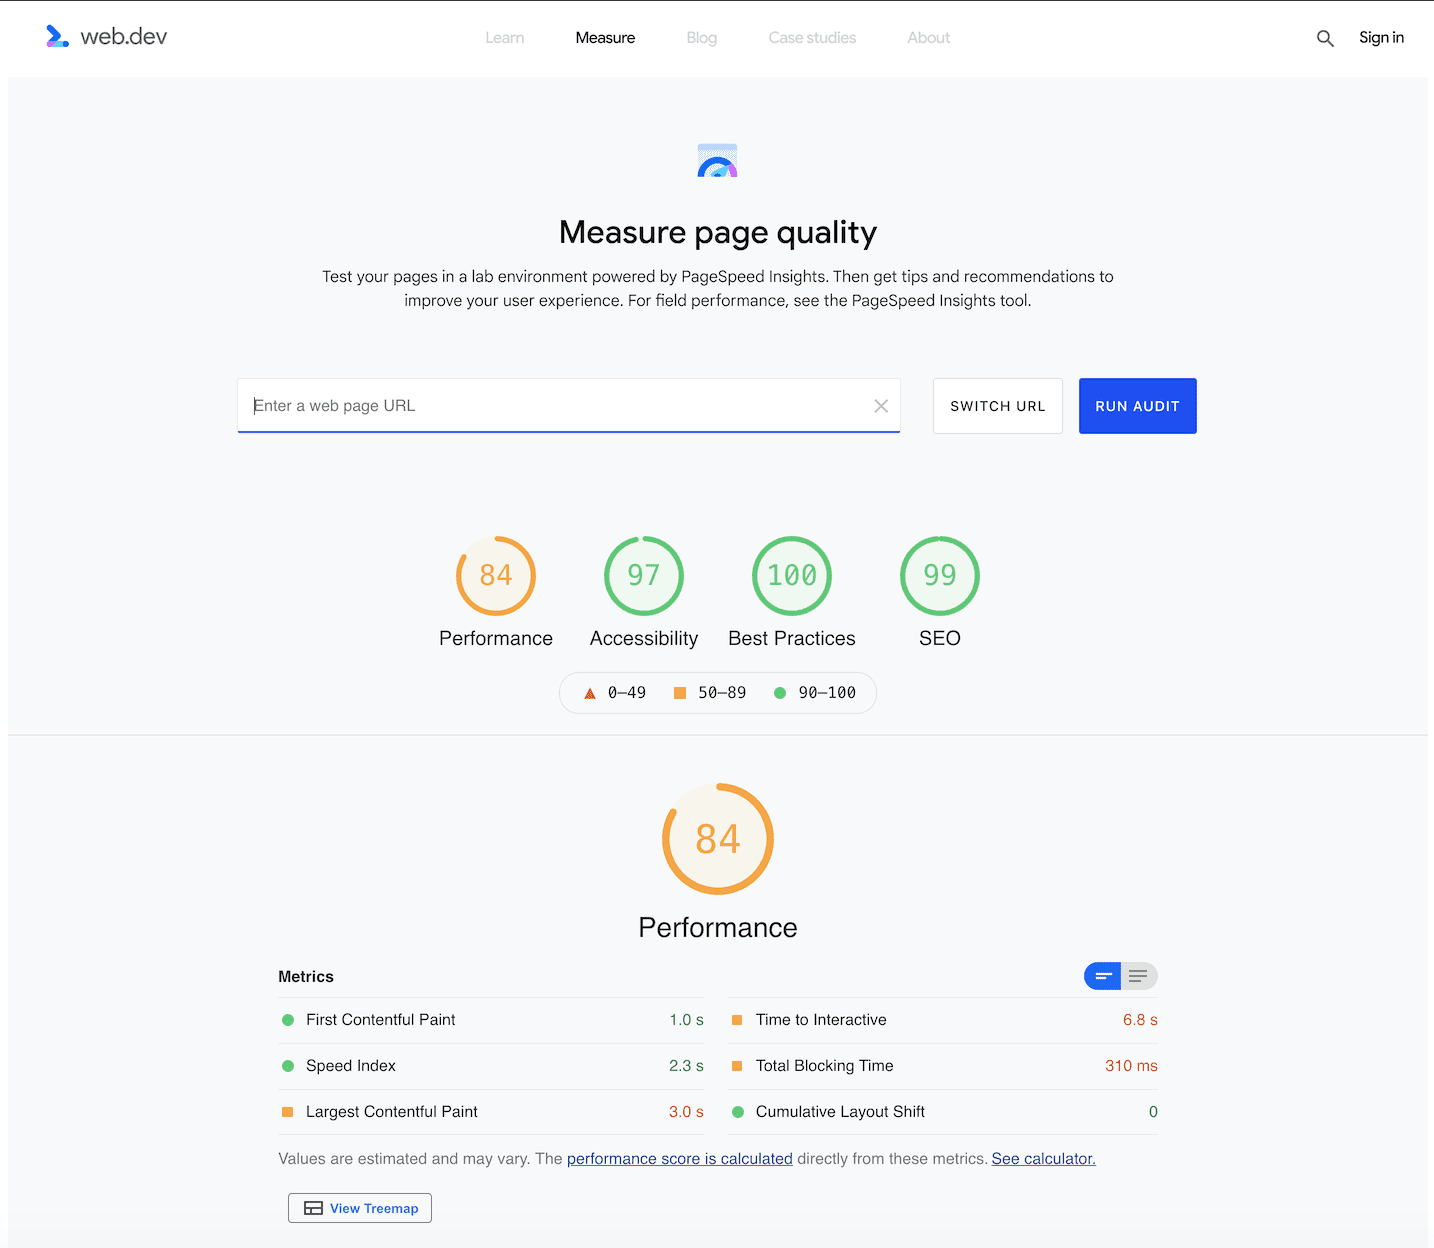
Taking a step back, let's look at what the current PageSpeed Insights report offers. The PSI report includes performance data for both mobile and desktop devices in individual tabs and suggests how you may improve a page. The key components of the report in each case are similar and consist of the following:
Performance Score: The performance score appears at the top of the PSI report and summarizes the overall page performance. This score is determined by running Lighthouse to collect and analyze lab data about the page. A score of 90 or above is considered good, 50-90 needs improvement, and below 50 is poor.
Field Data: Field data, sourced from the CrUX report dataset, provides insights into the real-world user experience. The data includes metrics such as First Contentful Paint (FCP), and measures Core Web Vitals (First Input Delay (FID), Largest Contentful Paint (LCP), and Cumulative Layout Shift (CLS). Along with the metric values, you can also see the distribution of pages where the value of a particular metric was Good, Needs Improvement, or Poor, indicated by green, amber, and red bars, respectively. The distribution and scores are shown based on page loads for users in the CrUX dataset. Scores are calculated for the last 28 days and are not available for new pages where sufficient real-user data may not be available.
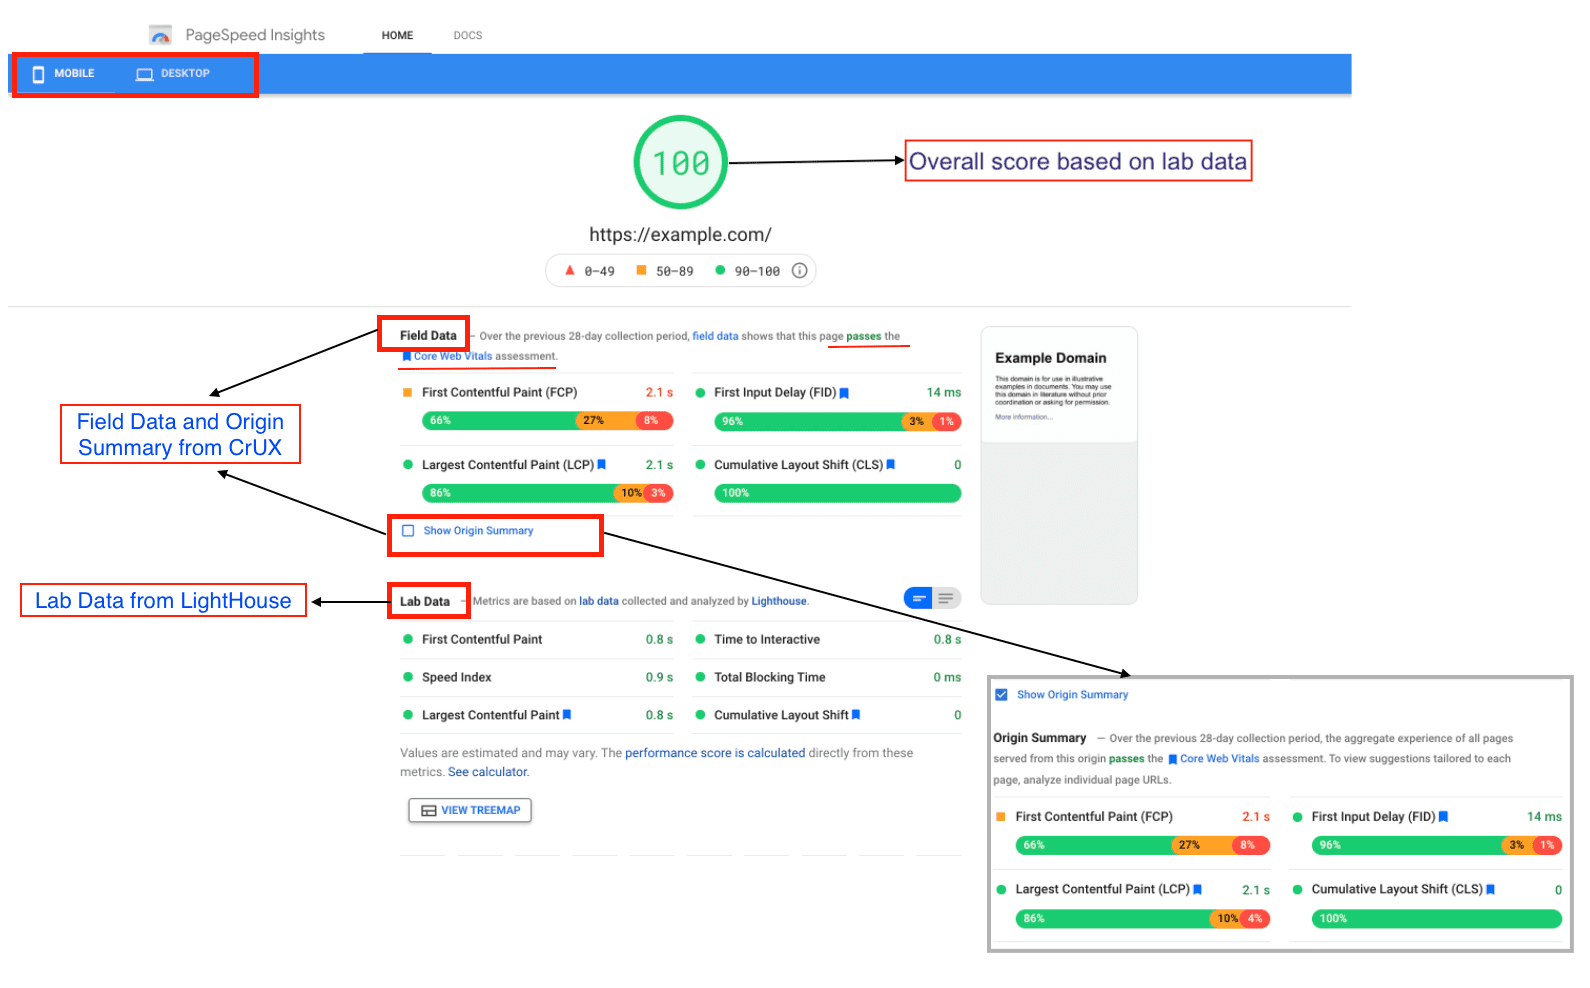
Origin Summary: Users can click on the Show Origin Summary checkbox to view the aggregated score for the metrics for all pages served from the same origin over the last 28 days.
Lab Data: Lab performance score, calculated using Lighthouse, helps debug performance issues, as it is collected in a controlled environment. The report shows the performance using metrics likeFirst Contentful Paint, Largest Contentful Paint, Speed Index, Cumulative Layout Shift, Time to Interactive, and Total Blocking Time. Each metric is scored and labeled with an icon indicating Good, Needs improvement, or Poor. This section provides a good indication of performance bottlenecks pre-release and can help to diagnose problems, but may not capture real-world issues.
Audits: This section lists all the audits run by Lighthouse and lists down the passed audits along with opportunities for improvement and additional diagnostic information.
Challenges with the current PSI design
As seen in the screenshot above, the different data points from lab and field data are not isolated clearly, and developers who are new to PSI may not easily understand the context of the data and what to do next. This confusion has resulted in many "How to" blog posts on deciphering the PSI report.
With the redesign, we hope to make interpreting the report easier for developers so that they move quickly from generating the PSI report to acting upon the insights included in it.
Learn more
For more details on performance tooling updates, watch the keynote for Chrome Dev Summit 2021. We will keep you posted on the release date for PSI and the changes to web.dev/measure.
With thanks to Milica Mihajlija, Philip Walton, Brendan Kenny and Ewa Gasperowicz for their feedback on this article


