


Unexpected layout shifts can disrupt the user experience in many ways, from causing them to lose their place while reading if the text moves suddenly, to making them click the wrong link or button. In some cases, this can do serious damage.
Unexpected movement of page content usually happens when resources load asynchronously or DOM elements are dynamically added to the page before existing content. The cause of layout shifts might be images or videos with unknown dimensions, fonts that render larger or smaller than its initial fallback, or third-party ads or widgets that dynamically resize themselves.
Differences between how a site function in development and how its users experience it make this problem worse. For example:
- Personalized or third-party content often behaves differently in development and in production.
- Test images are often already in the developer's browser cache, but take longer to load for the end user.
- API calls that run locally are often so fast that unnoticeable delays in development can become substantial in production.
The Cumulative Layout Shift (CLS) metric helps you address this problem by measuring how often it's occurring for real users.
What is CLS?
CLS is a measure of the largest burst of layout shift scores for every unexpected layout shift that occurs during the entire lifecycle of a page.
A layout shift occurs any time a visible element changes its position from one rendered frame to the next. (Details on how individual layout shift scores are calculated are covered later in this guide.)
A burst of layout shifts, known as a session window, is when one or more individual layout shifts occur in rapid succession with less than 1-second in between each shift and a maximum of 5 seconds for the total window duration.
The largest burst is the session window with the maximum cumulative score of all layout shifts within that window.
What is a good CLS score?
To provide a good user experience, sites should strive to have a CLS score of 0.1 or less. To ensure you're hitting this target for most of your users, a good threshold to measure is the 75th percentile of page loads, segmented across mobile and desktop devices.

To learn more about the research and methodology behind this recommendation, see Defining the Core Web Vitals metrics thresholds.
Layout shifts in detail
Layout shifts are defined by the Layout Instability API, which reports layout-shift entries any time an element that is visible within the viewport changes its start position (for example, its top and left position in the default writing mode) between two frames. Such elements are considered unstable elements.
Note that layout shifts only occur when existing elements change their start position. If a new element is added to the DOM or an existing element changes size, it doesn't count as a layout shift—as long as the change doesn't cause other visible elements to change their start position.
Layout shift score
To calculate the layout shift score, the browser looks at the viewport size and the movement of unstable elements in the viewport between two rendered frames. The layout shift score is a product of two measures of that movement: the impact fraction and the distance fraction (both defined below).
layout shift score = impact fraction * distance fraction
Impact fraction
The impact fraction measures how unstable elements impact the viewport area between two frames.
The impact fraction for a given frame is a combination of the visible areas of all unstable elements for that frame and the previous frame, as a fraction of the total area of the viewport.
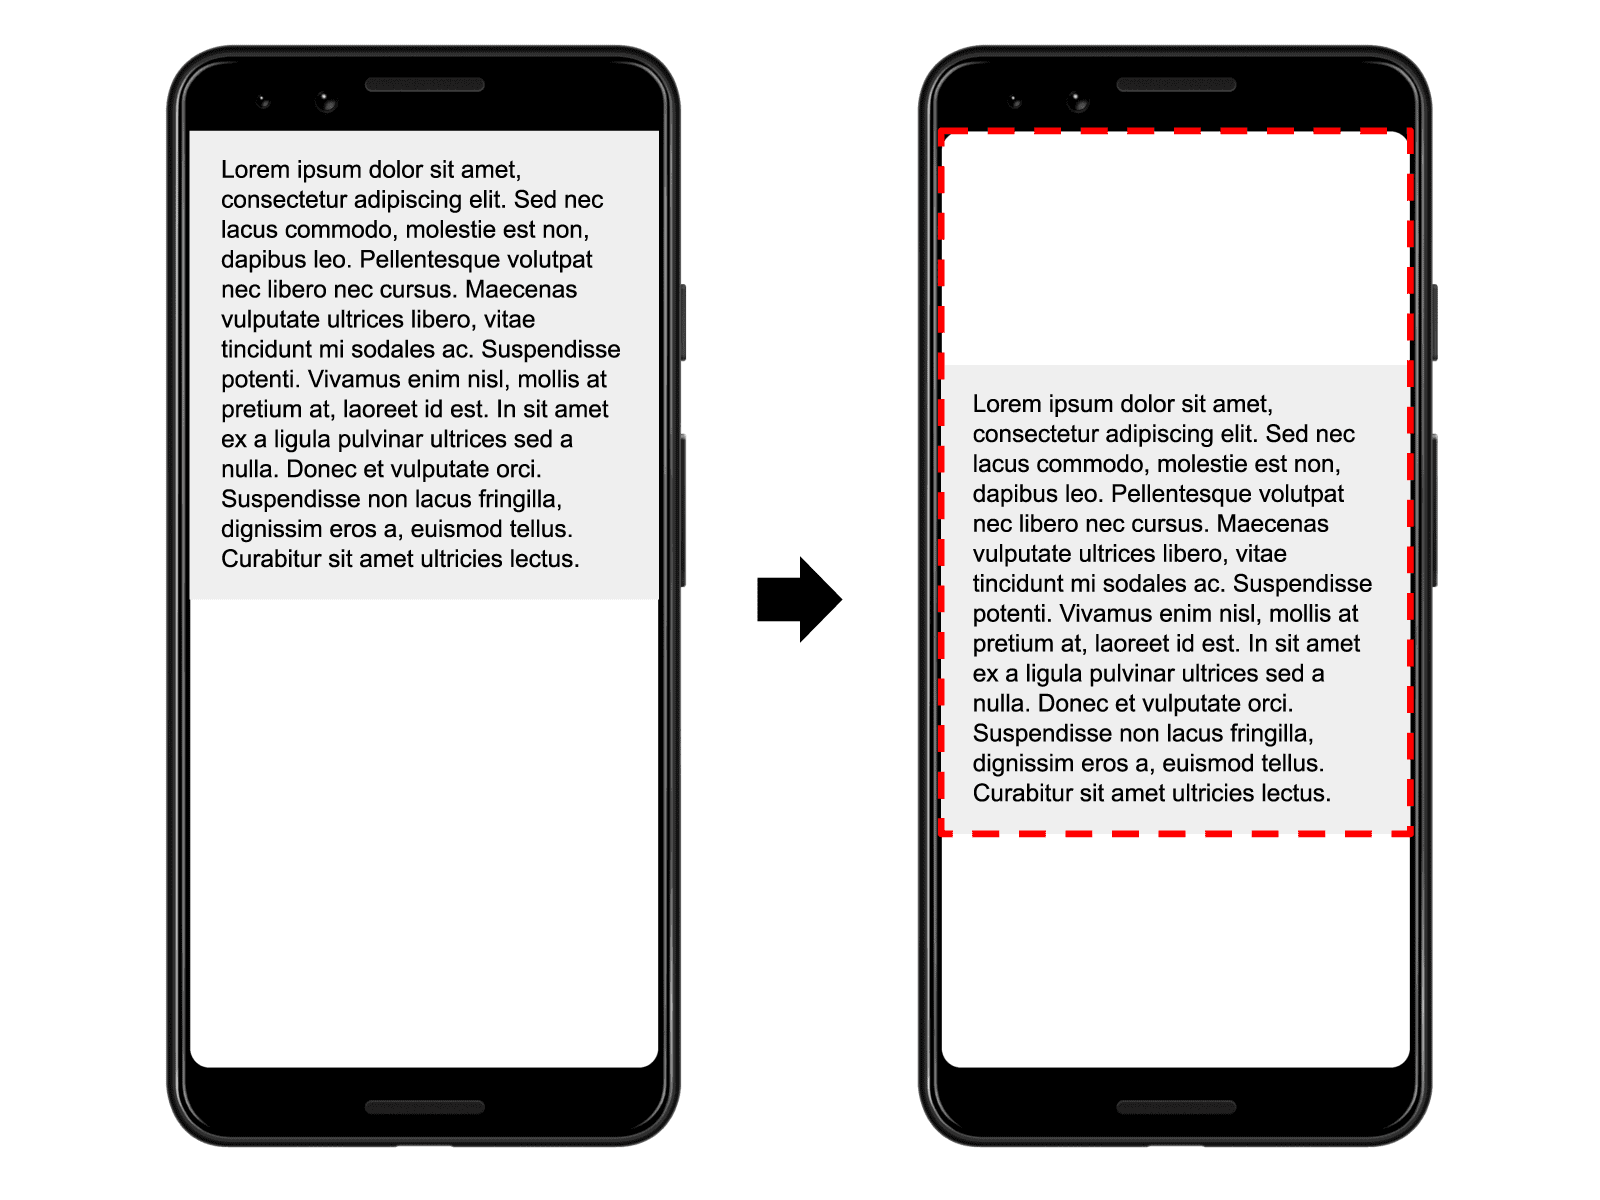
In the preceding image, there's an element that takes up half of the viewport in one frame. Then, in the next frame, the element shifts down by 25% of the viewport height. The red, dotted rectangle indicates the union of the element's visible area in both frames, which, in this case, is 75% of the total viewport, so its impact fraction is 0.75.
Distance fraction
The other part of the layout shift score equation measures the distance that unstable elements have moved relative to the viewport. The distance fraction is the greatest horizontal or vertical distance any unstable element has moved in the frame divided by the viewport's largest dimension (width or height, whichever is greater).
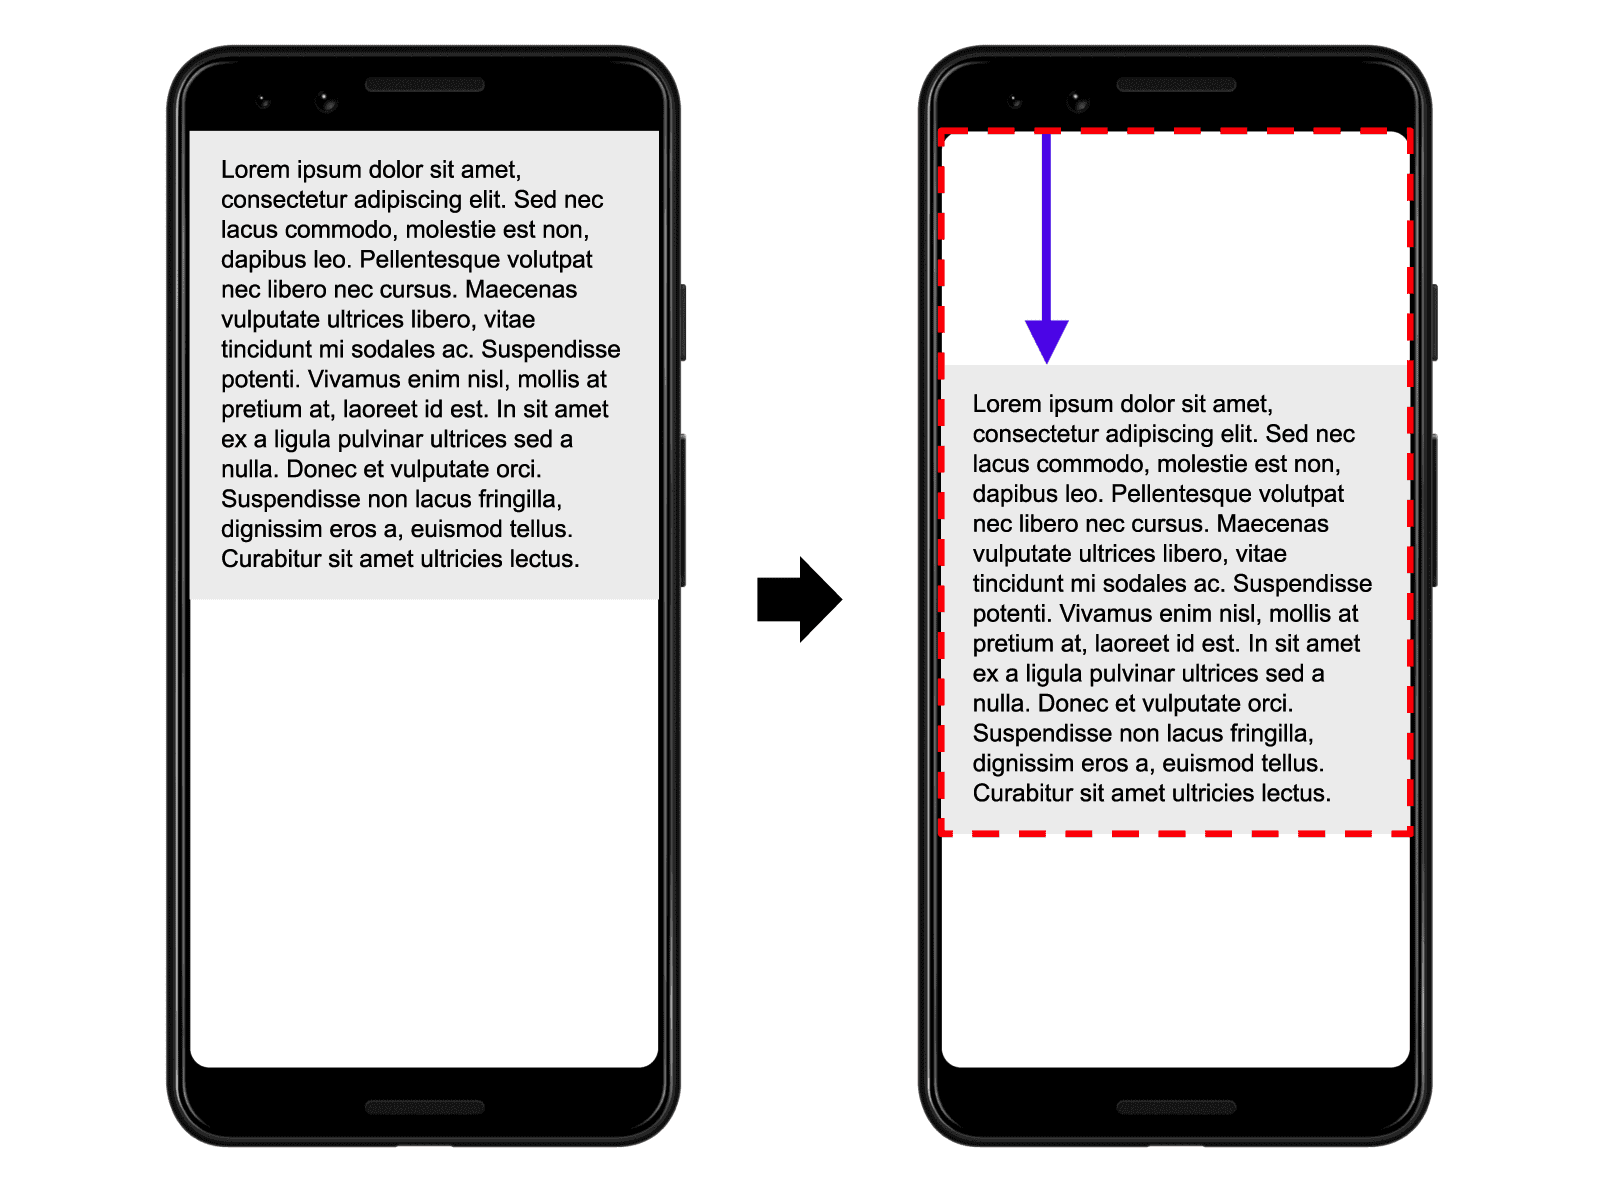
In the prior example, the largest viewport dimension is the height, and the unstable element has moved by 25% of the viewport height, which makes the distance fraction 0.25.
So, in this example the impact fraction is 0.75 and the distance fraction is 0.25, so the layout shift score is 0.75 * 0.25 = 0.1875.
Examples
The next example illustrates how adding content to an existing element affects the layout shift score:
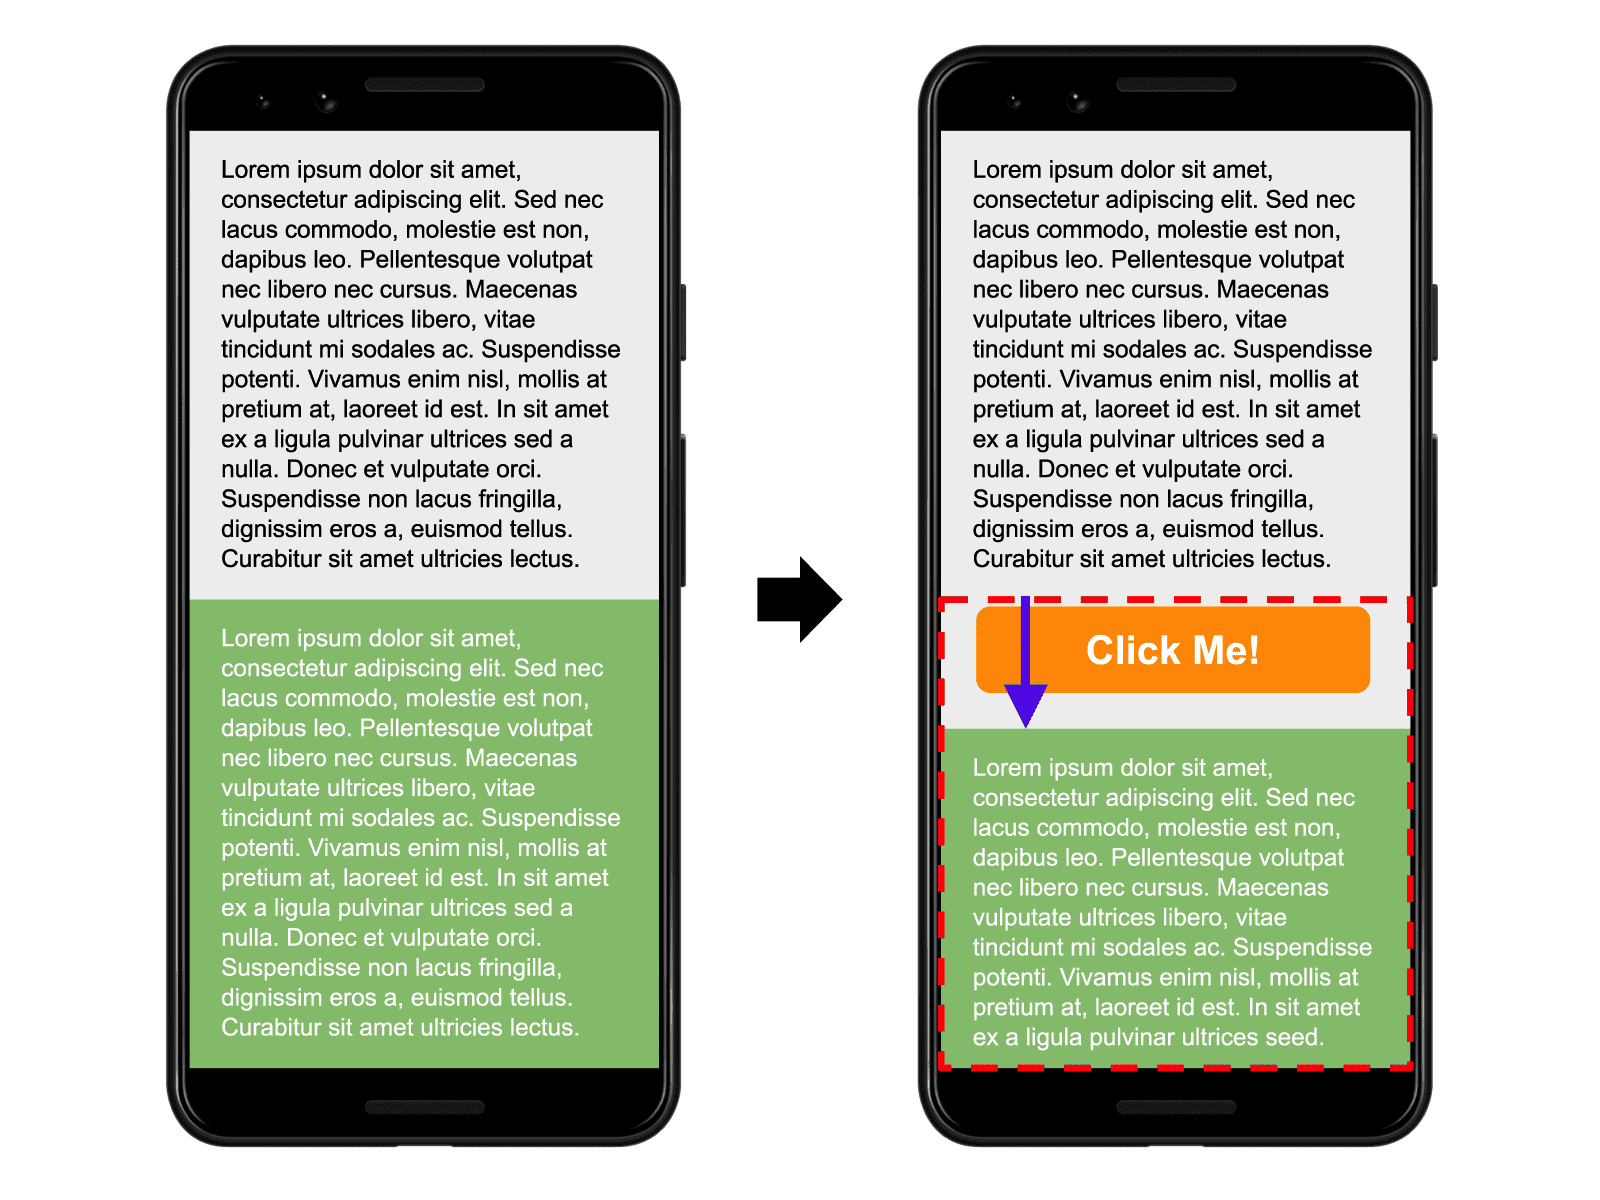
In this example, the gray box changes size, but its start position does not change so it's not an unstable element.
The "Click Me!" button was not previously in the DOM, so its start position doesn't change either.
The start position of the green box, however, does change, but since it's been moved partially out of the viewport, the invisible area is not considered when calculating the impact fraction. The union of the visible areas for the green box in both frames (illustrated by the red, dotted rectangle) is the same as the area of the green box in the first frame—50% of the viewport. The impact fraction is 0.5.
The distance fraction is illustrated with the purple arrow. The green box has moved down by about 14% of the viewport so the distance fraction is 0.14.
The layout shift score is 0.5 x 0.14 = 0.07.
The following example shows how multiple unstable elements affect a page's layout shift score:
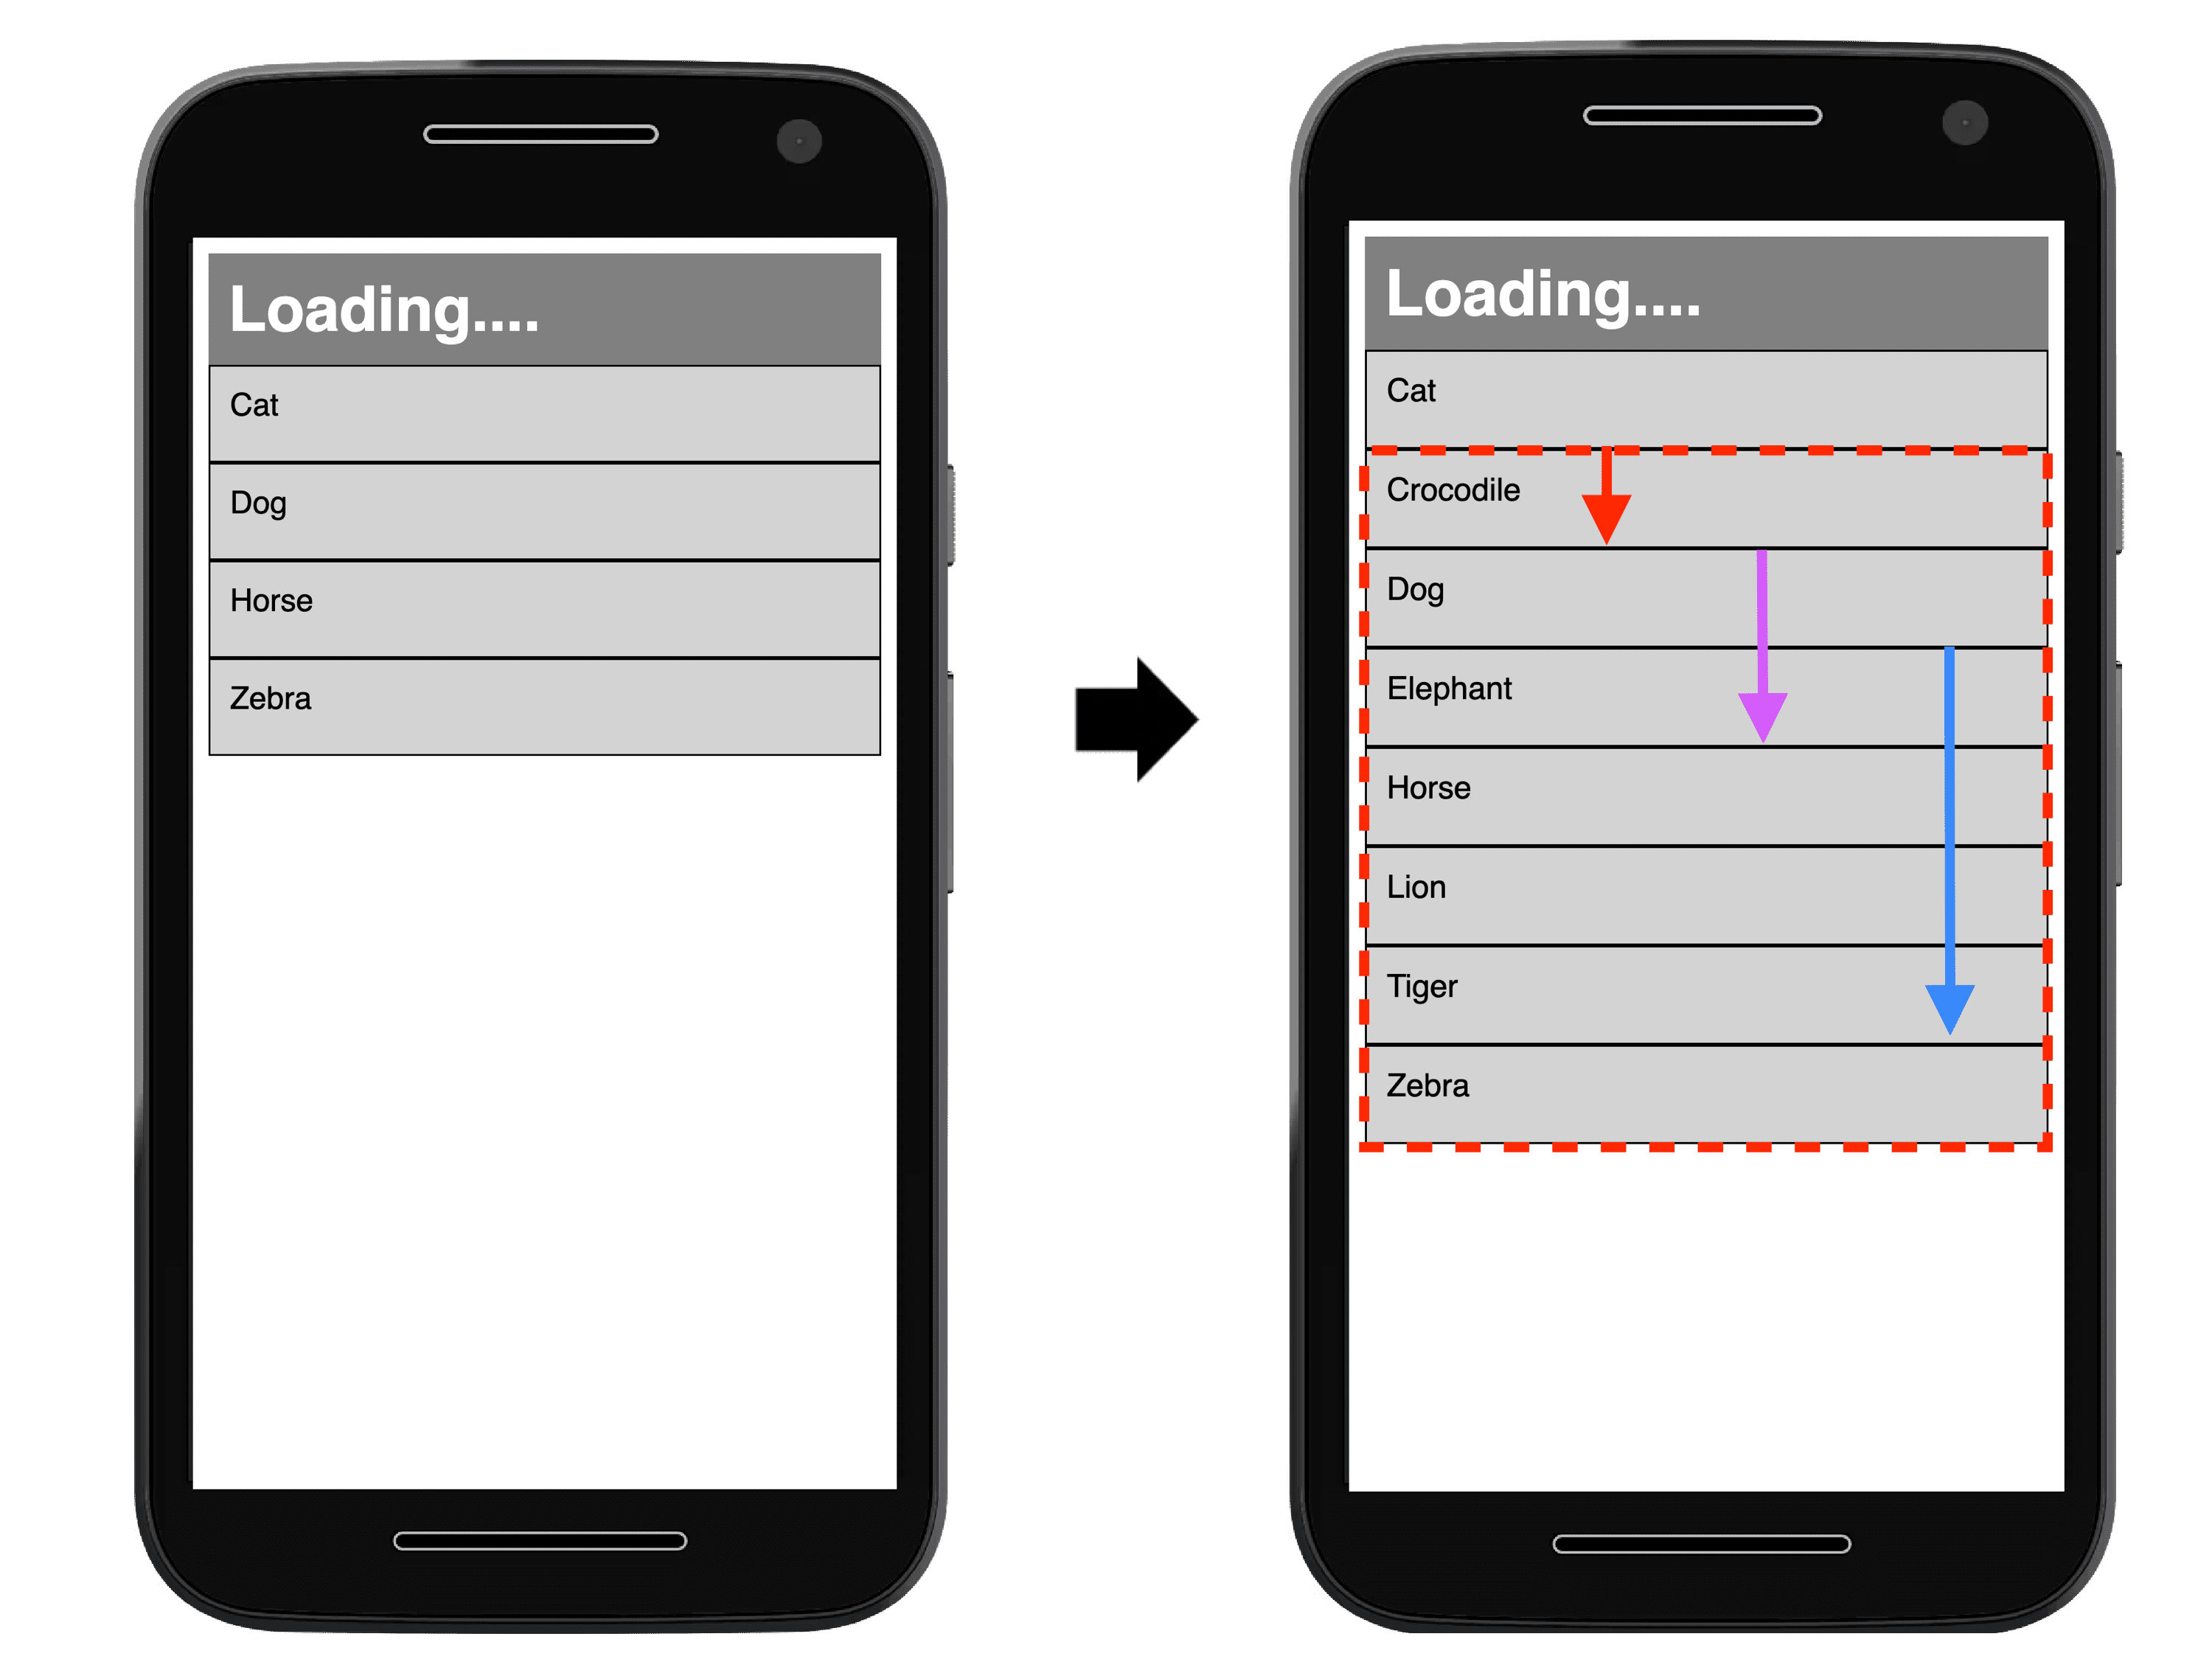
In the first frame in the preceding image, there are four results of an API request for animals, sorted in alphabetical order. In the second frame, more results are added to the sorted list.
The first item in the list ("Cat") does not change its start position between frames, so it's stable. Similarly, the new items added to the list were not previously in the DOM, so their start positions don't change either. But the items labelled "Dog", "Horse", and "Zebra" all shift their start positions, making them unstable elements.
Again, the red, dotted rectangles represent the union of these three unstable elements' before and after areas, which in this case is around 60% of the viewport's area (impact fraction of 0.60).
The arrows represent the distances that unstable elements have moved from their starting positions. The "Zebra" element, represented by the blue arrow, has moved the most, by about 30% of the viewport height. That makes the distance fraction in this example 0.3.
The layout shift score is 0.60 x 0.3 = 0.18.
Expected versus unexpected layout shifts
Not all layout shifts are bad. In fact, many dynamic web applications frequently change the start position of elements on the page. A layout shift is only bad if the user isn't expecting it.
User-initiated layout shifts
Layout shifts that occur in response to user interactions (such as clicking or tapping a link, pressing a button, or typing in a search box) are generally fine, as long as the shift occurs close enough to the interaction that the relationship is clear to the user.
For example, if a user interaction triggers a network request that may take a while to complete, it's best to create some space right away and show a loading indicator to avoid an unpleasant layout shift when the request completes. If the user doesn't realize something is loading, or doesn't have a sense of when the resource will be ready, they may try to click something else while waiting—something that could move out from under them.
Layout shifts that occur within 500 milliseconds of user input will have the hadRecentInput flag set, so they can be excluded from calculations.
Animations and transitions
Animations and transitions, when done well, are a great way to update content on the page without surprising the user. Content that shifts abruptly and unexpectedly on the page almost always creates a bad user experience. But content that moves gradually and naturally from one position to the next can often help the user better understand what's going on, and guide them between state changes.
Be sure to respect prefers-reduced-motion
browser settings, as some site visitors can experience ill effects or attention
issues from animation.
CSS transform property
lets you animate elements without triggering layout shifts:
- Instead of changing the
heightandwidthproperties, usetransform: scale(). - To move elements around, avoid changing the
top,right,bottom, orleftproperties and usetransform: translate()instead.
How to measure CLS
CLS can be measured in the lab or in the field, and it's available in the following tools:
Field tools
- Chrome User Experience Report
- PageSpeed Insights
- Search Console (Core Web Vitals report)
web-vitalsJavaScript library
Lab tools
Measure layout shifts in JavaScript
To measure layout shifts in JavaScript, you use the Layout Instability API.
The following example shows how to create a PerformanceObserver to log layout-shift entries to the console:
new PerformanceObserver((entryList) => {
  for (const entry of entryList.getEntries()) {
    console.log('Layout shift:', entry);
  }
}).observe({type: 'layout-shift', buffered: true});
Measure CLS in JavaScript
To measure CLS in JavaScript, you need to group these unexpected layout-shift entries into sessions, and calculate the maximum session value. You can refer to the web vitals JavaScript library source code which contains a reference implementation on how CLS is calculated.
In most cases, the current CLS value at the time the page is being unloaded is the final CLS value for that page, but there are a few important exceptions as noted in the next section. The web vitals JavaScript library accounts for these as much as possible, within the limitations of the Web APIs.
Differences between the metric and the API
- If a page is loaded in the background, or if it's backgrounded prior to the browser painting any content, then it shouldn't report any CLS value.
- If a page is restored from the back/forward cache, its CLS value should be reset to zero since users experience this as a distinct page visit.
- The API does not report
layout-shiftentries for shifts that occur within iframes but the metric does as they are part of the user experience of the page. This can show as a difference between CrUX and RUM. To properly measure CLS you should consider them. Sub-frames can use the API to report theirlayout-shiftentries to the parent frame for aggregation.
In addition to these exceptions, CLS has some added complexity due to the fact that it measures the entire lifespan of a page:
- Users might keep a tab open for a very long time—days, weeks, months. In fact, a user might never close a tab.
- On mobile operating systems, browsers typically don't run page unload callbacks for background tabs, making it difficult to report the "final" value.
To handle such cases, CLS should be reported any time a page is background—in addition to any time it's unloaded (the visibilitychange event covers both of these scenarios). And analytics systems receiving this data will then need to calculate the final CLS value on the backend.
Rather than memorizing and grappling with all of these cases yourself, developers can use the web-vitals JavaScript library to measure CLS, which accounts for everything mentioned previously, except the iframe case:
import {onCLS} from 'web-vitals';

// Measure and log CLS in all situations
// where it needs to be reported.
onCLS(console.log);
How to improve CLS
For more guidance on identifying layout shifts in the field and using lab data to optimize them, see our guide to optimizing CLS.
Additional resources
- Google Publisher Tag's guidance on minimizing layout shift
- Understanding Cumulative Layout Shift by Annie Sullivan and Steve Kobes at #PerfMatters (2020)
Changelog
Occasionally, bugs are discovered in the APIs used to measure metrics, and sometimes in the definitions of the metrics themselves. As a result, changes must sometimes be made, and these changes can show up as improvements or regressions in your internal reports and dashboards.
To help you manage this, all changes to either the implementation or definition of these metrics will be surfaced in this Changelog.
If you have feedback for these metrics, you can provide it in the web-vitals-feedback Google group.