
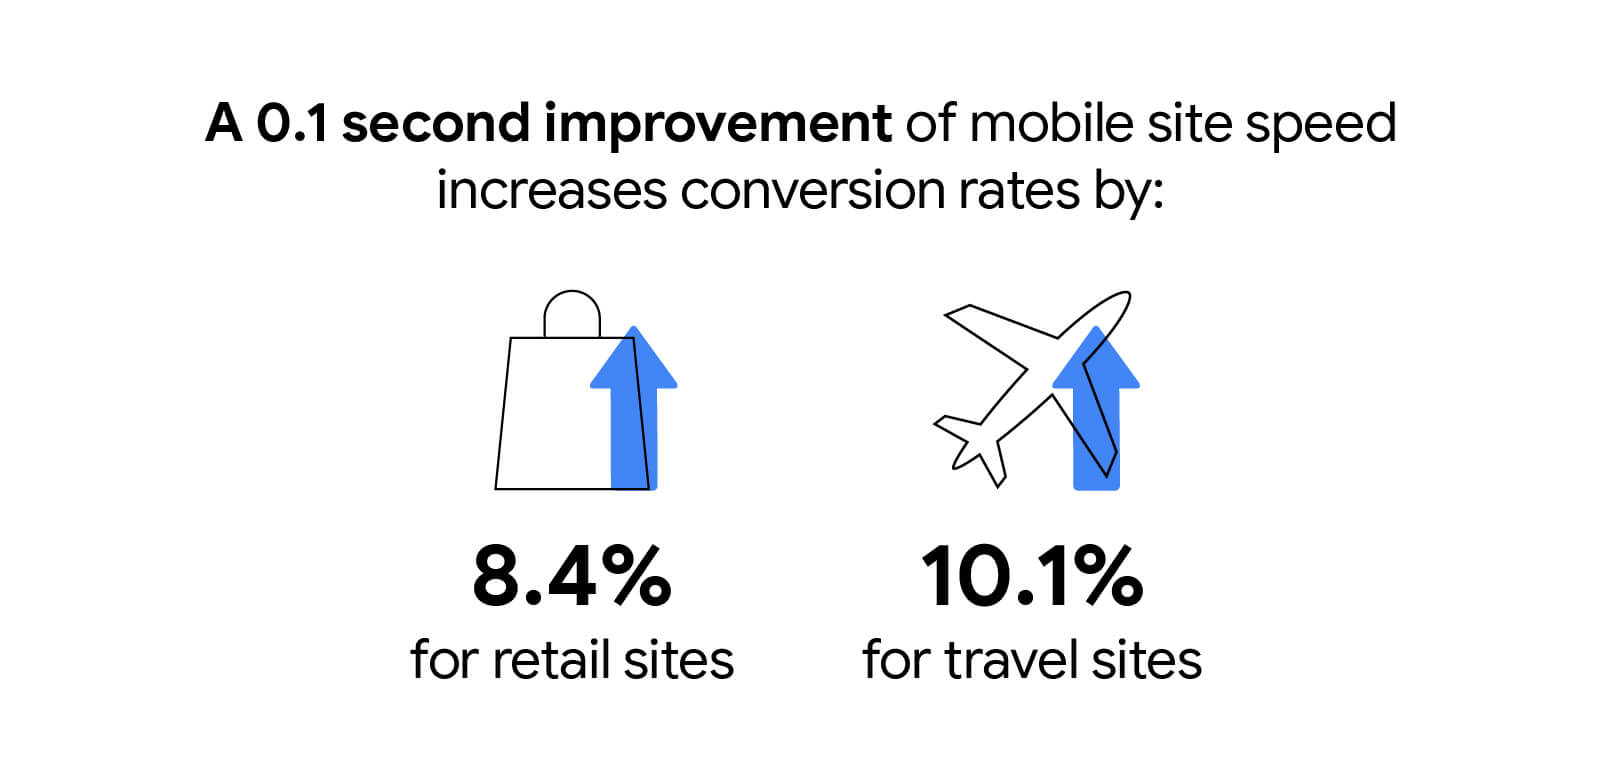
A 0.1 second improvement in 4 speed metrics can improve progression rates across the full purchase funnel.

A new study Milliseconds Make Millions reveals the significant impact of mobile site speed on consumers' willingness to spend money and engage with brands online. The results shows that even a 0.1 second improvement in load times can improve progression rates across the full purchase funnel. There was also a positive impact on pageviews, conversion rates, and average order value. The results underline that rising customer expectations and increasing use of smartphones are amplifying the need for mobile speed. The competitive gap will widen between brands who provide great mobile experiences and those who don't.
Summary of impact by vertical
All of the improvements below were observed after a 0.1 improvement in 4 metrics: First Meaningful Paint, Estimated Input Latency, Observed Load (Avg. Page Load Time in Google Analytics), and Max Server Latency (Time To First Byte). Every page across the user journey had to improve each of these metrics by 0.1 seconds in order for these positive impacts to be observed.
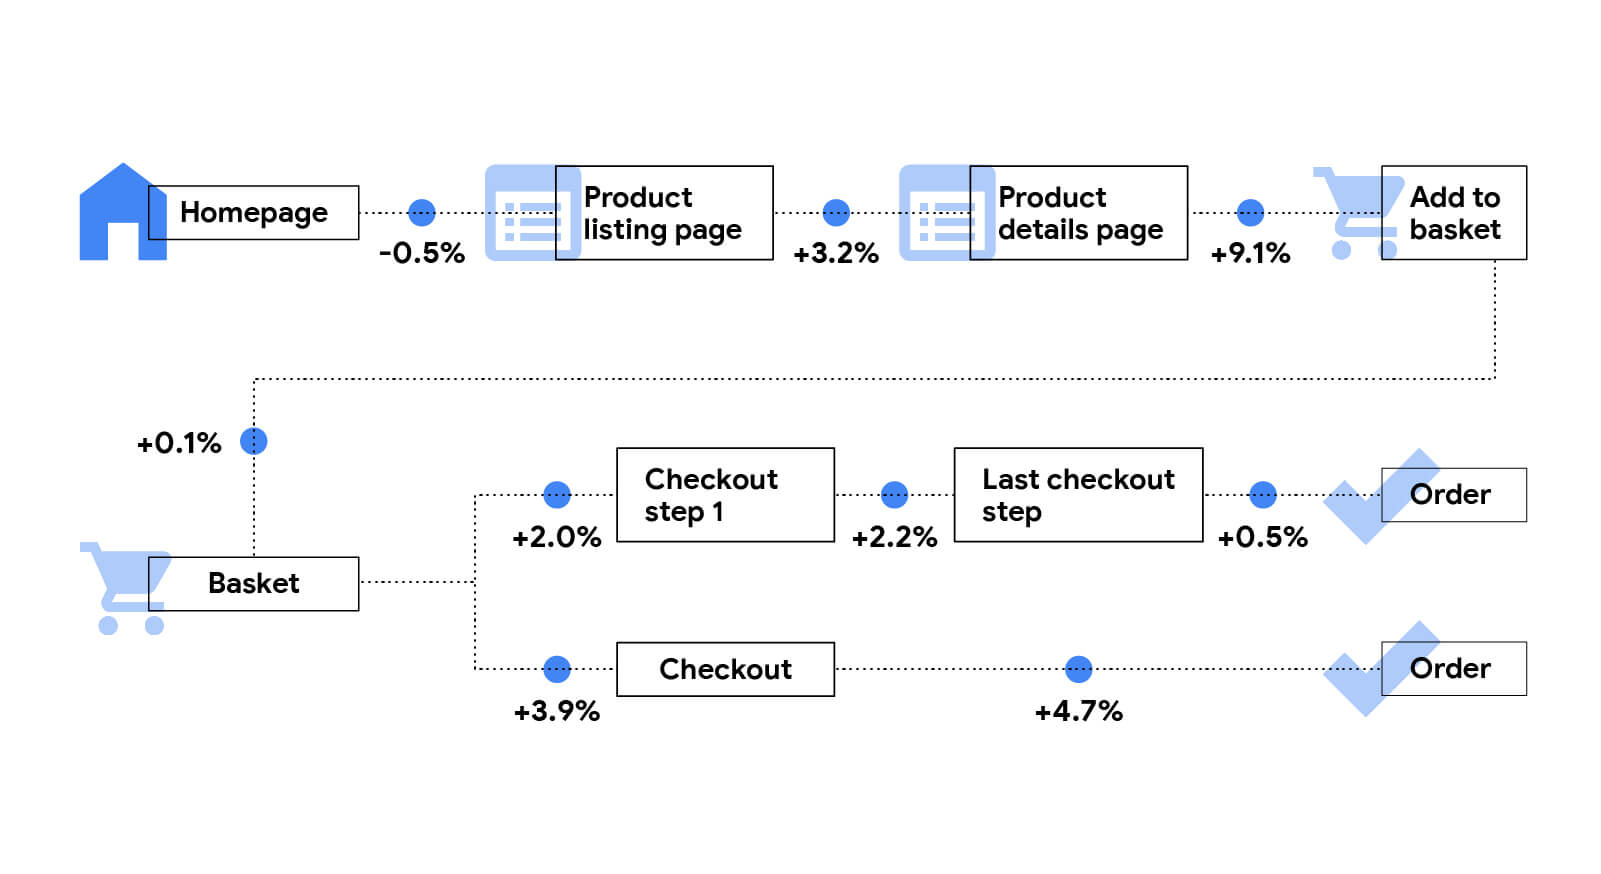
Retail
With a 0.1s improvement in site speed across the measured metrics, study participants observed an increase in progression rates (percentage of users moving from a webpage through to the next step of a conversion funnel) on almost every step of the mobile journey. In particular, there was an increase of 3.2% from Product Listing Page to Product Detail Page, and a 9.1% increase from Product Details Page to Add To Basket Page. Retail consumers also spent 9.2% more, a dramatic uplift.
Luxury
Out of all verticals studied, the impact for luxury verticals was the highest. One should bear in mind, however, that the progression rates on luxury sites tend to be quite small. The progression rates to Contact Us Page increased by 20.6% when the site speed metrics were improved by 0.1 seconds, and there was a significant 40.1% increase in users moving from Product Detail Page to Add To Basket page. Longer sessions were also recorded through the entire browsing journey.

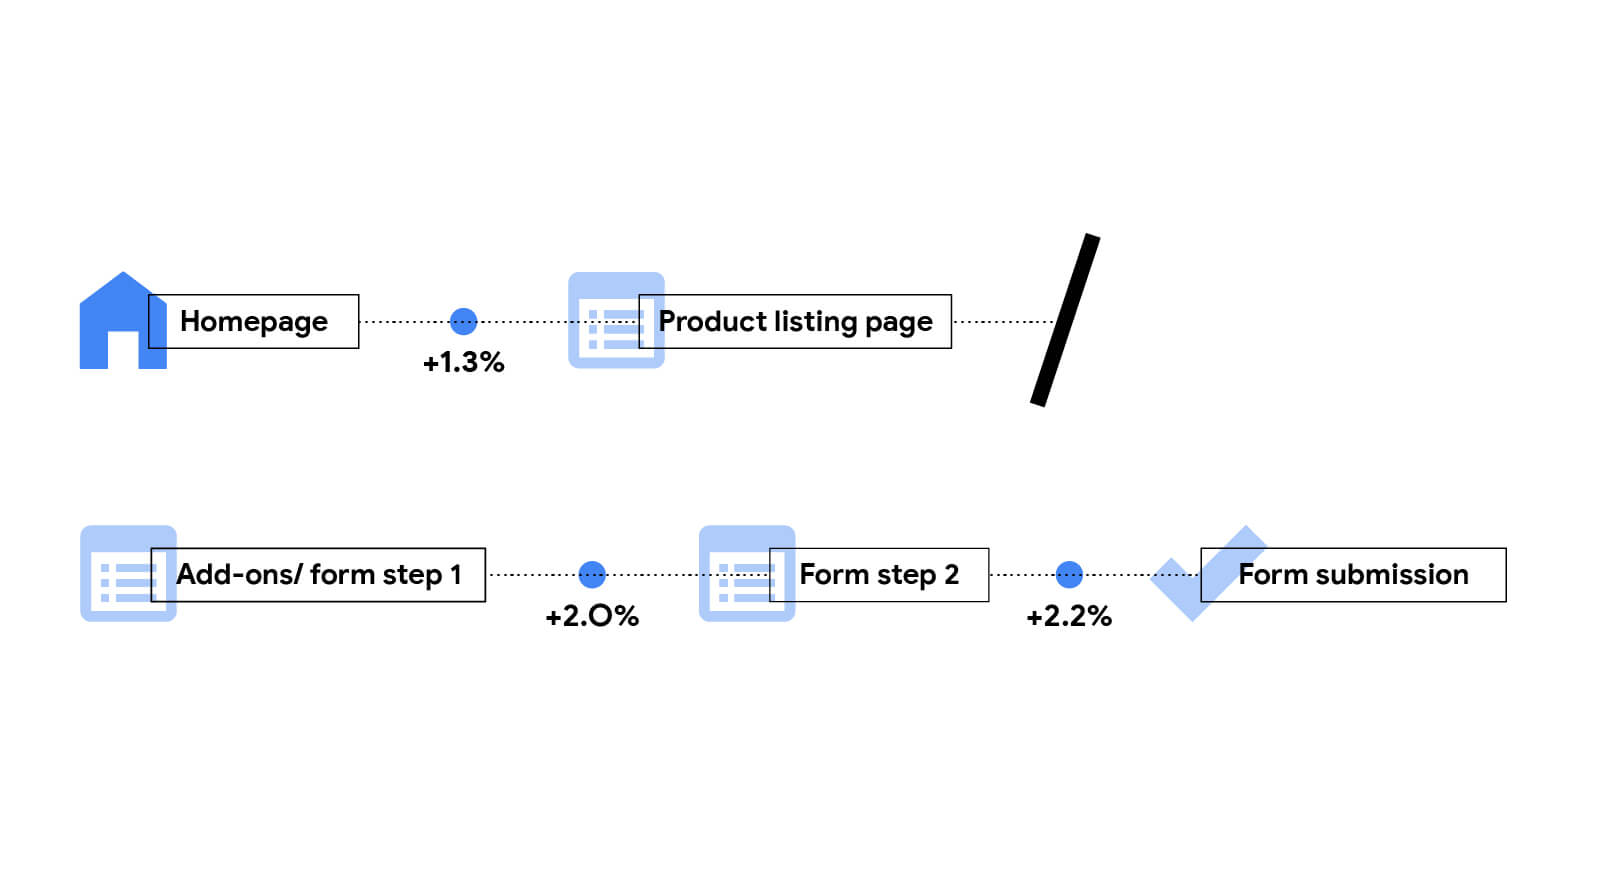
Travel
Travel sites saw a 2.2% increase in check-out completion and a 10% improvement in booking rates.
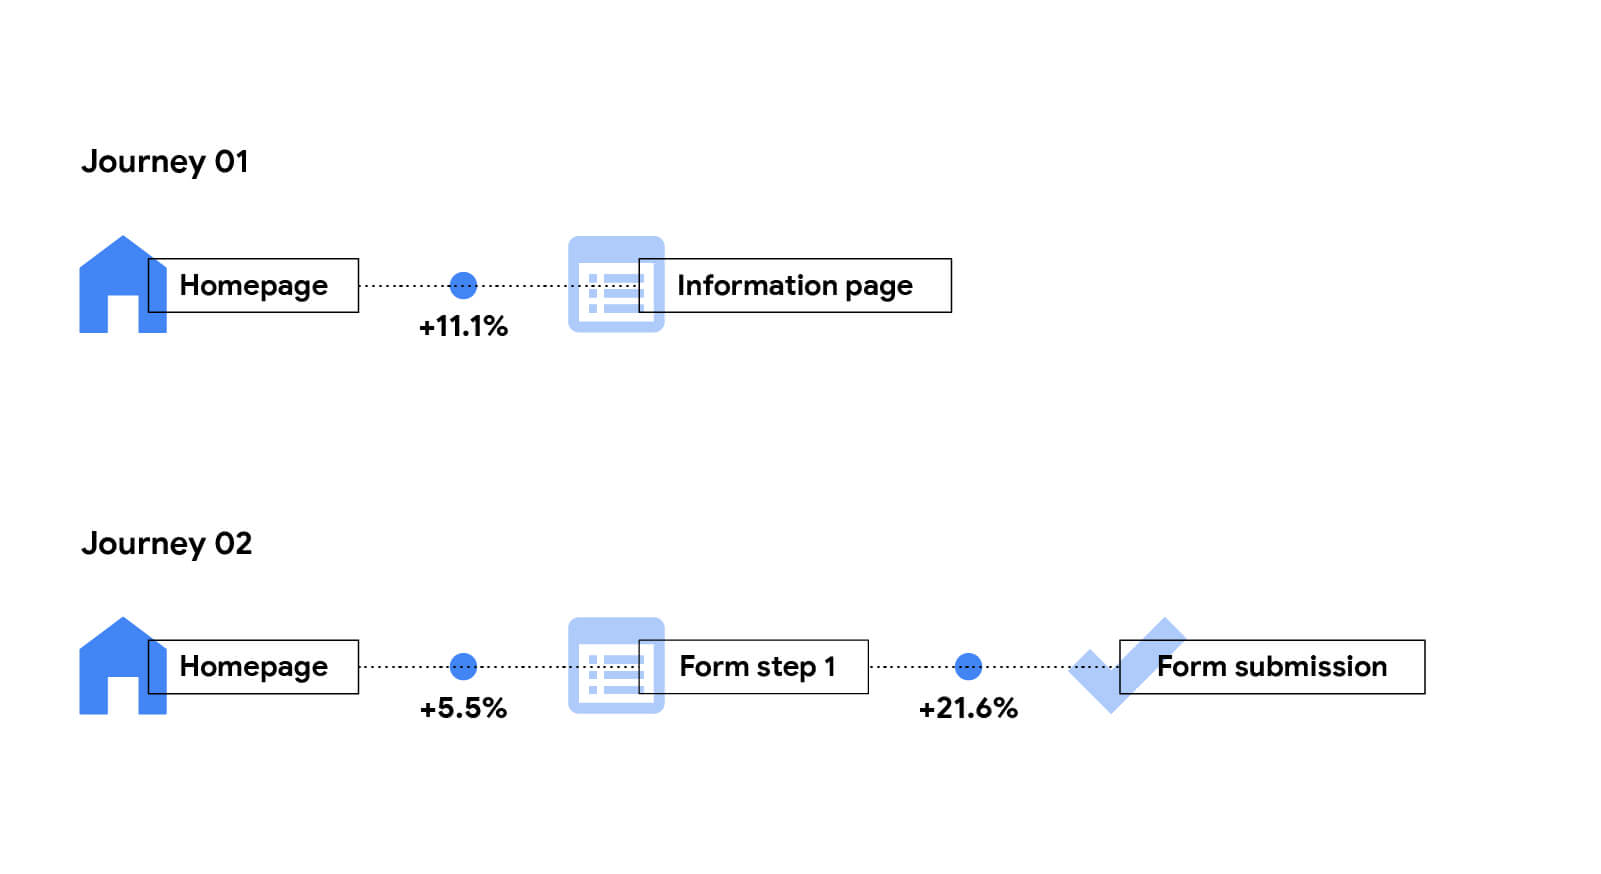
Lead generation
Lead generation sites also saw a positive impact across the board, with the highest impact being a 21.6% improvement in the number of users that progressed to the Form Submission Page. A 7% increase in page views was also recorded.
About the study
The study was commissioned by Google and conducted by 55 and Deloitte. The aim of the study was to determine whether mobile site speed has an impact on brand revenue. The research team studied 37 leading European and American brand sites, collecting data on over 30 million user sessions. The tracking and analytics setups of each site was rigorously audited. No UX redesigns occurred on any of the sites during the duration of the study. Mobile load times were monitored hour-by-hour for 30 days at the end of 2019. The results were consolidated in real-time against a range of typical revenue-related metrics drawn from each brand's analytics tool.
For more information, read the full Milliseconds Make Millions report.