

Source maps are a crucial tool in modern web development that make debugging significantly easier. This page explores the basics of source maps, how they're generated, and how they improve the debugging experience.
The need for source maps
Early web apps were built with low complexity. Developers deployed HTML, CSS, and JavaScript files directly to the web.
More modern and complex web apps can need a variety of tools in their development workflow. For example:
- Templating languages and HTML preprocessors: Pug, Nunjucks, Markdown.
- CSS preprocessors: SCSS, LESS, PostCSS.
- JavaScript frameworks: Angular, React, Vue, Svelte.
- JavaScript meta frameworks: Next.js, Nuxt, Astro.
- High-level programming languages: TypeScript, Dart, CoffeeScript.

These tools require a build process to transpile your code into standard HTML, JavaScript, and CSS that browsers can understand. It's also common practice to optimize performance by minifying and combining these files, using a tool like Terser.
For example, using build tools, we can transpile and compress the following TypeScript file into a single line of JavaScript. You can try it for yourself in this demo on GitHub.
/* A TypeScript demo: example.ts */

document.querySelector('button')?.addEventListener('click', () => {
  const num: number = Math.floor(Math.random() * 101);
  const greet: string = 'Hello';
  (document.querySelector('p') as HTMLParagraphElement).innerText = `${greet}, you are no. ${num}!`;
  console.log(num);
});
A compressed version would be:
/* A compressed JavaScript version of the TypeScript demo: example.min.js  */

document.querySelector("button")?.addEventListener("click",(()=>{const e=Math.floor(101*Math.random());document.querySelector("p").innerText=`Hello, you are no. ${e}!`,console.log(e)}));
However, compressing your code can make debugging more difficult. Source maps can remove this problem: by mapping your compiled code back to the original code, they can help you quickly find the source of an error.
Generate source maps
Source maps are files whose names end with .map (for example,
example.min.js.map and styles.css.map). They can be generated by most build
tools, including Vite, webpack,
Rollup, Parcel, and
esbuild.
Some tools include source maps by default. Others might need additional configuration to produce them:
/* Example configuration: vite.config.js */
/* https://vitejs.dev/config/ */

export default defineConfig({
  build: {
    sourcemap: true, // enable production source maps
  },
  css: {
    devSourcemap: true // enable CSS source maps during development
  }
})
Understand the source map
To help with debugging, these source map files contain essential information about how the compiled code maps to the original code. Here's an example of a source map:
{
  "mappings": "AAAAA,SAASC,cAAc,WAAWC, ...",
  "sources": ["src/script.ts"],
  "sourcesContent": ["document.querySelector('button')..."],
  "names": ["document","querySelector", ...],
  "version": 3,
  "file": "example.min.js.map"
}
To understand each of these fields, you can read the source map specification or The anatomy of a source map.
The most important part of a source map is the mappings field. It uses a
VLQ base 64 encoded string
to map lines and locations in the compiled file to the corresponding original
file. You can view this mapping using a source map visualizer like
source-map-visualization or
Source Map Visualization.

The generated column on the left shows the compressed content, and the original column shows the original source.
The visualizer color-codes each line in the original column with its corresponding code in the generated column.
The mappings section shows decoded mappings of the code. For example, the
entry 65 -> 2:2 means:
- Generated code: The word
conststarts at position 65 in the compressed content. - Original code: The word
conststarts at line 2 and column 2 in the original content.
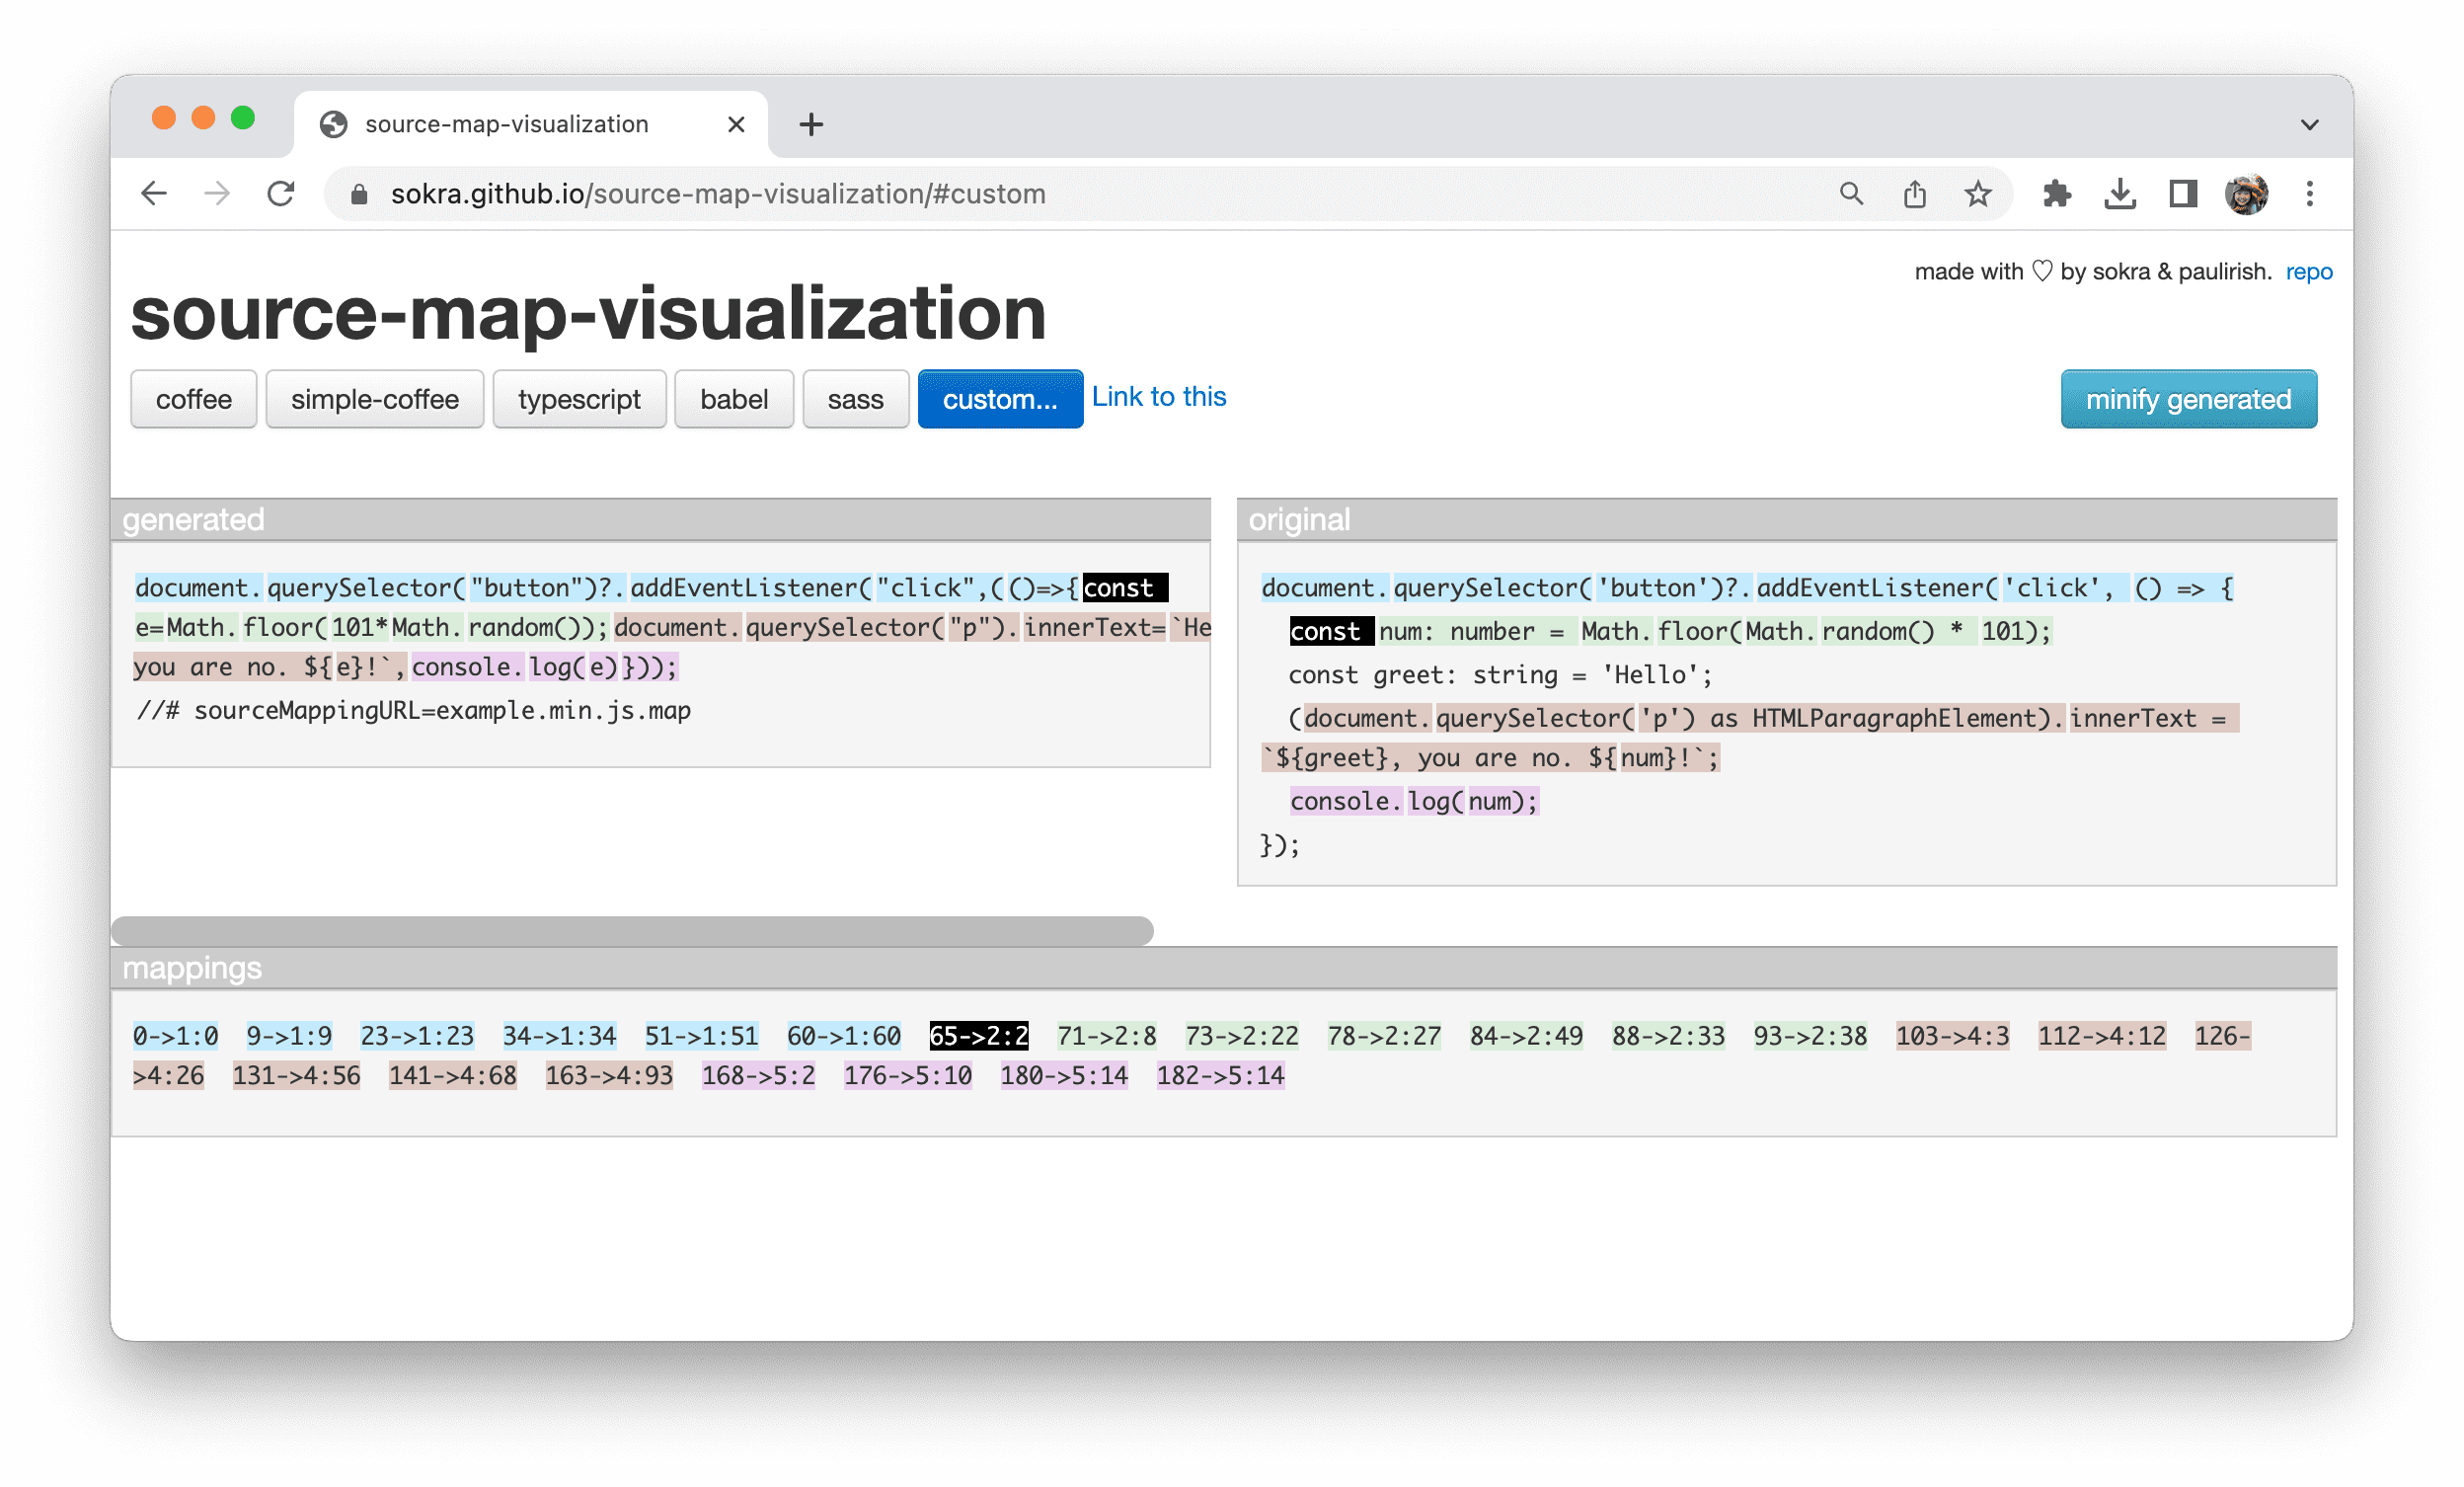
65 -> 2:2 entry.This lets developers quickly identify the relationship between the minified code and the original code, making debugging a smoother process.
Browser developer tools apply these source maps to help you pinpoint your debugging issues quickly in the browser.

Source map extensions
Source maps support custom extension fields that start with an x_ prefix. One
example is the x_google_ignoreList extension field proposed by Chrome
DevTools. See x_google_ignoreList
to learn more about how these extensions help you focus on your code.
Source map drawbacks
Unfortunately, source mappings aren't always as complete as you need them to be.
In our first example, the variable greet was optimized away during the build
process, even though its value is directly embedded into the final string output.

greet variable in the original
code is missing from the mapping.In this case, when you debug the code, developer tools might not be able to infer and display the actual value. This kind of error can make your code monitoring and analysis harder.

greet.This is a problem that needs to be solved within the design of source maps. One potential solution is to include scope information in the source maps in the same way other programming languages do with their debug information.
However, this requires the whole ecosystem to work together to improve the source map specification and implementation. To follow the ongoing on improving debuggability with source maps, refer to the proposal for Source Maps v4 on GitHub.