

When you set a personal, business or family budget, you are setting a limit to your spending and making sure you stay within it. Performance budgets work in the same way, but for metrics that affect website performance.
With a performance budget established and enforced you can be sure that your site will render as quickly as possible. This will provide a better experience for your visitors and positively impact business metrics.
Here's how to define your first performance budget in a few simple steps.
Preliminary analysis
If you are trying to improve the performance of an existing site, start by identifying the most important pages. For example, these could be pages that have the highest amount of user traffic or a product landing page.
After you identify your key pages, it's time to analyze them. First, we'll focus on the timing milestones that best measure the user experience.
Under the Audits panel in Chrome DevTools, you'll find Lighthouse. Run audits on each page in a Guest window to record these two times:
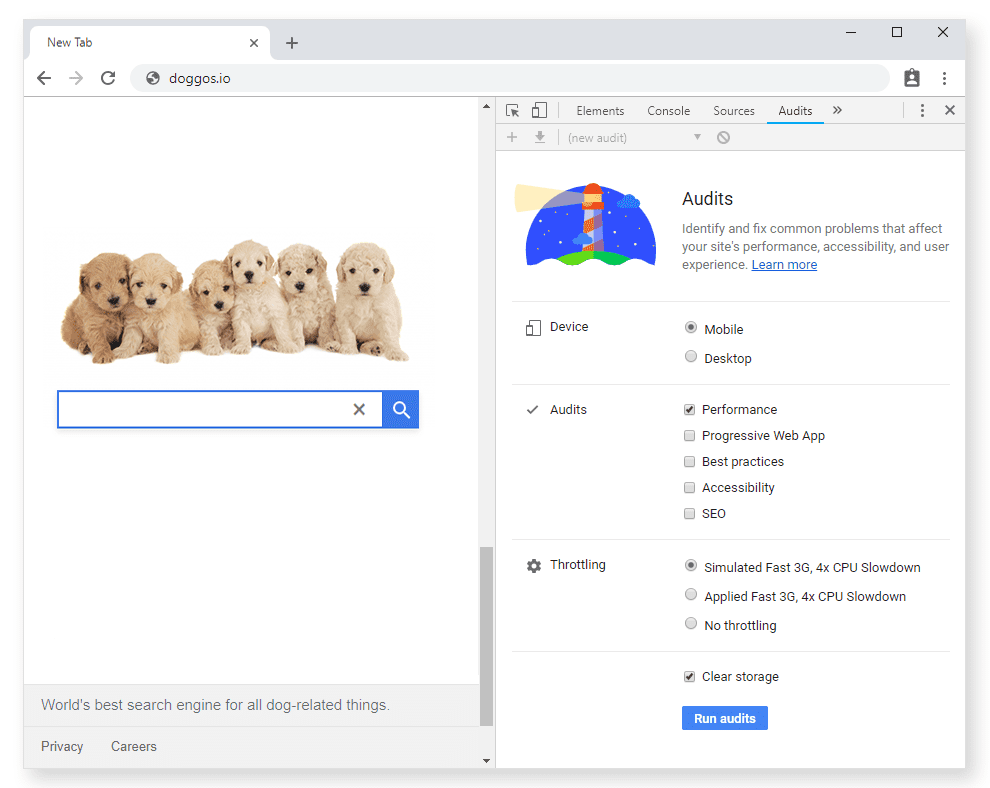
Let's take a highly specialized search engine, Doggos.com, as an example. Doggos.com aims to index all dog-related things on the internet, and its most important pages are the home and results pages. Here are the FCP and TTI numbers measured for the site on desktop and mobile.
| Desktop | FCP | TTI |
|---|---|---|
| Homepage | 1,680 ms | 5,550 ms |
| Results page | 2,060 ms | 6,690 ms |
| Mobile | FCP | TTI |
|---|---|---|
| Homepage | 1,800 ms | 6,150 ms |
| Results page | 1,100 ms | 7,870 ms |
Competitive analysis
Once you've analyzed your own site, it's time to analyze your competitors' sites. Comparing results from websites similar to yours is a great way to figure out a performance budget. Whether you are working on an established project or starting from scratch, this is an important step. You get competitive advantage when you are faster than your competitors.
If you are not sure which sites to look at, here are a few tools to try:
- Google search's "related:" keyword
- Alexa's similar sites feature
- SimilarWeb

For a realistic picture, try to find 10 or so competitors.
Budget for timing milestones
Our niche search engine in this example has a handful of competitors and we'll focus on optimizing the homepage for mobile devices. Over half of the internet traffic today happens on mobile networks and using mobile numbers as default will benefit not only your mobile users, but your desktop users as well.
Create a chart with FCP and TTI times for all the similar websites and highlight the fastest in the bunch. A chart like this one gives you a clearer picture of how your website is doing compared to the competition.
| Site/Homepage | FCP | TTI |
|---|---|---|
| goggles.com | 880 ms | 3,150 ms |
| Doggos.com | 1,800 ms | 6,500 ms |
| quackquackgo.com | 2,680 ms | 4,740 ms |
| ding.xyz | 2,420 ms | 7,040 ms |

There's room for improvement and a good guideline for that is the 20% rule. Research states that users recognize a difference in response times when it's greater than 20%. This means that if you want to be noticeably better than the best comparable site, you have to be at least 20% faster.
| Measure | Current time | Budget (20% faster than competition) |
|---|---|---|
| FCP | 1,800 ms | 704 ms |
| TTI | 6,500 ms | 2,520 ms |
If you are trying to optimize an existing site that goal may seem impossible to reach. This is not a sign for you to give up. Start with small steps and set a budget at 20% faster than your current speed. Keep optimizing from there.
For Doggos.com, a revised budget could look like this.
| Measure | Current time | Initial budget (20% faster than the current time) | Long-term goal (20% faster than competition) |
|---|---|---|---|
| FCP | 1,800 ms | 1,440 ms | 704 ms |
| TTI | 6,500 ms | 5,200 ms | 2,520 ms |
Combine different metrics
A solid performance budget combines different types of metrics. We've already defined the budget for milestone timings and now we'll add two more to the mix:
- quantity-based metrics
- rule-based metrics
Budget for quantity-based metrics
Whatever total page weight number you come up with, try to deliver under 170 KB of critical-path resources (compressed/minified). This guarantees your website will be fast even on inexpensive devices and slow 3G.
You can have a bigger budget for the desktop experience, but don't go wild. The median page weight on both desktop and mobile is over 1MB according to the HTTP Archive data for the last year. To get a performant website you have to aim well below these median numbers.
Here are a few examples based on TTI budgets:
| Network | Device | JS | Images | CSS | HTML | Fonts | Total | Time to Interactive budget |
|---|---|---|---|---|---|---|---|---|
| Slow 3G | Moto G4 | 100 | 30 | 10 | 10 | 20 | ~170 KB | 5s |
| Slow 4G | Moto G4 | 200 | 50 | 35 | 30 | 30 | ~345 KB | 3s |
| WiFi | Desktop | 300 | 250 | 50 | 50 | 100 | ~750 KB | 2s |
Defining a budget based on quantity metrics is a tricky business. An e-commerce website with loads of product photos is very different from a news portal which is mostly text. If you have ads or analytics on your site, that increases the amount of JavaScript you're shipping.
Use the table above as a starting point and adjust based on the type of content you are working with. Define what your pages will include, review your research and take an educated guess for individual asset sizes. For example, if you are building a website with a lot of images, put stricter limits to JS size.
Once you have a working website, check how you are doing on user-centric performance metrics and adjust your budget.
Budget for rule-based metrics
Very effective rule-based metrics are Lighthouse scores. Lighthouse grades your app in 5 categories and one of those is performance. Performance scores are calculated based on 5 different metrics, including First Contentful Paint and Time to Interactive.
When you try to build a great site, set Lighthouse performance score budget to at least 85 (out of 100). Use Lighthouse CI to enforce it on pull-requests.
Prioritize
Ask yourself what level of interaction you expect on your site. If it's a news website, users' primary goal is to read content so you should focus on rendering quickly and keeping FCP low. Doggos.com visitors want to click on relevant links as soon as possible, so the top priority is low TTI.
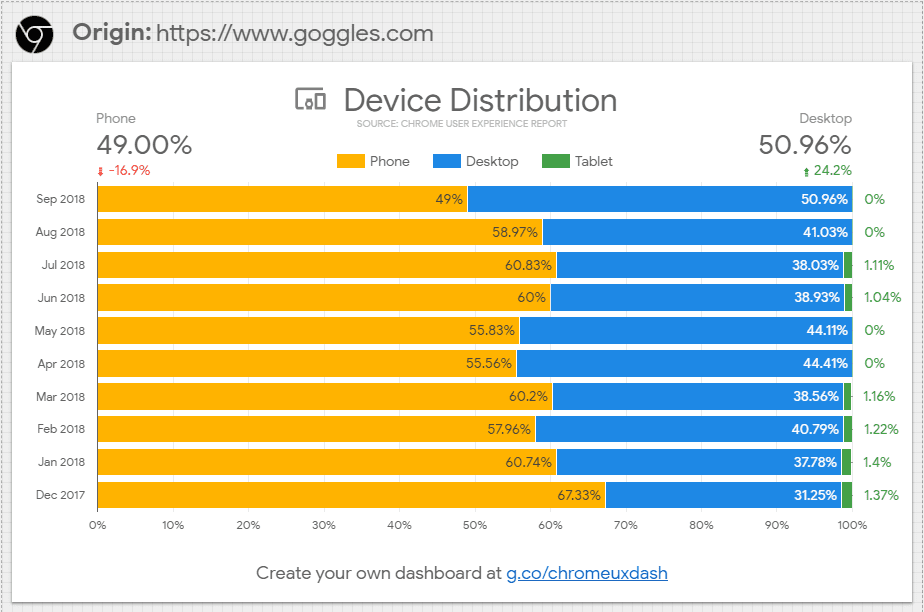
Find out exactly what part of your audience browses on desktop vs. on mobile devices and prioritize accordingly. One way to figure this out is to check what your audience is doing on competitors' websites, through the Chrome User Experience report dashboard.
Next steps
Make sure your performance budget is enforced throughout the project and incorporate it into your build process.