
The web team at Zalando found that integrating Lighthouse CI enabled a proactive approach to performance, with automated status checks able to compare the current commit to the main branch to prevent performance regressions.


With more than 35 million active customers, Zalando is Europe's leading online fashion platform. In this post we explain why we started to use Lighthouse CI, the ease of implementation, and the advantages to our team.
At Zalando, we know the relationship between website performance and revenue. In the past, we tested how artificially increasing the loading time on Catalog pages affected bounce rates, conversion rates, and revenue per user. The results were clear. A 100 milliseconds page load time improvement led to increased engagement with lower bounce rate and a 0.7% uplift in revenue per session.
100ms
Page load time improvement
0.7%
Increased revenue per session
Company buy-in does not always translate to performance
Despite the strong performance buy-in inside the company, if performance is not set as a product delivery criteria it can easily slip away. When we were redesigning Zalando website in 2020 we focused on delivering new features while maintaining excellent user experience and applying a facelift to the website with custom fonts and more vibrant colors. However, when the redesigned website and app were ready for release, early adopter metrics revealed that the new version was slower. First Contentful Paint was up to 53% slower, and our measured Time to Interactive reported up to 59% slower.
The web at Zalando
The Zalando website is created by a core team developing a framework, with over 15 feature teams contributing frontend microservices. While supporting the new release, we also transitioned part of our website to a more centralized architecture.
The previous architecture called Mosaic included a way to measure page performance with in-house metrics. However, it was difficult to compare performance metrics prior to rolling out to real users as we lacked internal lab performance monitoring tools. Despite deploying every day, there was a feedback loop of around one day for developers working on performance improvements.
Web Vitals and Lighthouse to the rescue
We were not entirely satisfied with our in-house metrics as they did not adapt well to our new setup. More importantly, they were not centered on customer experience. We switched to Core Web Vitals as they provided a condensed, yet comprehensive and user-centric set of metrics.
In order to improve the performance before the release, we needed to create a proper lab environment. This provided reproducible measurements, in addition to testing conditions representing our 90th percentile of field data. Now, engineers working on performance improvements knew where to focus their efforts to make the biggest impact. We were already using Lighthouse audit reports locally. So our first iteration was to develop a service based on Lighthouse node module, where changes could be tested from our staging environment. This gave us a reliable performance feedback loop of around one hour, which enabled us to bring the performance on par and save our release!
Giving performance feedback to developers on pull requests
We did not want to stop there, as we wanted to take the opportunity to not only be reactive towards performance but also proactive. Making the jump from Lighthouse node module to Lighthouse CI (LHCI) server was not too difficult. We opted for the self hosted solution in order to give us a a better integration with our existing company services. Our LHCI server application gets built as a Docker image, which is then deployed to our Kubernetes cluster together with a PostgreSQL database, and reports to our GitHub.
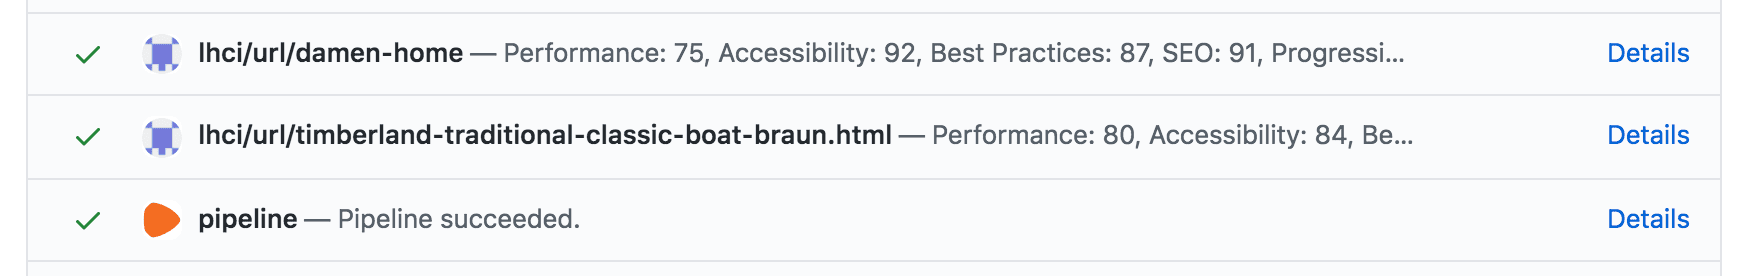
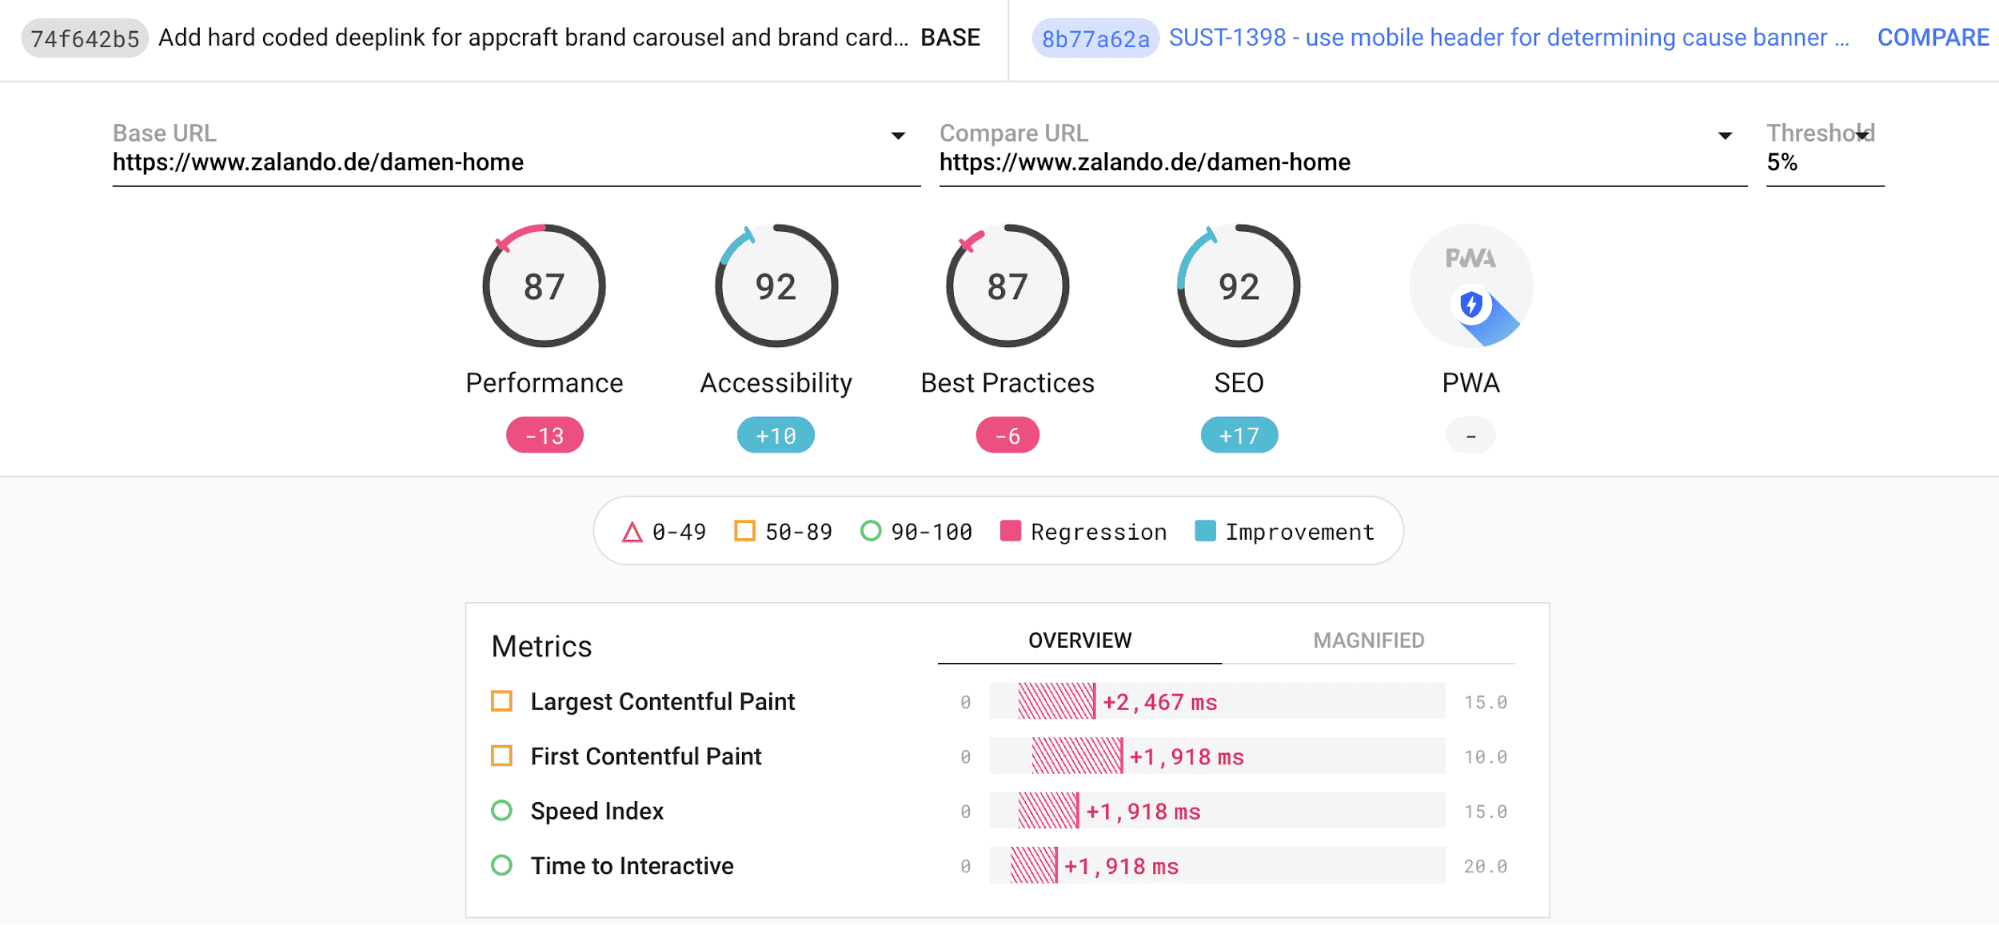
Our framework was already providing some performance feedback to developers— component bundle sizes were being compared to threshold values on every commit. Now we are able to report Lighthouse metrics as GitHub status checks. These cause the CI pipeline to fail if they do not meet the performance thresholds, with a link to the detailed Lighthouse reports as shown in the following images.
Extending the performance coverage
We started with a very pragmatic approach. Currently Lighthouse only runs on two of our most important pages: the home page and product detail page. Fortunately, Lighthouse CI makes it easy to extend the run configurations. Feature teams working on specific pages of our website are able to set up their matching URL pattern and assertions. With this in place, we are pretty confident that our performance coverage will increase.
We are now much more confident when building larger releases, and developers can enjoy a much shorter feedback loop on the performance of their code.