
How the e-commerce fashion retailer correlated Core Web Vitals and performance metrics with business metrics, saw an increase in KPIs and built a "Performance Business Case Calculator" to drive product decisions and a performance culture.


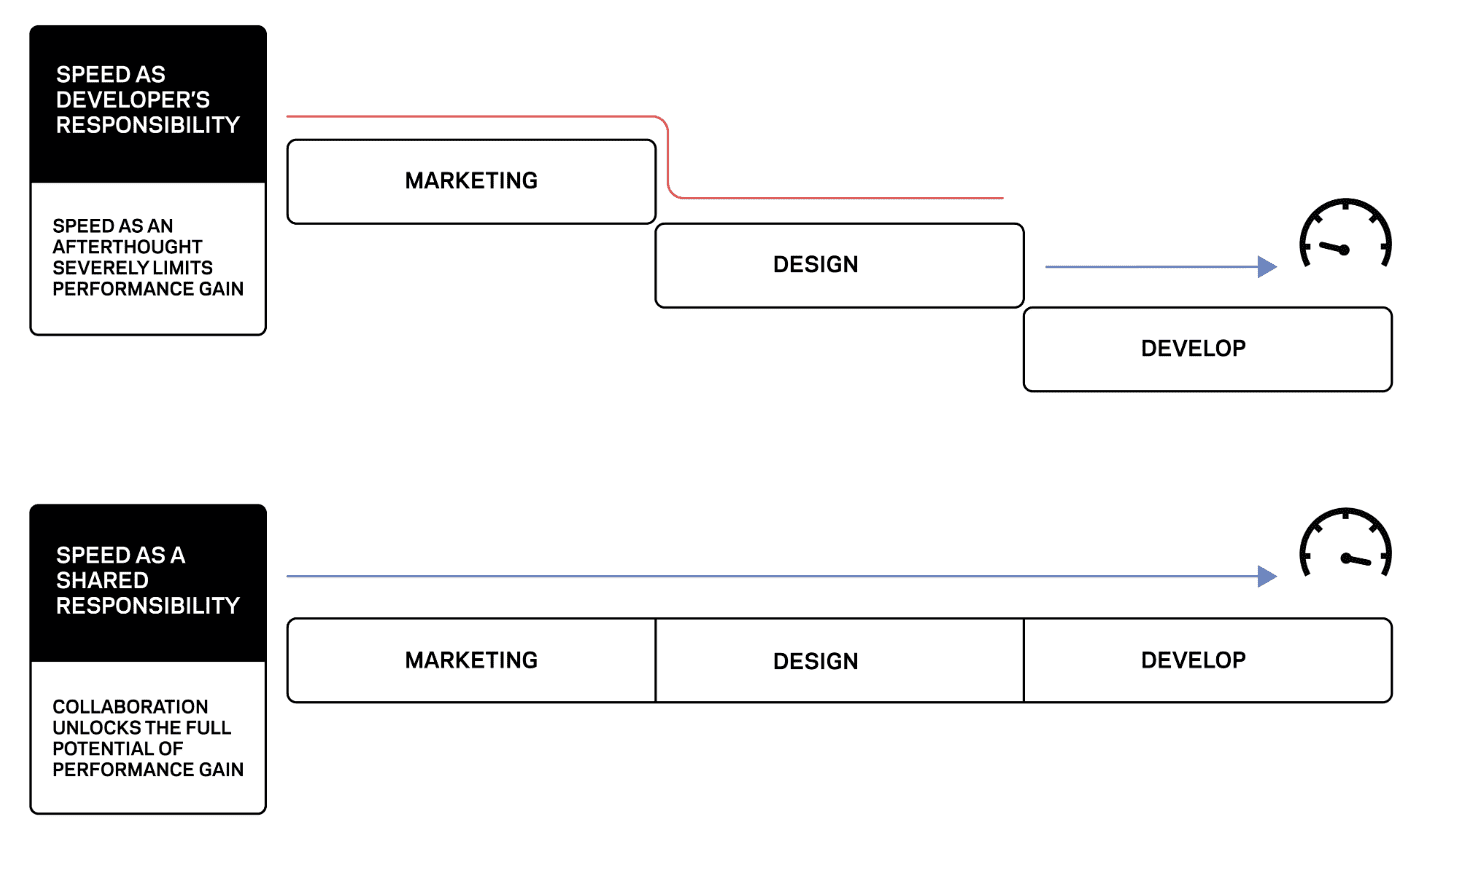
Inside many companies, website speed performance and Core Web Vitals are still mostly seen as the responsibility of the engineering teams. Site speed can become invisible to other areas of the business if the business and customer experience worth is not understood. This can cause performance to be overlooked when key decisions are made and roadmaps are defined.
To improve the performance culture across teams and drive significant improvements to their web experience, luxury e-commerce fashion retailer Farfetch launched a project to define and use true customer-centric performance metrics. They aimed to correlate these to business metrics as a way of illuminating how performance affects the company's KPIs.
Their ambitions didn't end there, though. Ultimately, the project's objective was cultural change at scale—breaking down silos within the organization and introducing a new business-oriented language to give everyone a shared way to talk about what used to be considered technical topics. Farfetch wanted to have website speed performance as a shared responsibility, facilitate informed decision making and establish it as a main pillar of what makes a good web experience.
To kick off, Farfetch realized a single department couldn't achieve this as before and assembled a core team of experts from various areas in the company—engineering, infrastructure, architecture, and product—that put in place a step-by-step strategy to revamp how the company looked at this topic.
Step 1: Defining, measuring and monitoring metrics
First of all, Farfetch needed to have the right monitoring tools in place to understand current state and deviations across journey touchpoints and applications.
They used both lab data and real user monitoring (field data) to track Core Web Vitals and additional user-centric performance metrics to analyze the current state of speed performance. They used JavaScript and the web-vitals.js library to capture the data, which allowed the product analytics team to gain visibility of performance metrics alongside business metrics in the same session and thereby start examining how one affects the other.
The multidisciplinary group set out to understand which metrics mattered most for the business. To do so, they looked at the critical journey path of Farfetch users and tried to link that journey with performance markers. In addition to the Core Web Vitals metrics that Google has outlined, each representing a distinct facet of the user experience, they also used custom JavaScript to track Time to First Byte (TTFB), First Contentful Paint (FCP), First Paint and Time to Interactive (TTI).
The metrics are collected using several methods of the Performance API, Long Tasks API and Google's polyfills. More details can be found in this mid 2020 Farfetch Tech Blog post by Manuel Garcia, Senior Principal Engineer for the Web.
On the data analytics side, Farfetch have their own multi-channel tracking solution used by front end applications called Omnitracking. It tracks the events generated by page views, user actions and system actions. The Omnitracking Data Model is Farfetch's solution for analytical, data exploration and reporting cases, made on the top of the events generated by trackers. The data model's objective is to help and support anyone who needs to understand:
- User behavior
- User experience on Farfetch applications
- Applications usage
- Macro and micro conversions
- Cross channel and funnel analysis
The idea was then to add the performance data of each pageview on farfetch.com, captured by JavaScript, to this data layer. Following this model guaranteed a match between performance data and the main conversion funnel metrics for each session and the base for an analytical exploration on the topic.
Finally, Farfetch established time-based performance budgets for each metric across the main journey pages and a governance process to handle budget breaches. They've also started incorporating performance metrics on CI pipelines to understand budget deviations as soon as possible in the development flow.
Step 2: Communicating via business language
With performance data now available in Farfetch's internal business intelligence datasets, the analytics team started exploring mathematical models and patterns in the data that could indicate a correlation between performance metrics and business KPIs (for example, conversion rate and percentage of single-page visits), allowing a new view of the financial impact of site speed and UX for the business. This enabled performance to be discussed in a common language with the business decision makers. The analysis included all Core Web Vitals and the other metrics Farfetch deemed valuable. It revealed truly impactful insights.
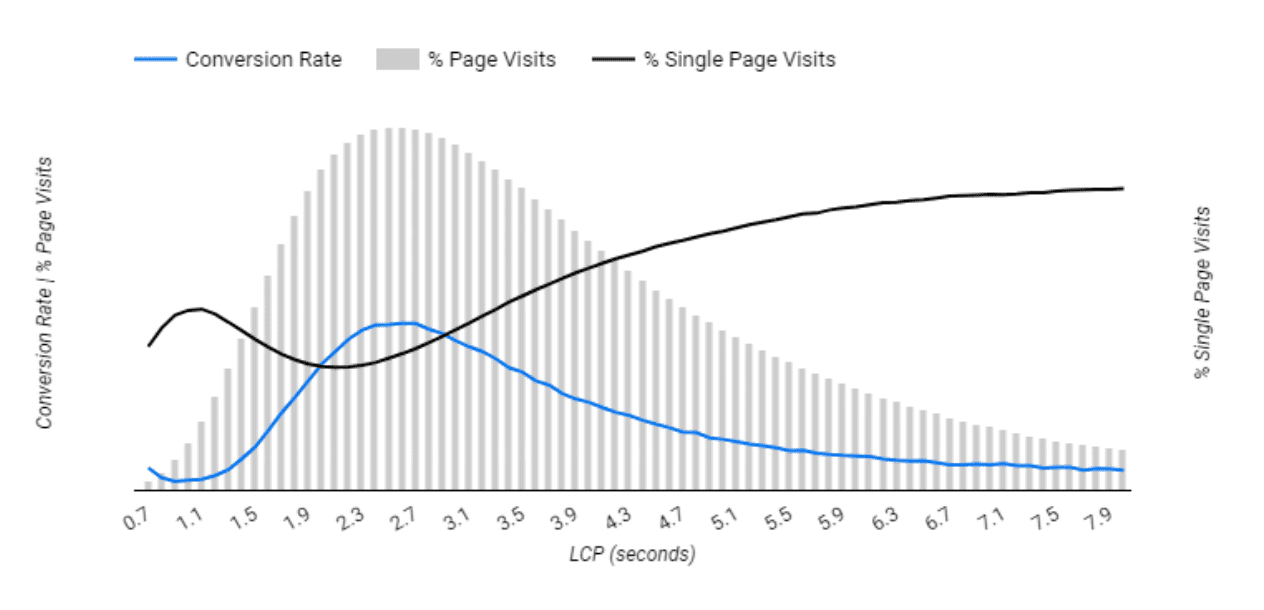
Having in mind that Google recommends Largest Contentful Paint (LCP) to stay below 2.5 seconds to provide an optimal user experience, Farfetch studied this threshold carefully and found meaningful results.
Farfetch statistical correlation analysis showed that beyond that point, the conversion rate starts to drop, as well as the exit rate rises. This shows that users really start to feel the downside of a slow page load perception and conversion rate decreases on average -1.3% with each 100ms more of LCP.
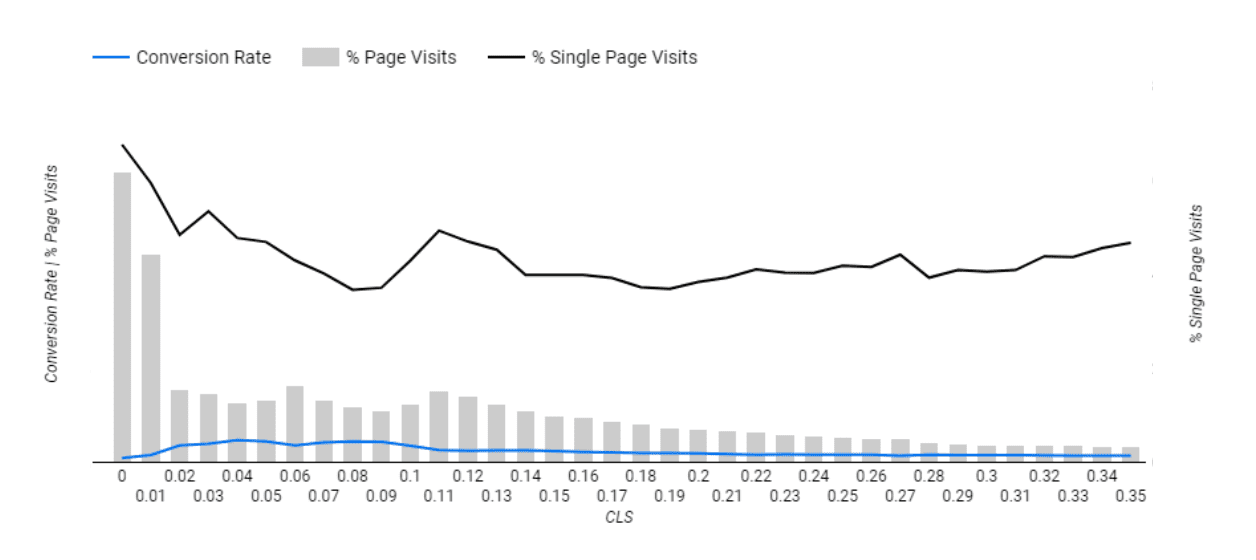
Farfetch also verified an exit rate decrease of -3.1% for each 0.01 less on the Cumulative Layout Shift (CLS) score, reaffirming the impact of page stability to keep users on a website.
Regarding page interactivity and fluidity, although First Input Delay (FID) is tracked and analyzed continuously, Farfetch also measures TTI, which proved to be a considerably impactful metric for the Farfetch business conversion funnel.
For this, they injected Google's TTI polyfill into the website to store this metric. Using the Long Tasks API to report long tasks (tasks taking longer than 50 milliseconds on the browser's main thread).
The analytics team was then able to find that the conversion rate increased 2.8% for each second reduction on TTI, making a strong case for better code efficiency and unclogging the browser's main thread.

In the end, this analysis was also able to show that some metrics didn't have a significant impact on business KPIs, or some would be more relevant at different stages of the user journey. This allowed for a complete understanding of the opportunities at hand on each point of the conversion funnel.
Step 3: Embedding cultural change
Showcasing the insights above alongside qualitative user research on user perception of site speed was paramount to establish alignment with company goals, secure executive-level awareness and buy-in for performance based decision making across product roadmaps. It was now possible to prove how much performance was worth for Farfetch.
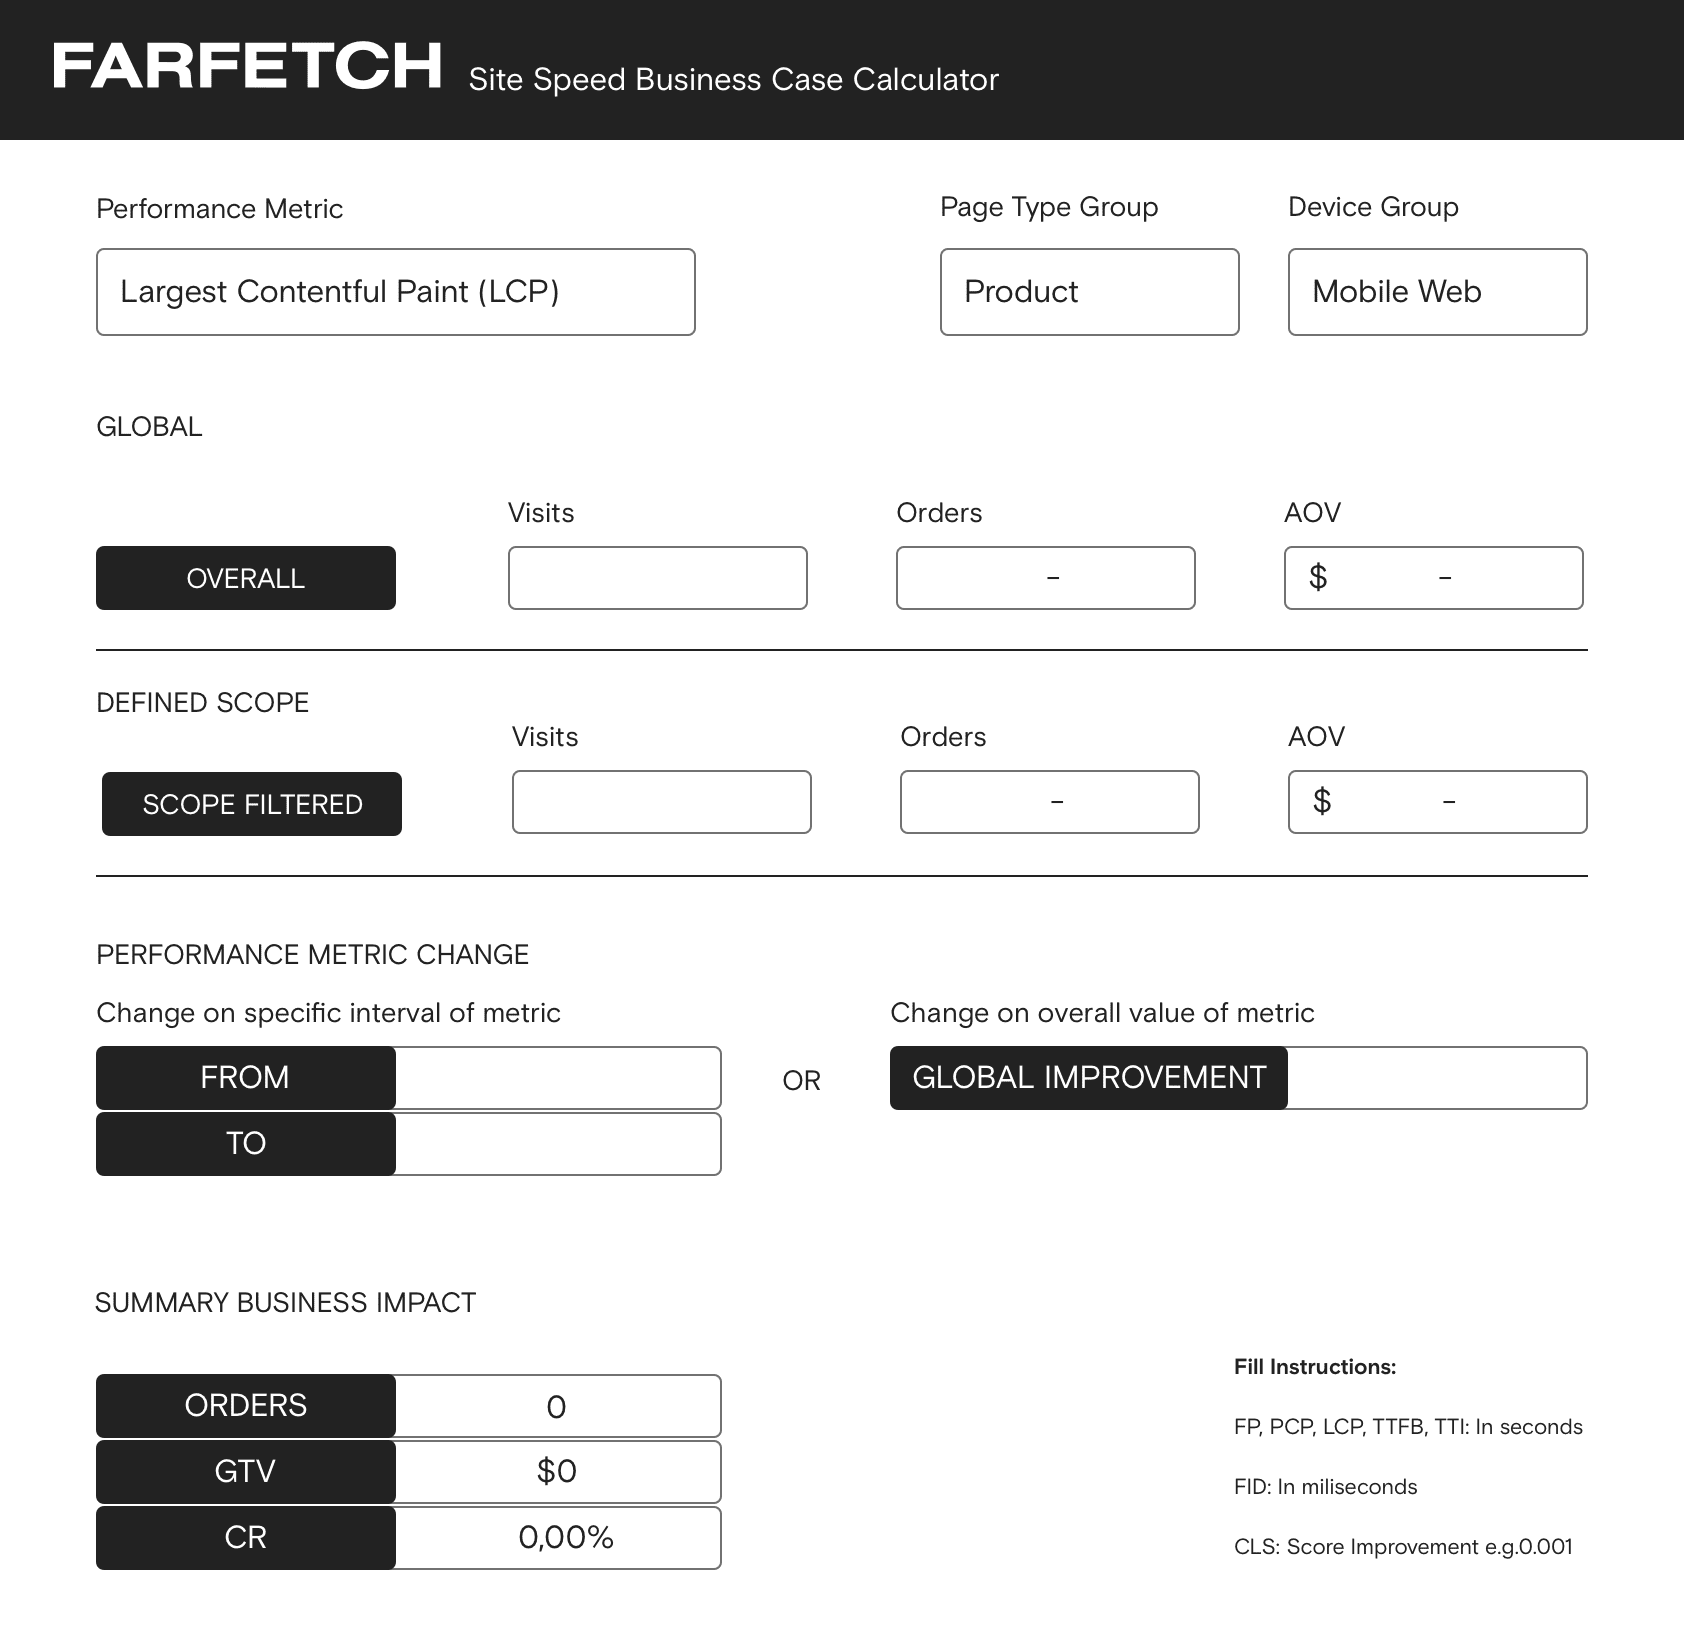
To streamline prioritization, Farfetch created a self-service tool they named the Site Speed Business Case Calculator, taking inspiration from Google's Speed Impact Calculator. It allows any product manager to create a business case out of performance improvements by calculating the business impact on the fly. With a data model using the correlation between conversion rate and user experience metrics, it's flexible to adapt to different product scopes, devices and user journey touch points.
Meanwhile, a set of self-service analytical dashboards have created business-wide visibility of real-time performance indicators and their impact on the business. Performance is now becoming fully embedded in product development, and product teams enjoy easy access to metrics, auditing tools, and performance budget monitoring. Furthermore, because of the data layer integration, performance metrics are also available on Farfetch A/B testing tooling, giving product managers yet another powerful vector of insights.
In recent months, the core team is also on track to establish this culture not only on front-end development teams but also within the platform domain, using similar methodologies to monitor and prove the impact of the main micro services and transactions.
There have been a number of Farfetch driven presentations on this topic but also external mentions. For example, a mention on a 2021 Google I/O talk on the business impact of Core Web Vitals. This also contributed to giving continuous relevance to the theme and solidified the team's strategy on culture.
Step 4: Improving metrics
In the end, all of this work needed to contribute to Farfetch objectively improving their website speed metrics, and guaranteeing that their teams would follow best in class practices and pursue enhancement opportunities.
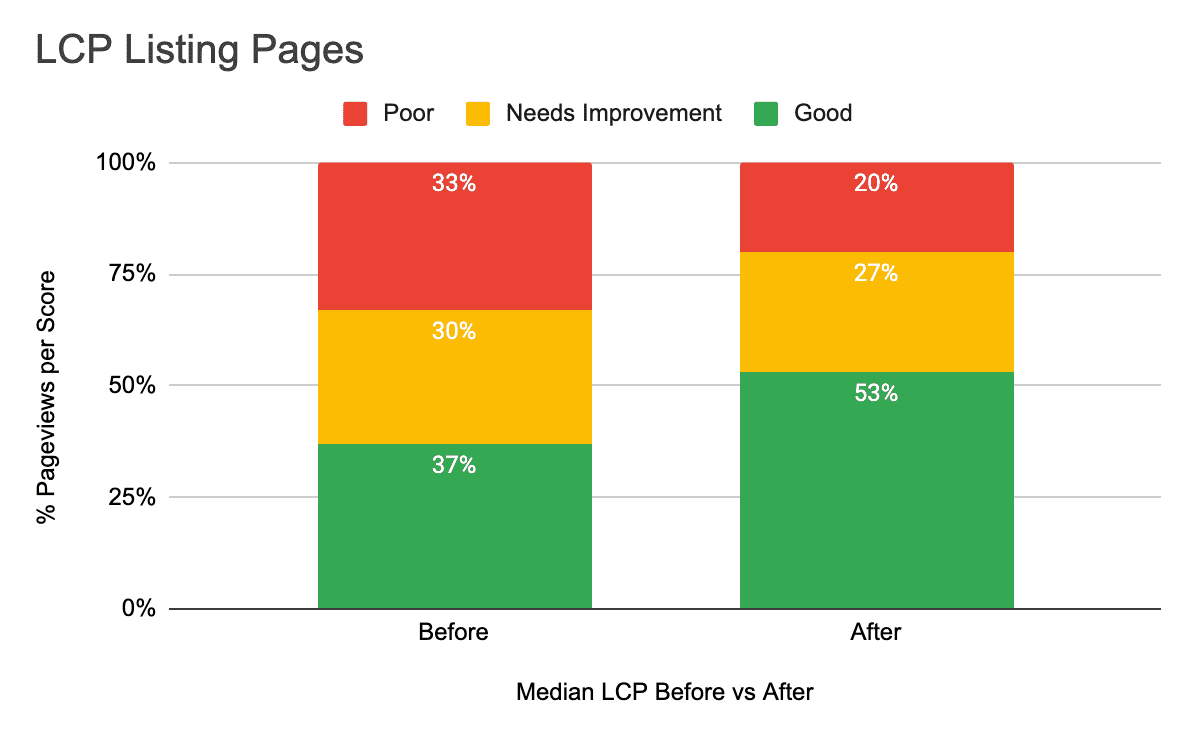
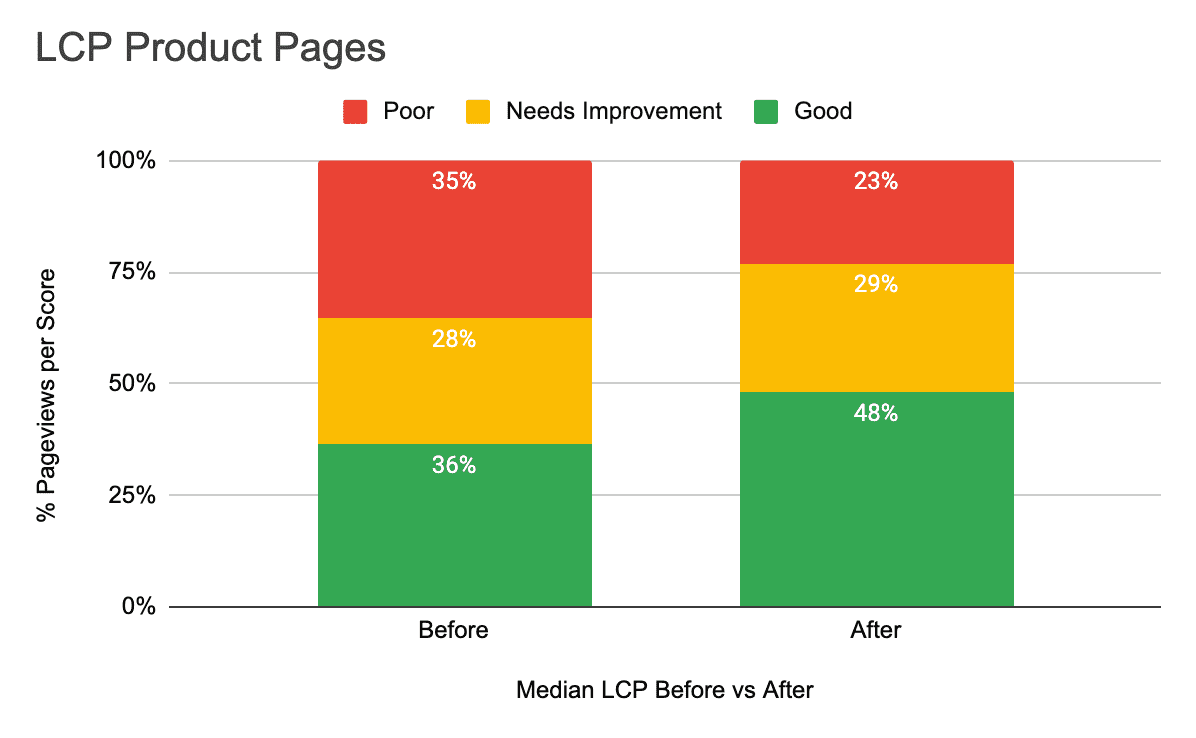
One of the main opportunities detected in 2021 was the need to improve LCP on the two main page types of Farfetch—product pages and product listing pages.
The teams addressed how they were loading the main content of those pages. Armed with a business case that showed the impact of chasing this opportunity, they were able to:
- Adapt the product image loading component from a JavaScript-based solution to a native implementation.
- Define the priority of the images and divide them into critical and non-critical assets.
- Load critical images early, with the source already inline in the HTML and using
<link rel="preload">so they download as soon as possible. - Use the
<img loading="lazy">attribute for non-critical images, with a polyfill using Intersection Observer on unsupported browsers, such as Safari.
With this, they were able to move the needle and prove through A/B testing the hypothesis and business impact. On product pages for example, this effort shaved off more than 600ms, and the A/B test showed an uplift on conversion rate in the range of 1-5% with the company's defined confidence level.
Below are the improvements the team were able to make in terms of the percentage of pageviews that are considered "good", "needs improvement" and "poor", based on Google's definition for LCP score.
The rewards of a faster site and better working practices
Building a culture around performance and tools like the business case calculator allowed everyone to begin speaking a shared language that can be understood by product managers, stakeholders, and engineers alike. This has precipitated ongoing discussions around how to prioritize new initiatives and performance enhancements.
"We wanted to break the cycle of performance being a tech-only concern, something owned only by the engineering team to deal with and fix," explains Farfetch's Web Channels Senior Principal Product Manager, Rui Santos. "Connecting performance metrics with business metrics was surprisingly effective to pass the message across very, very quickly. Business drives the company, and connecting its success to speed metrics encouraged a broader set of stakeholders to understand and navigate the trade-off decisions."
In the luxury e-commerce segment, whether your site is fast or slow can dictate how consumers see your brand and your service quality as a whole. For users, quality equates to luxury—and this applies to every aspect of their experience, including how your website performs. With site speed producing a proven effect on conversion rate, performance now occupies a safe position in forward planning at Farfetch.