
Learn how business decision makers and non-developers can improve Core Web Vitals.

Introduction
Website user experience has been shown to have a direct impact on business outcomes. Delivering a better experience, where websites load and respond to users faster, often results in increased engagement and conversions. Core Web Vitals is an initiative to quantify the user experience of websites to identify areas for improvements.
However, a lot of Core Web Vitals documentation is aimed at web developers, with deep technical understanding and full control over their code. Many websites are created by non-developers using a "site-builder" platform such as WordPress, Shopify, Wix, or other similar solutions often without a web development team.
Even where there is a dedicated team or web developers, they are not the only ones responsible for web performance. Business decision makers have a huge influence over website performance, from deciding content and designs, to developing advertising strategies in an effort to drive more traffic to their websites. These decisions often have a significant impact on website performance.
This guide aims to provide some relevant information for site builders and owners to understand—and improve—their user experience as much as possible, without requiring deep technical knowledge of web development.
At the same time, many performance issues require developers to implement technical fixes, and our developer focused guides can help with these efforts. This is not intended to be a comprehensive guide, but rather more of an introduction to the Core Web Vitals initiative for business decision makers with some common non-development root causes of poor page performance. Beyond these, a web developer will likely need to be engaged to make further progress.
What are the Core Web Vitals?
The Core Web Vitals are a set of three metrics designed to measure a page's user experience—and in particular how fast the page feels to users. Each of these has a three letter abbreviation:
- Largest Contentful Paint (LCP) measures loading performance: how much time, in seconds, it takes for the page's most prominent content to appear after a page has started loading.
- Cumulative Layout Shift (CLS) measures visual stability of a page: how much the content moves around while loading.
- Interaction to Next Paint (INP): how quickly the page responds to clicks, taps, and keyboard interactions.
Each metric measures a different facet of the user experience. Google also provides recommended thresholds for each metric, and user experiences less than the lower threshold is considered good, and user experiences higher than the upper threshold are considered poor. Between these thresholds, a page is considered to be in the needs improvement range. Keep in mind that, with these metrics, lower numbers are better.
How are the Core Web Vitals measured?
Core Web Vitals are measured by the real users of your website, and different users will have different results. They are not "what Google thinks" nor "what googlebot thinks", but what your website's actual users have experienced.
Some users will be on faster devices and faster networks. Some will be on slower devices or slower networks. Some users will visit simpler, faster pages on your site, others more complex, slower pages. The results of all these user experiences are then aggregated to give an overall measure of your entire website.
Google makes the data from opted-in Chrome users available in the Chrome User Experience Report (CrUX), which feeds into many Google tools such as PageSpeed Insights and Google Search Console.
CrUX is available on millions of popular websites, but not all websites are in CrUX. Other Real User Monitoring (RUM) tools can also collect these metrics for your site.
How can I find my site's Core Web Vitals?
There are many tools that show Core Web Vital metrics provided by Google and by third parties. This post introduces two tools that let you quickly view the Core Web Vitals for your site. For a deeper look at the other Google tools—including a workflow for using them to address Core Web Vitals—see the Core Web Vitals workflows with Google tools post.
If your platform provides an integrated RUM solution, it can provide much more detailed information for pages on your site, or allow you to drill down into particular pages or segment your users to help understand and identify issues.
PageSpeed Insights
For a quick view which requires no setup, you can use PageSpeed Insights (PSI). Type in the URL and click analyze. If your site is included in CrUX, you should quickly be presented with a "Discover what your real users are experiencing" section:
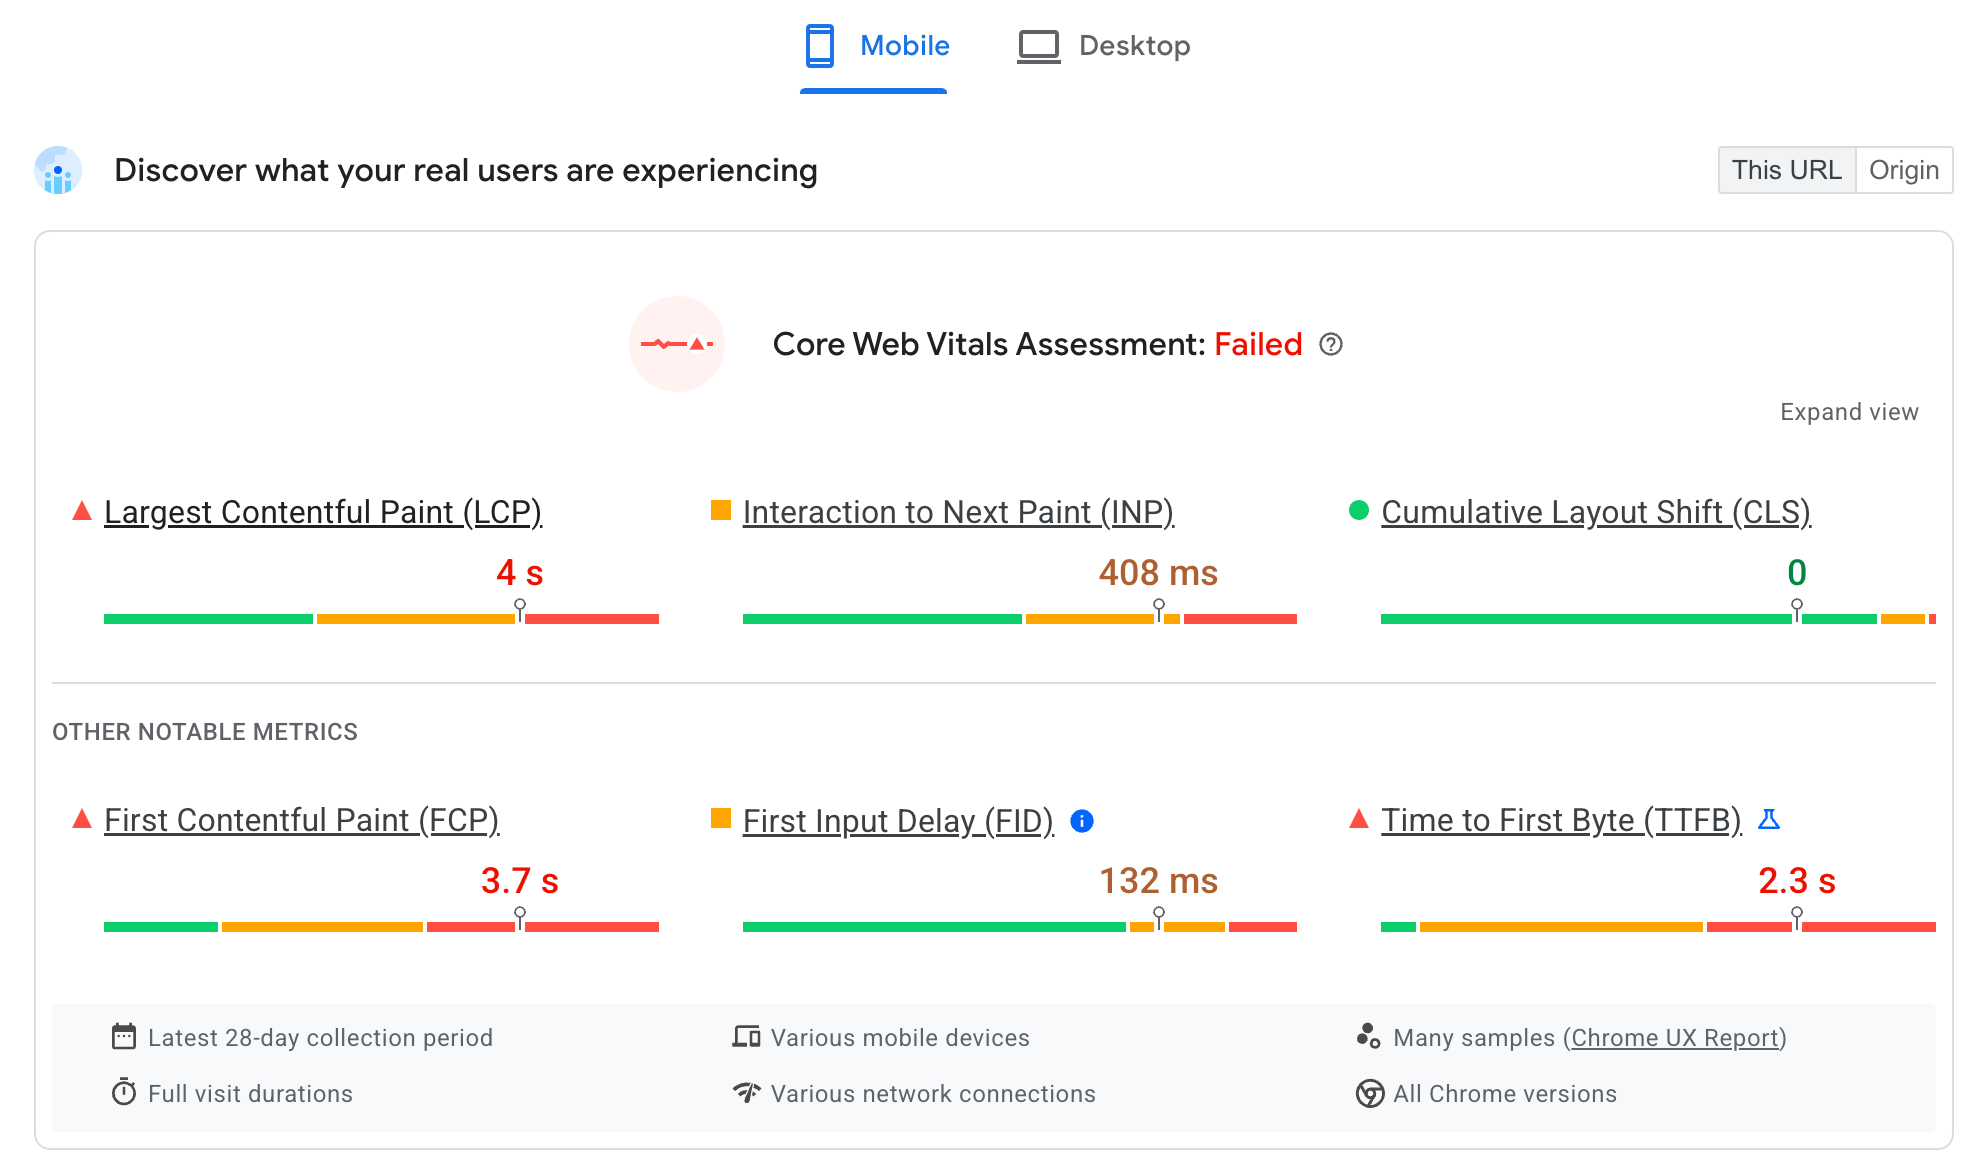
This shows how real Chrome users have experienced your website over the last 28 days. You'll see the three Core Web Vitals at the top, along with other supporting metrics beneath (including the pending INP metric). Only the Core Web Vitals count in the overall passed or failed assessment at the top of the page, but the other metrics can be useful in troubleshooting problems with Core Web Vitals, as will be shown in the next section.
You can toggle between Mobile and Desktop views using the buttons at the top of this section. You can also toggle between This URL and all data for that Origin using the toggle in the top right, where data exists for both.
These figures should give a broad indicator of how your site is performing and which metrics could be improved and on which device types.
Google Search Console
Google Search Console (GSC) is for site owners only, so it requires registration and verification of site ownership in order to be used. It provides details on how Google Search views your site.
Unlike PageSpeed Insights, GSC lists all the pages that Google Search is aware of on your site, and provides Core Web Vitals details for all of them:
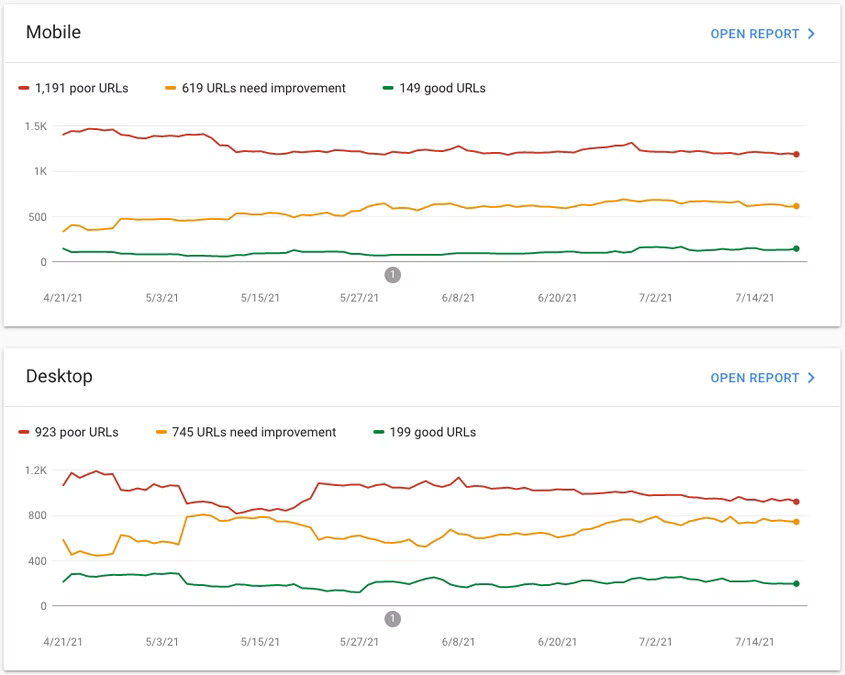
Pages are gathered into URL Groups to allow you to see if certain categories of pages (for example, Product Detail Pages, Blog pages, and so on) have Core Web Vitals issues. As these are usually built on similar technologies or templates, there may be a common cause to any issues in these pages.
Common Core Web Vitals issues for site builders
Many performance issues require developers to implement technical fixes and our developer focused guides can help developers with that. In this section, we discuss some of the common non-developer issues that business decision makers can help with to improve these metrics.
When we say "non-developers" we are referring to those using site-builder platforms where they have limited control over how the site is actually coded or business decision makers who may decide on site design, or help prioritize budgets.
Largest Contentful Paint (LCP) issues
LCP aims to measure loading speed of web pages by measuring the time from when a link is clicked, until the largest piece of content (typically a banner image or a headline) appears in the browser.
For a good page experience, a web page should aim to show this content within 2.5 seconds of the link being clicked. If this takes over 4 seconds, this is considered a poor experience.
Some of the common issues affecting LCP that business decision makers can influence are given in the next sections.
Delays in starting to load the page
We often think about improving the load time of the page itself, but there is often a delay before even starting that. It is impossible to have an LCP under the 2.5 seconds good threshold if the website isn't even downloaded for a few seconds!
Time to First Byte (TTFB) is the time it takes for the first part of your web page to download. If PageSpeed Insights is showing a large TTFB diagnostic metric in red or amber, then addressing that is key and should have a direct knock-on effect to LCP.
Understand your audience
For TTFB issues, it is important to understand your audience. If your website is hosted in one country, but serves a global audience, then geographical proximity between your website's users and your web server becomes a factor in a page's TTFB. A Content Delivery Network (CDN) allows copies of your site to be cached around the world, and therefore closer to your users. Many hosting providers include a CDN as part of their services, and will take care of this automatically. Check if this is the case for where your site is hosted. Some platforms offer different tiers of service with more CDN locations for higher paid tiers. Global businesses should consider higher tiers in these cases.
Minimize redirects
Redirects are another common cause for slow TTFBs. When running ad campaigns or sending out email communications, try to minimize the number of redirects by avoiding using multiple link shorteners, or including by URLs that need to be redirected. For example, using example.com/blog in a campaign which needs to redirect to www.example.com/blog, which then redirects to https://www.example.com/blog adds time to a page's TTFB. Ensure your marketing campaigns use the minimum number of redirects as possible.
Ensure ad campaigns are aimed at the correct audience
Also ensure your ad campaigns are effectively targeting your audience. Getting lots of new traffic from users who are halfway around the world—but whom you cannot deliver your product to—is both wasted ad spend, and negatively impacts your website's performance.
URL parameters can impact web performance
URL parameters such as UTM parameters are often used for marketing campaigns. These can reduce caching effectiveness on your infrastructure, as each URL can look like a unique page—even though the same page is served each time. If you make use of UTM parameters, then speak to your CDN provider or infrastructure teams to ensure that these URL parameters are ignored by their caching infrastructure to allow campaigns to benefit from pages that are already cached.
Media can be costly for performance
Consider the impact of media on your pages. Media such as images and video typically are much larger, and so take longer to download than text. This can also slow down the rest of the page load. This is especially important when the LCP element is media rather than text. The LCP element is an image on approximately 80% of web pages, so it's important you consider the impact of media on your site.
At the same time, media assets can contribute to a rich visual experience for the user that is much for engaging than a text-heavy site. Therefore, removing media is seldom an option, but being aware of the cost of media, and how to reduce that can minimize any performance issues.
Avoid carousels
Carousels made of several images can affect the overall load time of a page as they can require several images to be downloaded at the same time if not implemented optimally. Additionally—despite their ubiquity—carousels often don't provide a great user experience so think carefully before using them on your site.
Use web-optimized images
Then there is the size of media assets. Many images on the web are served at too high of a resolution. Ensure any media partners or design agencies supply web-optimized images rather than the full sized print-quality images they often provide. You can use a service like TinyJPG to quickly remove unnecessary data from images before uploading them. Many web platforms will attempt to automatically optimize images on upload, but since they don't know the dimensions those images will be displayed at on the user's device, providing smaller images to start with can yield significant gains.
Be extra careful with videos
Give extra consideration when using videos. Videos are some of the largest—and therefore slowest—content for a website to download and display, so try not to overuse them. Avoid using them at the top of web pages, and save them for further down the page. This can then allow less expensive content to load quickly to give a better loading experience to users and ensure your LCP is not impacted.
A/B tests
Many businesses perform A/B tests to experiment with changes to their website. How these are implemented can have a major impact on LCP.
Many A/B testing solutions delay when a website is first displayed to the user until the changes in any tests have been applied. This avoids showing the original version of the website, but at the cost of delaying the visibility of a website to the user. Other solutions are applied server-side to avoid this delay. Take time to understand how your A/B testing is performed, and if it is subject to these delays. Additionally, consider server-side A/B testing solutions instead where possible.
A/B testing can provide invaluable feedback before launching new changes, but the cost to page performance must be weighed up against any potential benefits they bring.
Regardless of your infrastructure, anyone running A/B tests should always keep the following best practices in mind:
- Limit A/B testing tools to only those pages that are part of the test rather than delaying all pages, when most pages may not be running an A/B test at any particular time.
- Limit A/B testing to a subset of users to avoid impacting the majority of users.
- Limit A/B tests to the minimum amount of time necessary to provide conclusive results. The longer A/B tests run, the longer users may be experiencing poor page performance.
- Most importantly of all, don't forget to remove your A/B testing experiments when they are no longer needed.
Cumulative Layout Shift (CLS) issues
CLS measures the visual stability of a page—how much the page's content shifts around as content is loaded. This can be distracting if a user has started reading a web page, but then loses their place as more content or ads slot into place. It can also result in users unintentionally clicking on the wrong content if the page's layout shifts excessively. Be very careful with dynamic content that loads later, and can move some of the initial page content.
This is measured with a mathematical formula that calculates how much content is shifted, and how much it is shifted by. It is expressed as a unitless fraction with a value of 0.1 or less being seen as good and a value of 0.25 or higher as poor.
Some of the common issues affecting CLS that business decision makers can influence are given in the next sections.
Check how your images load as your scroll a page
Many templates avoid loading images further down the page to give more resources to images which are onscreen during the initial page load. The images are then loaded as the user scrolls down. This image loading technique is known as lazy loading.
Page templates should reserve space for lazy loaded images so that, if a user scrolls very fast before the image gets a chance to load, the content around it does not shift around. If your template or platform does not do this, consider switching to one that does.
Be careful with ads placed in the middle of content
Ads inserted in the middle of content run the risk of pushing your content down, as ads often take a bit longer to load—often longer than the images described in the previous section. Having these on the side of the main page content is a common pattern which reduces this risk. How this is achieved in practice depends on your particular platform, and what templates you use to build your site.
Avoid adding dynamic content to the top of pages
Avoid adding alerts and banners to the top of the page after page load—for example, cookie banners or special offers. Choosing instead to overlay alerts and banners above the main content will prevent page content from shifting. Similar to the previous section, your options here will depend on the platform and templates used for your pages.
Interaction to Next Paint (INP) issues
INP measures the responsiveness of a page, which assesses whether pages quickly respond to interactions such as clicks, taps, and keyboard inputs. Pages that don't respond quickly to user input often feel sluggish, and can be frustrating for users.
INP measures the entirety of each and every qualifying interaction during the life of a page, and reports the worst interaction. INP has a good threshold of 200 milliseconds, and a poor threshold of 500 milliseconds.
Responsiveness metrics—and in particular INP—are tricky metrics to optimize. When these metrics are in the poor threshold, it is usually because interactions are delayed by the web page trying to do too much, so the main solutions here involve removing unnecessary code to make lighter pages.
Some of the common issues affecting INP that business decision makers can influence are given in the next sections.
Have a spring clean!
Review plugins and widgets added to your site, and remove them if they are no longer used. It's often easier to add plugins to try something out, than it is to remember to remove them later if you don't find them useful. This is one cause behind slow interactions, but it's a relatively simpler optimization than many others.
Similarly, if you're using a tag manager for marketing campaigns, then make sure old campaigns are removed. Even if they don't fire anymore, the code from expired marketing campaigns still need to be downloaded and compiled on each page, which can slow down user interactions during the initial page load.
Avoid expensive widgets and plugins
Computationally expensive widgets and plugins may look nice, but do they improve the user experience, or actually make it worse? The Diagnose Performance Issues report in PageSpeed Insights is provided by Lighthouse can help identify JavaScript that is having a noticeable impact on your website's performance.
Ideally, limit widgets only to the pages they are needed on—if you're only using a Google Map embed on the contact us page, then there's no need to load it on every page where it can cause responsiveness issues.
Consider number of ads—especially on mobile
Ads are a good monetization strategy for many businesses, but they are often complex and resource intensive. The more ads you have, the more resource intensive they are which can interfere with page speed. This is especially true on mobile devices, where processing power memory is often not as great as it is on desktop or laptop devices.
Weigh the balance between monetization and performance. If users are dropping off earlier due to a poor experience, then those extra ads may be costing you more revenue than they are adding.
Avoid excessive page size
Large, complex pages require more processing time to display. For example, if you have a product gallery with 1,000 different products, then it is going to take a while to display in the user's browser window. Consider when to paginate pages to reduce this time.
How can I get more help?
This post lists some of the general considerations business owners can take which may affect performance. Beyond this you may need to consult web developers to gain more insights on what you can do to improve your website's performance.
Platform-specific information
Most platforms care deeply about their web performance, and may have dedicated, platform-specific advice on how to improve this. You may also have access to dedicated web performance teams as part of using that platform who can advise further on how to improve your site.
Lighthouse also surfaces platform-specific information using the Stack Pack functionality, which can guide users of supported platforms to the appropriate advice.
Platforms continually improve over time and many are concentrating on performance and Core Web Vitals right now. Make sure your platform is kept up to date to benefit from the latest improvements the platform developers have made.
This is easiest when you are on a hosted platform where the platform provider automatically manages the platform, including platform updates. If you are hosting the platform yourself—for example, a local WordPress install on your own server—then ensuring the platform is routinely updated will allow your site to benefit from any improvements the platform developers have implemented. Businesses should prioritize this upkeep, or choose a service that manages this for them.
Engage a web developer
A web developer with expertise in web performance will likely be able to address many more issues than a business owner. You may have already engaged a web developer to build your site initially, or for periodic changes, or you may have a dedicated development team, or you may have to find a developer to engage (ideally one with web performance expertise).
Turn to developers if the suggestions provided here are not providing enough to address the performance issues you're having with your website, but hopefully the prior examples also show that it is important to work with developers to balance business priorities with development decisions to reach the right solution for your website.
Be aware that web performance is rarely a one-off piece of work. Maintaining good website performance often requires regular monitoring and maintenance to ensure your website does not regress after improvements have been made.
Conclusion
A website is often the first entry point for a business with its customers, and you want it to be a great experience for them. This applies both to first time visitors getting their first impression of your business, but also repeat visitors and loyal customers, who should be given as seamless an experience as possible, ideally free of frustrations that may leave a negative impression. The Core Web Vitals are one measure of user experience that Google recommends that sites consider. With all that the web offers, users can (and will!) try other websites if they get frustrated with yours.
At the same time, the Core Web Vitals are just one measure of your website. Businesses need to decide themselves about how much to invest in their websites, and what return will be realized for that investment.
Acknowledgements
Thumbnail image by Carlos Muza on Unsplash