
预测性(或分析性)AI 是一组算法,可帮助您了解现有数据并预测接下来可能会发生的情况。预测性 AI 模型会根据历史模式学习不同的分析任务,帮助用户了解数据:
- 分类:根据数据中的模式将项目分组到预定义的类别中。例如,在线商店可能会按意图(研究、购买、退货)对访问者进行分类,以便相应地调整其推荐。
- 回归:预测数值,例如互动率、会话时长或转化概率。
- 推荐:建议与特定用户或情境最相关的商品。例如,“与您类似的用户还查看了”或“根据您的进度推荐的教程”。
- 预测和异常值检测:模型可预测未来事件(例如流量高峰),或识别异常行为(例如付款异常或欺诈)。
有些产品完全基于预测性 AI 构建,例如音乐发现工具。在其他情况下,预测性 AI 可增强确定性体验,例如提供个性化推荐的流媒体网站。预测性 AI 还可以成为强大的内部赋能工具:您可以使用它来分析产品和用户数据,从而发掘数据洞见并指导您采取更明智的后续行动。
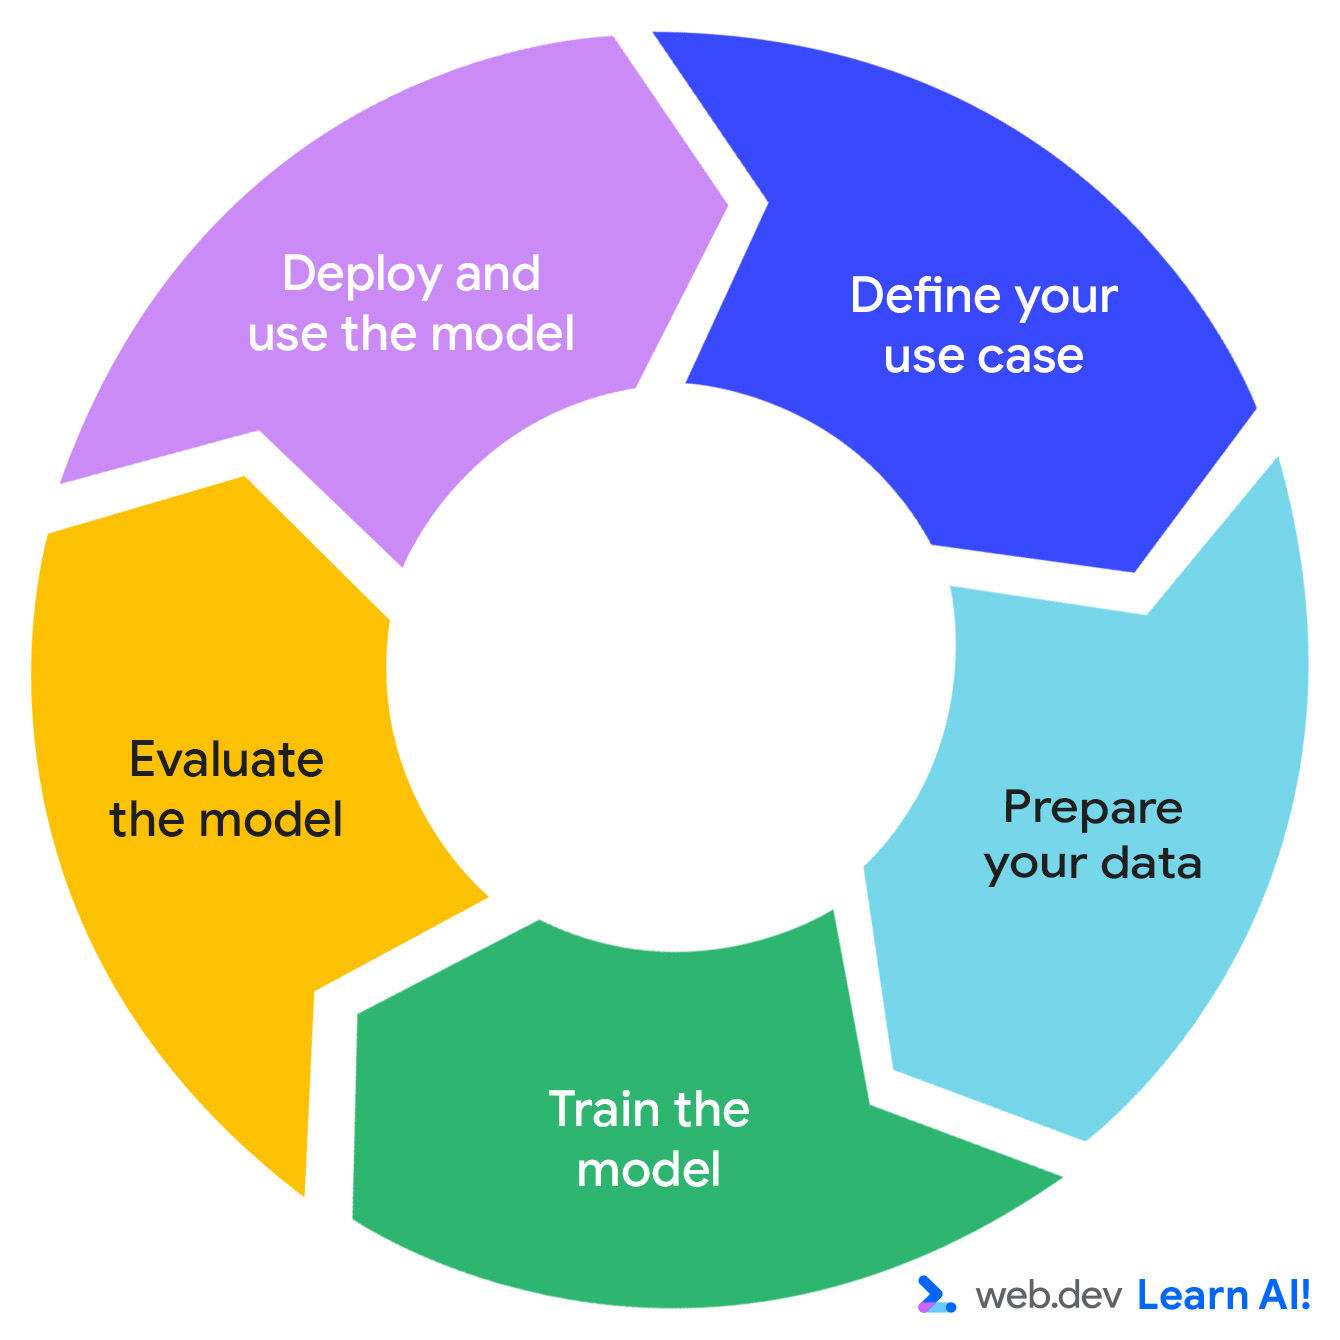
预测性 AI 循环
预测性 AI 系统的开发遵循迭代周期:确定机会、准备数据、训练模型、评估模型和部署模型。
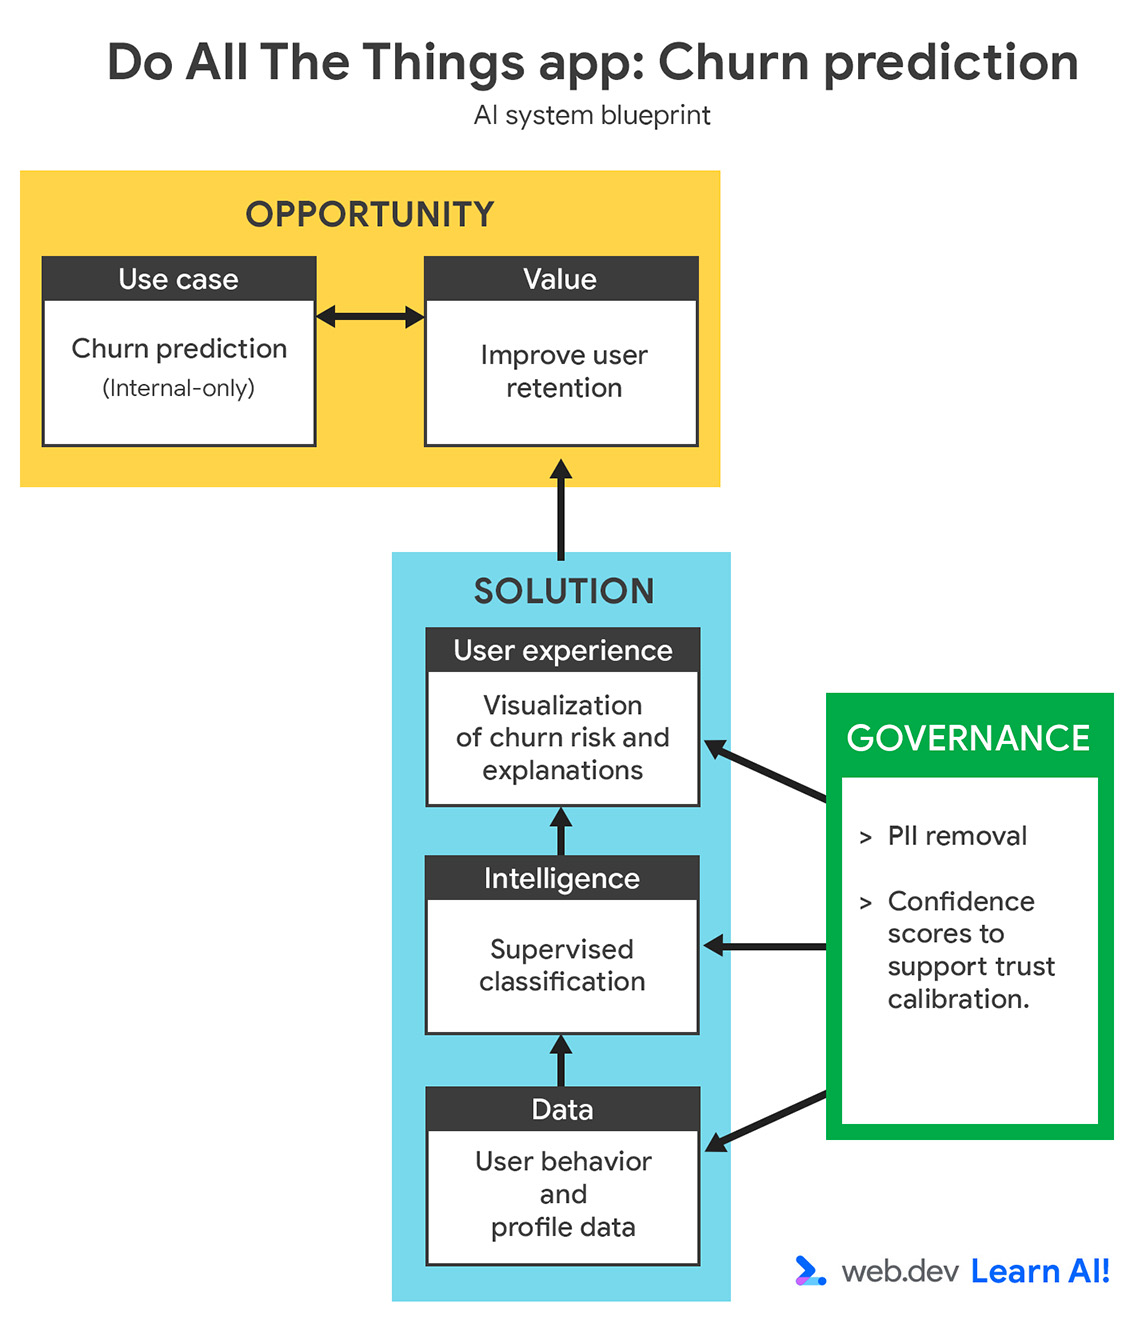
假设您正在开发一款基于订阅的效率应用 Do All The Things。您已经收集了使用情况数据,例如网页浏览量、会话时长、功能使用情况和订阅续订情况。现在,您希望从数据中发掘更多可据以采取行动的价值。下面介绍了如何通过预测性 AI 循环进行旅行。
定义您的使用场景

您的用户流失率在过去三个月内有所上升。您不希望在用户取消订阅后才采取行动,而是希望在用户取消订阅之前,使用预测性 AI 来识别可能流失的用户。该目标是为客户成功团队提供早期信号,以便他们采取有针对性的主动措施来留住有流失风险的用户。
在定义预测性 AI 应用场景时,首先要验证该问题是否可以通过数据回答。这可以是您已收集的数据,也可以是您在未来可以实际收集的数据。此步骤通常需要与领域专家(例如客户成功团队、增长团队或营销团队)协作,以确保预测既有意义又可据此采取行动。
明确的问题定义应指定:
- 目标:您希望影响哪些业务成果?例如,您希望通过启用主动式联络来减少客户流失。
- 输入数据:模型从哪些历史信号中学习?例如,您提供使用模式、方案类型和支持互动。
- 输出:模型将生成什么内容?例如,您希望模型为每位用户生成流失概率得分。
- 用户:谁会使用预测结果或根据预测结果采取行动?例如,此数据适用于客户成功经理。
- 成功标准:您如何衡量影响?例如,您可以衡量用户留存率,以确定是否减少了客户流失。
通过在开始时确定这些细节,您可以避免一个常见的陷阱:构建一个技术上可靠但从未被使用的自定义模型。
准备数据
为了向模型提供有用的学习信号,您需要使用理想的预测结果来标记历史数据。将完成所有操作的用户标记为“已流失”或“未流失”。
接下来,与客户成功团队协作,确定哪些行为特征与客户流失预测最相关。将数据集缩小到这些关键特征,并移除不必要的字段,这样模型就不需要处理噪声。请务必考虑数据隐私权。移除个人身份信息 (PII),例如姓名或电子邮件地址,并仅存储汇总的行为数据。
下表显示了生成的数据集中的部分数据:
user_id |
plan_type |
avg_session_time (min) |
logins_last_30d |
features_used |
support_tickets |
churned |
| 00123 | 高级 | 12.4 | 22 | 5 | 0 | 0 |
| 00124 | 试用 | 5.8 | 3 | 1 | 2 | 1 |
| 00125 | 免费 | 18.1 | 30 | 7 | 0 | 0 |
| 00126 | 高级 | 9.7 | 12 | 4 | 1 | 0 |
| 00127 | 试用 | 4.2 | 2 | 1 | 3 | 1 |
这样一来,您的模型便可获得干净的数值和分类输入(例如 plan_type 或 avg_session_time)以及明确的目标标签 (churned)。类别应转换为唯一的数字标识符。
最后,将数据集拆分为三个子集:
- 训练集(通常占 70% 到 80% 左右),用于训练模型;
- 用于调整超参数和防止过拟合的验证集(有时也称为开发集)。
- 测试集,用于评估模型在完全未见过的数据上的表现。
这有助于模型做出泛化决策,而不是依赖记忆的历史示例。
训练模型
与通常基于大型预训练模型构建的生成式 AI 不同,大多数预测性 AI 系统依赖于自训练模型。这是因为预测性任务与您的产品和用户高度相关。借助 scikit-learn (Python)、AutoML(无代码或低代码)或 TensorFlow.js (JavaScript) 等工具,您可以更轻松地训练和评估预测模型,而无需担心底层数学知识。
在流失示例中,我们将清理后的训练集馈送到监督式分类算法(例如逻辑回归或神经网络)中。 您可以尝试多种选项,确定哪种最适合您的数据。
模型会学习哪些行为模式与客户流失相关。最后,它可以为每位用户分配一个概率得分。例如,用户 X 下个月取消订阅的风险为 72%。
在每次训练迭代后,使用验证集评估生成的模型。调整超参数可以提高模型性能,但对数据集进行有针对性的改进也能达到同样的效果。
评估模型
数据集中的标签提供了可用于比较模型输出的标准答案。需要跟踪的关键指标包括:
- 精确率:在所有标记为“流失”的用户中,实际流失的用户所占的比例是多少?
- 召回率:在所有流失的用户中,模型捕获了多少?
- F1 得分:一个平衡精确率和召回率的单一数值,当您希望获得一个总体准确度指标,而又不想为了过度优化其中一个指标而牺牲另一个指标时,该指标非常有用。
如果误报过多,就会浪费客户留存方面的精力;如果误报过少,就会失去客户。合适的权衡取决于您的业务优先事项。例如,如果这样能更有效地在更多用户流失之前挽留他们,您的公司可能更愿意处理几个误报。
部署和维护模型
验证完成后,您可以使用 API 或作为集成到分析信息中心的轻量级客户端服务来部署模型。该模型每天都会对用户进行评分,并更新流失风险可视化图表,以便您的团队确定优先联系对象。为了确保其准确性和可靠性,请采纳机器学习运维团队 (MLOps) 的以下经验:
- 监控数据漂移:检测用户行为何时发生变化,以及训练数据何时不再代表现实情况。
- 例如,在推出重大界面重新设计后,用户与功能互动的方式会发生变化,导致流失预测的准确性降低。
- 从错误中学习:找出错误预测背后的常见模式,并添加有针对性的示例,以改进下一个训练周期。
- 例如,该模型经常将高级用户标记为客户流失风险,因为他们会提交许多支持服务工单。审核结束后,您添加了新功能,以区分问题排查和用户流失。
- 定期重新训练:即使效果看起来很稳定,也要定期刷新模型,以应对季节性变化、产品更新或价格变动。
- 例如,在推出包年套餐后,您需要重新训练模型,因为价格结构的变化会影响用户在续订前的行为。
此生命周期是预测式 AI 的支柱。借助 MLflow 和 Weights & Biases 等工具,您无需深入的机器学习专业知识即可运行此流程。
常见误区和缓解措施
虽然偶尔会发生错误,但您可以防范可能损害效果和用户信任的常见根本原因:
- 低质量数据:如果您的输入数据包含噪声或不完整,那么预测结果也会如此。为缓解此问题,请在训练之前直观呈现并验证数据。确保您拥有所需的学习信号并处理缺失值。监控生产环境中的数据质量。
过拟合:模型在训练数据上表现非常出色,但在新数据上表现不佳。为了缓解过拟合问题,请使用交叉验证、正则化和留出数据。这有助于模型在训练示例之外进行泛化。
数据漂移:用户行为和环境会发生变化,但模型不会。为了缓解这种情况,请安排重新训练,并添加监控功能以检测准确率何时开始下降。
不良指标:总体准确率并不总是能反映用户的优先事项。例如,有时,特定错误的“成本”更为重要。在欺诈检测中,漏检欺诈案例(假负例)的危害远大于将无辜案例标记为欺诈案例(假正例)。为缓解此问题,请使指标与欺诈检测的实际目标保持一致。
这些问题大多不是致命的。逐步启动系统,并在出现问题时及时解决。
这种精简灵活的方法的关键在于可观测性。对模型进行版本控制,记录用于构建模型的准确率特征和工具,跟踪随时间变化的性能,并保持监控处于有效状态。 当出现漂移或中断时,您可以在用户注意到之前发现并修复问题。
要点总结
预测性 AI 可将现有数据转化为洞察,揭示接下来可能会发生的情况以及应采取的行动。它是最具体、最可衡量的 AI 形式。专注于可以用数据表达的明确定义的问题,随着产品的发展不断迭代,并随着时间的推移监控效果。
在下一个模块中,您将了解生成式 AI,它可以帮助您根据现有数据创建新内容。
资源
如果您有兴趣了解预测性 AI 背后的数学原理,建议您参阅以下资源:
- 有关分类、线性回归和逻辑回归的机器学习速成课程。
- 本课程的作者 Janna Lipenkova 在《AI 产品开发艺术:实现业务价值》一书的第 4 章中详细介绍了预测性 AI 的主题。
- Stuart Jonathan Russell 和 Peter Norvig 合著的《人工智能:一种现代方法》。这本书最初于 1995 年出版,最新版本于 2021 年出版。它通常在 AI 工程计划中讲授。
- 模式识别和机器学习(作者:Christopher M. Bishop 的著作,以深入而学术的方式学习预测性 AI。
检验您的掌握情况
预测性 AI 的主要功能是什么?
哪项任务涉及根据模式将项目分组到预定义的类别中?
在“预测性 AI 循环”中,为什么要将数据集拆分为训练集、验证集和测试集?
哪项指标可平衡精确率和召回率,从而提供整体准确度衡量指标?
什么是数据漂移?您应该如何缓解数据漂移?