
Learn why tools that monitor Core Web Vitals metrics may report different numbers, and how to interpret those differences.

Google provides a number of tools to help site owners monitor their Core Web Vitals scores. These tools fall into two main categories:
- Tools that report lab data—data collected in a controlled environment with predefined device and network settings.
- Tools that report field data—data collected from the real users visiting your site.
The problem is that sometimes the data reported by lab tools can be quite a bit different from the data reported by field tools! Your lab data might indicate that your site performs great, but your field data suggests it needs improvement. Alternatively, your field data may say all your pages are good, but your lab data may report a very low score.
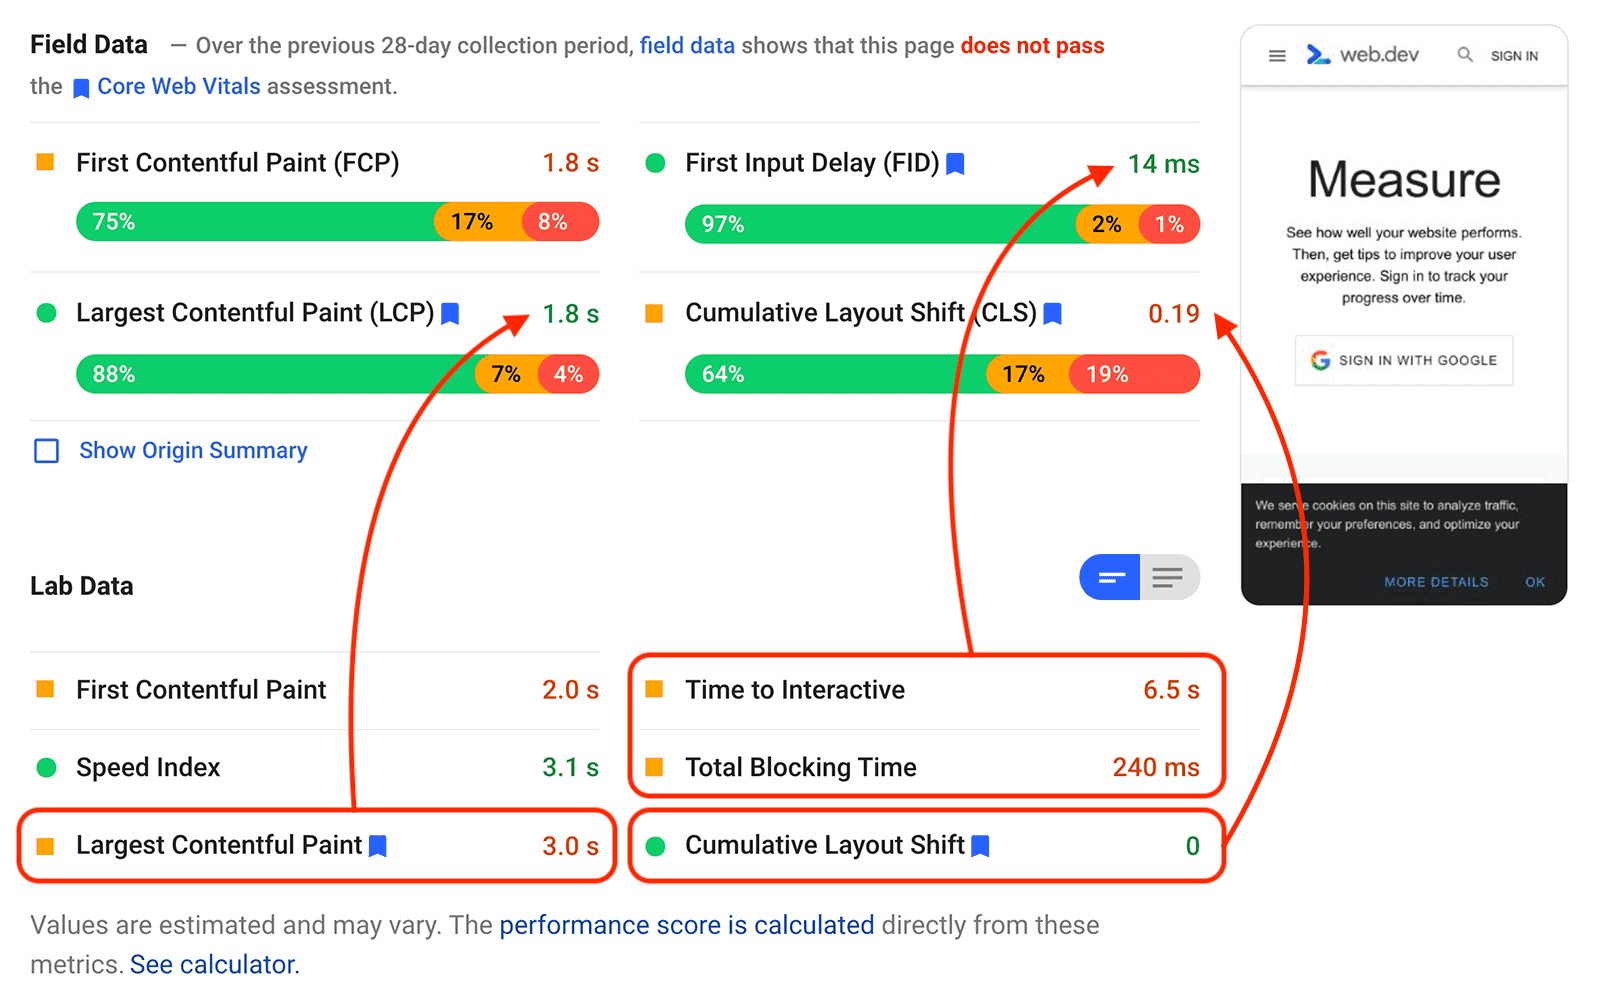
The following real example of a PageSpeed Insights report from web.dev shows that in some cases lab and field data can be different across all of the Core Web Vitals metrics:
Differences between tools is an understandable source of confusion for developers. This post explains the main reasons these differences could exist—with specific examples covering each of the Core Web Vitals metrics—and what to do when you find differences on your pages.
Lab data versus field data
To understand why lab and field tools might report different values—even for the exact same web page—you need to understand the difference between lab and field data.
Lab data
Lab data is determined by loading a web page in a controlled environment with a predefined set of network and device conditions. These conditions are known as a lab environment, sometimes also referred to as a synthetic environment.
Chrome tools that report lab data are generally running Lighthouse.
The purpose of a lab test is to control for as many factors as you can, so the results are (as much as possible) consistent and reproducible from run to run.
Field data
Field data is determined by monitoring all users who visit a page and measuring a given set of performance metrics for each one of those users' individual experiences. Because field data is based on real-user visits, it reflects the actual devices, network conditions, and geographic locations of your users.
Field data is also commonly known as Real User Monitoring (RUM) data; the two terms are interchangeable.
Chrome tools that report field data generally get that data from the Chrome User Experience Report (CrUX). It's also common (and recommended) for site owners to collect field data themselves because it can provide more actionable insights than just using CrUX alone.
The most important thing to understand about field data is that it is not just one number, it's a distribution of numbers. That is, for some people who visit your site, it may load very quickly, while for others it may load very slowly. The field data for your site is the complete set of all performance data collected from your users.
As an example, CrUX reports show a distribution of performance metrics from real Chrome users over a 28-day period. If you look at almost any CrUX report you can see that some users who visit a site might have a very good experience while others might have a very poor experience.
If a tool does report a single number for a given metric, it will generally represent a specific point in the distribution. Tools that report Core Web Vitals field scores do so using the 75th percentile.
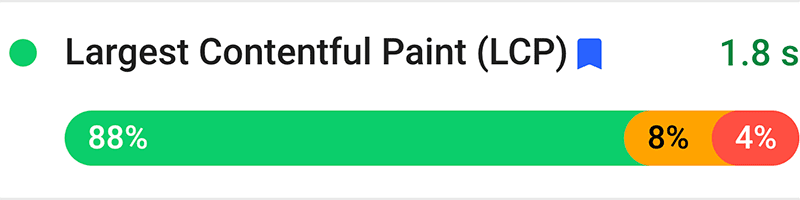
Looking at LCP from the field data in the screenshot above, you can see a distribution where:
- 88% of visits saw an LCP of 2.5 seconds or less (good).
- 8% of visits saw an LCP between 2.5 and 4 seconds (needs improvement).
- 4% of visits saw an LCP greater than 4 seconds (poor).
At the 75th percentile, LCP was 1.8 seconds:
Lab data from the same page shows an LCP value of 3.0 second. While this value is greater than the 1.8 seconds shown in the field data, it's still a valid LCP value for this page—it's one of many values that make up the full distribution of load experiences.

Why lab and field data are different
As the above section explains, lab data and field data actually measure very different things.
Field data includes a wide variety of network and device conditions as well as a myriad of different types of user behavior. It also includes any other factors that affect the user experience, such as browser optimizations like the back/forward cache (bfcache), or platform optimizations like the AMP cache.
By contrast, lab data intentionally limits the number of variables involved. A lab test consists of:
- A single device…
- connected to a single network…
- run from a single geographic location.
The particulars of any given lab test may or may not accurately represent the 75th percentile of field data for a given page or site.
The controlled environment of the lab is useful when debugging issues or testing features before deploying to production, but when you control for these factors you are explicitly not representing the variance that you see in the real world across all types of networks, device capabilities, or geographic locations. You are also generally not capturing the performance impact of real-user behavior, such as scrolling, selecting text, or tapping elements on the page.
In addition to the possible disconnect between lab conditions and the conditions of most real-world users, there are also a number of more subtle differences that are important to understand in order to make the most sense out of your lab and field data, as well as any differences you may find.
The next few sections go into detail highlighting the most common reasons there could be differences between lab data and field data for each of the Core Web Vitals metrics:
LCP
Different LCP elements
The LCP element identified in a lab test may not be the same LCP element users see when visiting your page.
If you run a Lighthouse report for a given page, it's going to return the same LCP element every single time. But if you look at field data for the same page, you'll usually find a variety of different LCP elements, which depend on a number of circumstances specific to each page visit.
For example, the following factors could all contribute to a different LCP element being determined for the same page:
- Different device screen sizes result in different elements being visible within the viewport.
- If the user is logged in, or if personalized content is being shown in some way, the LCP element could be very different from user to user.
- Similar to the previous point, if an A/B test is running on the page it could result in very different elements being displayed.
- The set of fonts installed on the user's system can affect the size of text on the page (and thus which element is the LCP element).
- Lab tests are usually run on a page's "base" URL—without any query parameters or hash fragments added. But in the real world, users often share URLs containing a fragment identifier or text fragment, so the LCP element may actually be from the middle or bottom of the page (rather than "above the fold").
Since LCP in the field is calculated as the 75th percentile of all user visits to a page, if a large percentage of those users had an LCP element that loaded very quickly—for example a paragraph of text rendered with a system font—then even if some of those users had a large, slow-loading image as their LCP element, it might not affect that page's score if that happens to less than 25% of visitors.
Alternatively, the opposite could be true. A lab test might identify a block of text as the LCP element because it's emulating a Moto G4 phone which has a relatively small viewport and your page's hero image is initially rendered off-screen. Your field data, though, may include mostly Pixel XL users with larger screens, so for them the slow-loading hero image is their LCP element.
Effects of cache state on LCP
Lab tests typically load a page with a cold cache, but when real users visit that page they may already have some of its resources cached.
The first time a user loads a page it may load slowly, but if the page has proper caching configured, the next time that user returns the page might load right away.
While some lab tools do support multiple runs of the same page (to simulate the experience for returning visitors), it's not possible for a lab tool to know what percentage of real-world visits occur from new versus returning users.
Sites with well-optimized cache configurations and lots of repeat visitors may discover that their real-world LCP is much faster than their lab data indicates.
AMP or Signed Exchange optimizations
Sites built with AMP or that use Signed Exchanges (SXG) can be preloaded by content aggregators like Google Search. This can result in significantly better load performance for users visiting your pages from those platforms.
In addition to cross-origin preloading, sites themselves can preload content for subsequent pages on their site, which could improve LCP for those pages as well.
Lab tools do not simulate the gains seen from these optimizations, and even if they did, they could not know what percentage of your traffic comes from platforms like Google Search compared to other sources.
Effects of bfcache on LCP
When pages are restored from the bfcache, the load experience is near instantaneous, and these experiences are included in your field data.
Lab tests do not consider bfcache, so if your pages are bfcache-friendly, it will likely result in faster LCP scores reported in the field.
Effects of user interaction on LCP
LCP identifies the render time of the largest image or text block in the viewport, but that largest element can change as the page is loaded or if new content gets dynamically added to the viewport.
In the lab, the browser will wait until the page is fully loaded before determining what the LCP element was. But in the field, the browser will stop monitoring for larger elements after the user scrolls or interacts with the page.
This makes sense (and is necessary) because users typically will wait to interact with a page until it "appears" loaded, which is exactly what the LCP metric aims to detect. It also wouldn't make sense to consider elements added to the viewport after a user interacts because those elements might have only been loaded because of something the user did.
The implication of this, though, is that field data for a page may report faster LCP times, depending on how users behave on that page.
INP
INP requires real-user interaction
The INP metric measures how responsive a page is to user interactions, at the time when users actually chose to interact with it.
The second part of that sentence is critical because lab tests, even those that support script user behavior, cannot accurately predict when users will choose to interact with a page, and thus cannot accurately measure FID.
TBT does not consider user behavior
The Total Blocking Time (TBT) lab metric is intended to help diagnose issues with INP because it quantifies how much the main thread is blocked during page load.
The idea is that pages with lots of synchronous JavaScript or other intensive rendering tasks are more likely to have a blocked main thread when the user first interacts. However, if users wait to interact with the page until after the JavaScript finishes executing, INP may be very low.
When users will choose to interact with a page depends largely on whether or not it looks interactive, and this cannot be measured with TBT.
TBT does not consider tap delay
If a site is not optimized for mobile viewing, browsers will add a 300 ms delay after any tap before running event handlers. They do this because they need to determine whether the user is trying to double-tap to zoom before they can fire mouse or click events.
This delay counts toward a page's INP because it contributes to the real input latency that users experience. But since this delay is not technically a Long Task, it doesn't affect a page's TBT. This means a page may have poor INP despite having very good TBT scores.
Effects of cache state and bfcache on INP
In the same way that proper caching can improve LCP in the field, it can also improve INP.
In the real world, a user might have the JavaScript for a site already in their cache, so processing it could take less time and result in smaller delays.
The same is also true for pages restored from bfcache. In those cases the JavaScript is restored from memory, so there could be little or no processing time at all.
CLS
Effects of user interaction on CLS
CLS measured in the lab only considers layout shifts that occur above the fold and during load, but this is only a subset of what CLS actually measures.
In the field, CLS considers all unexpected layout shifts that occur throughout the lifespan of the page, including content that shifts as the user scrolls or in response to slow network requests after user interaction.
For example, it's quite common for pages to lazy-load images or iframes without dimensions, and that can cause layout shifts when a user scrolls to those sections of the page. But those shifts may only happen if the user scrolls down, which often won't be caught in a lab test.
Personalized content
Personalized content—including targeted ads and A/B tests—affects what elements are loaded on a page. It also affects how they are loaded since personalized content is often loaded later and inserted into a page's main content, causing layout shifts.
In the lab, a page is usually loaded either without personalized content, or with content for a generic "test user", which may or may not trigger the shifts real users are seeing.
Since field data includes the experiences of all users, the amount (and degree) of layout shifts experienced on any given page is very dependent on what content is loaded.
Effects of cache state and bfcache on CLS
Two of the most common causes of layout shifts during load are images and iframes without dimensions (as mentioned above) and slow loading web fonts, and both of these issues are more likely to affect the experience the first time a user visits a site, when their cache is empty.
If a page's resources are cached, or if the page itself is restored from bfcache, the browser can usually render images and fonts right away, without waiting for them to download. This can result in lower CLS values in the field than what a lab tool may report.
What to do when the results are different
As a general rule, if you have both field data and lab data for a given page, field data is what you should use to prioritize your efforts. Since field data represents what real users are experiencing, it's the most accurate way to really understand what your users are struggling with and what needs to be improved.
On the flip side, if your field data shows good scores across the board, but your lab data suggests there's still room for improvement, it's worth understanding what further optimizations can be made.
In addition, while field data does capture real-user experiences, it only does so for users who are successfully able to load your site. Lab data can sometimes help identify opportunities to expand your site's reach and make it more accessible to users with slower networks or lower-end devices.
Overall, both lab data and field data are important parts of effective performance measurement. They both have their strengths and limitations, and if you're only using one you may be missing an opportunity to improve the experience for your users.