
A step-by-step guide on how to break down LCP and identify key areas to improve.


Published: April 30, 2020, Last updated: March 31, 2025
Largest Contentful Paint (LCP) is one of the three Core Web Vitals metrics, and it represents how quickly the main content of a web page is loaded. Specifically, LCP measures the time from when the user initiates loading the page until the largest image or text block is rendered within the viewport.
To provide a good user experience, sites should strive to have an LCP of 2.5 seconds or less for at least 75% of page visits.

A number of factors can affect how quickly the browser can load and render a web page, and delays across any of them can have a significant impact on LCP.
It's rare that a quick fix to a single part of a page will result in a meaningful improvement to LCP. To improve LCP, you have to look at the entire loading process and make sure every step along the way is optimized.
Understanding your LCP metric
Before optimizing LCP, developers should seek to understand if they even have an LCP issue, and the extent of any such issue.
LCP can be measured in a number of tools and not all of these measure LCP in the same way. To understand LCP of real users, we should look at what real users are experiencing, rather than what a lab-based tool like Lighthouse or local testing shows. These lab-based tools can give a wealth of information to explain and help you improve LCP, but be aware that lab tests alone may not be entirely representative of what your actual users experience.
LCP data based on real users can be surfaced from Real User Monitoring (RUM) tools installed on a site, or by using the Chrome User Experience Report (CrUX) which collect anonymous data from real Chrome users for millions of websites.
Using Chrome DevTools CrUX LCP data
The Performance panel of Chrome DevTools shows your local LCP experience next to the page or origin's CrUX LCP in the live metrics view, and in the Insights of a performance trace including a breakdown of the LCP subpart timings (that we will explain shortly).
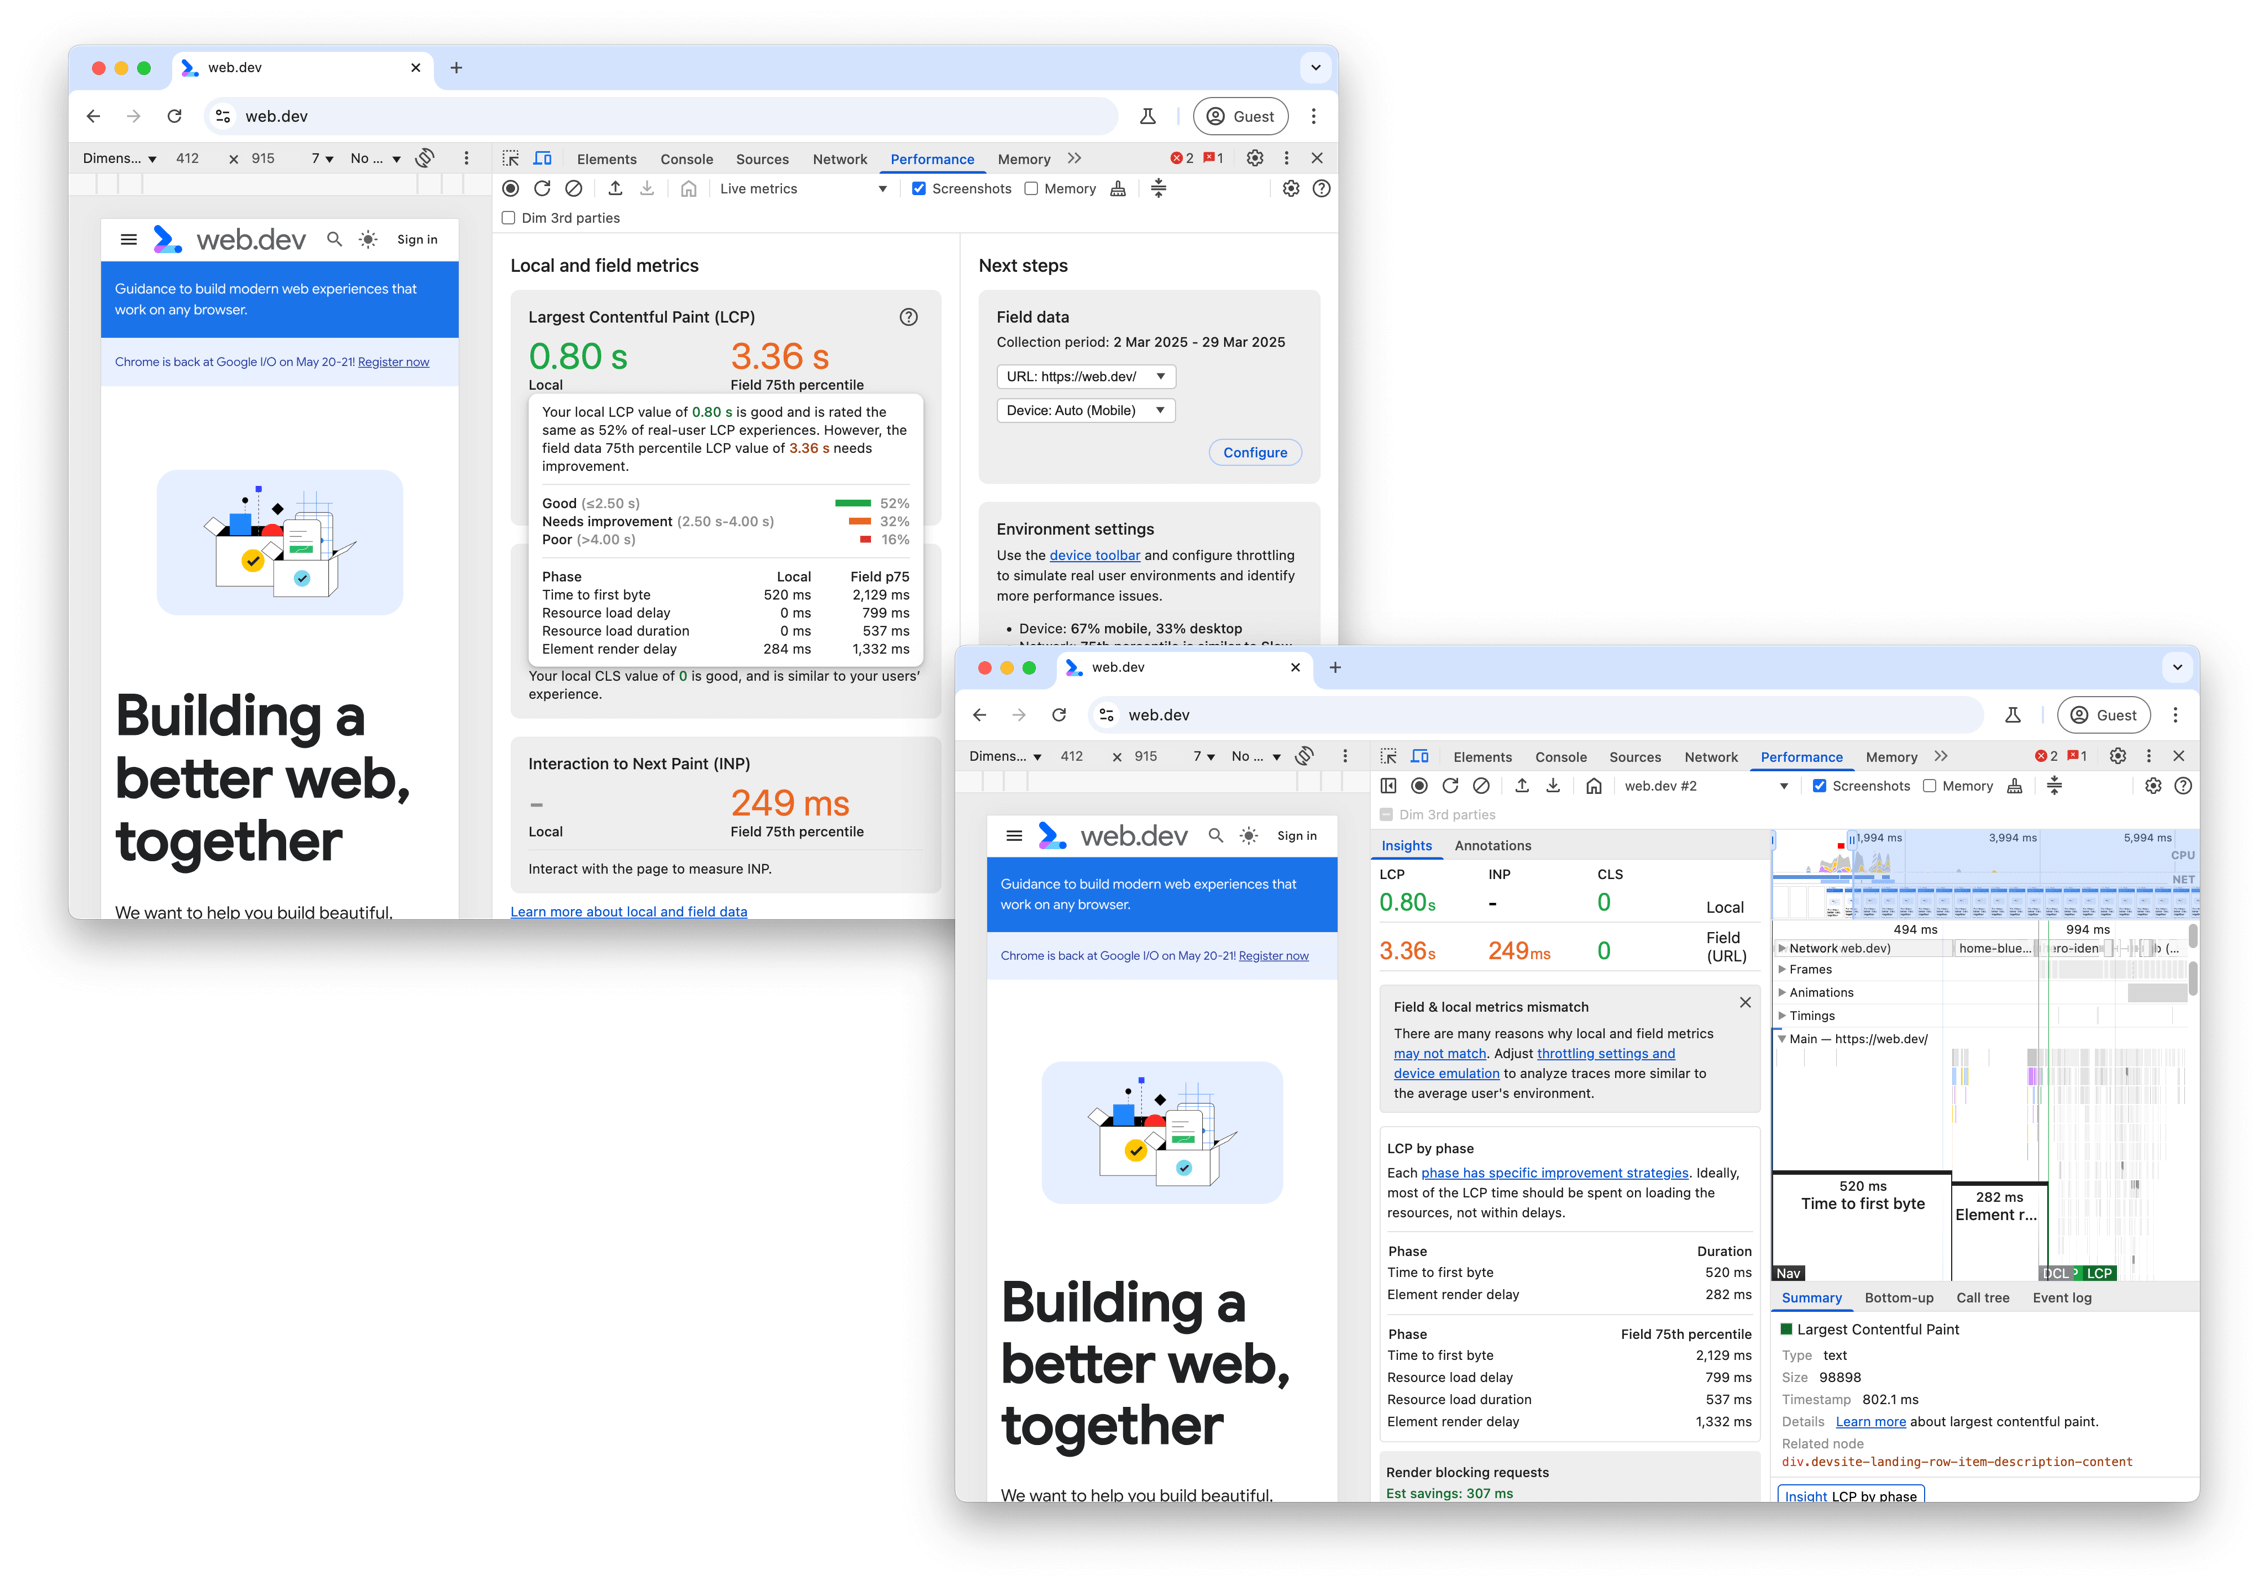
By layering field data onto the Performance panel, you can assess whether a page has any real-user LCP issues and adapt your local environment settings to better reproduce and debug those issues.
Using PageSpeed Insights CrUX LCP data
PageSpeed Insights provides access to CrUX data in the top section labeled Discover what your real users are experiencing. More detailed lab-based data is available in the bottom section labeled Diagnose performance issues. If CrUX data is available for your website, always concentrate on the real user data first.

PageSpeed Insights shows up to four different CrUX data:
- Mobile data for This URL
- Desktop data for This URL
- Mobile data for the whole Origin
- Desktop data for the whole Origin
You can toggle these in the controls at the top and top right-hand side of this section. If a URL doesn't have enough data to be shown at the URL level, but does have data for the origin, PageSpeed Insights always shows the origin data.

The LCP for the whole origin may be very different to an individual page's LCP depending on how the LCP is loaded on that page compared to other pages on that origin. It can also be affected by how visitors navigate to these pages. Home pages tend to be visted by new users and so may often be loaded "cold", without any cached content and so are often the slowest pages on a website.
Looking at the four different categories of CrUX data can help you understand whether an LCP issue is specific to this page, or a more general site-wide issue. Similarly, it can show which device types have LCP issues.
Using PageSpeed Insights CrUX supplementary metrics
Those looking to optimize LCP should also use the First Contentful Paint (FCP) and Time to First Byte (TTFB) timings, which are good diagnostic metrics that can provide valuable insights into LCP.
TTFB is the time when the visitor starting to navigate to a page (for example, clicking on a link), until the first bytes of the HTML document are received. A high TTFB can make achieving a 2.5 second LCP challenging, or even impossible.
A high TTFB can be due to multiple server redirects, visitors located far away from the nearest site server, visitors on poor network conditions, or an inability to use cached content due to query parameters.
Once a page starts rendering, there may be an initial paint (for example, the background color), followed by some content appearing (for example, the site header). The appearance of the initial content is measured by FCP. The delta between FCP and other metrics can be very telling.
A large delta between TTFB and FCP could indicate that the browser needs to download a lot of render-blocking assets. It can also be a sign it must complete a lot of work to render any meaningful content—a classic sign of a site that relies heavily on client-side rendering.
A large delta between FCP and LCP indicates that the LCP resource is either not immediately available for the browser to prioritize (for example, text or images that are managed by JavaScript rather than being available in the initial HTML), or that the browser is completing other work before it can display the LCP content.
Using PageSpeed Insights Lighthouse data
The Lighthouse section of PageSpeed Insights offers some guidance to improving LCP, but first you should check if the LCP given is broadly in agreement with real user data provided by CrUX. If Lighthouse and CrUX disagree, then CrUX likely provides a more accurate picture of your user experience. Make sure your CrUX data is for your page, not the full origin, before you act on it.
If both Lighthouse and CrUX show LCP values that need improvement, the Lighthouse section can provide valuable guidance on ways to improve LCP. Use the LCP filter to only show audits relevant to LCP as follows:

As well as the Opportunities to improve, there is Diagnostic information that may provide more information to help diagnose the issue. The Largest Contentful Paint element diagnostic shows a useful breakdown of the various timings that made up the LCP:

LCP resource types and subparts are also available in CrUX.
We will delve into these subparts next.
LCP breakdown
Optimizing for LCP can be a more complex task when PageSpeed Insights does not give you the answer on how to improve this metric. With complex tasks it's generally better to break them down into smaller, more manageable tasks and address each separately.
This section presents a methodology for how to break down LCP into its most critical subparts and then present specific recommendations and best practices for how to optimize each part.
Most page loads typically include a number of network requests, but for the purposes of identifying opportunities to improve LCP, you should start by looking at just two:
- The initial HTML document
- The LCP resource (if applicable)
While other requests on the page can affect LCP, these two requests—specifically the times when the LCP resource begins and ends—reveal whether or not your page is optimized for LCP.
To identify the LCP resource, you can use developer tools (such as PageSpeed Insights discussed before, Chrome DevTools, or WebPageTest) to determine the LCP element. From there you can match the URL (again, if applicable) loaded by the element on a network waterfall of all resources loaded by the page.
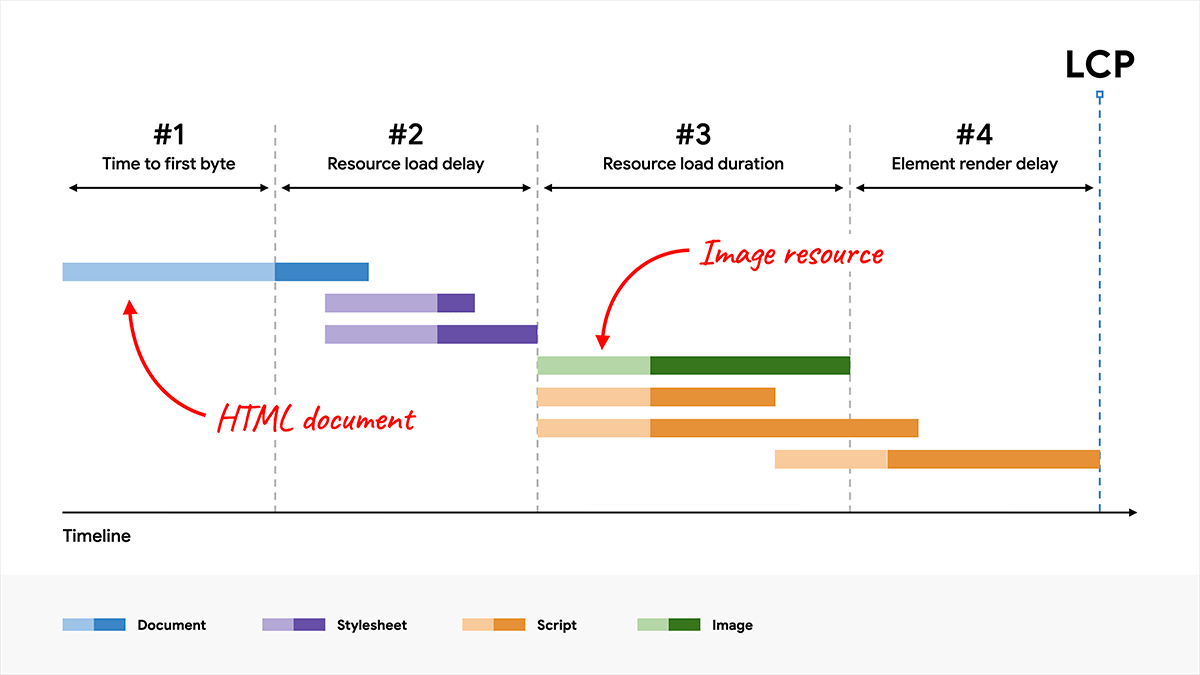
For example, the following visualization shows these resources highlighted on a network waterfall diagram from a typical page load, where the LCP element requires an image request to render.

For a well-optimized page, you want your LCP resource request to start loading as early as it can, and you want the LCP element to render as quickly as possible after the LCP resource finishes loading. To help visualize whether or not a particular page is following this principle, you can break down the total LCP time into the following subparts:
- Time to First Byte (TTFB)
- The time from when the user initiates loading the page until the browser receives the first byte of the HTML document response.
- Resource load delay
- The time between TTFB and when the browser starts loading the LCP resource. If the LCP element doesn't require a resource load to render (for example, if the element is a text node rendered with a system font), this time is 0.
- Resource load duration
- The duration of time it takes to load the LCP resource itself. If the LCP element doesn't require a resource load to render, this time is 0.
- Element render delay
- The time between when the LCP resource finishes loading and the LCP element rendering fully.
Every single page can have its LCP value broken down into these four subparts. There is no overlap or gap between them. Collectively, they add up to the full LCP time.
When optimizing LCP, it's helpful to try to optimize these subparts individually. But it's also important to keep in mind that you need to optimize all of them. In some cases, an optimization applied to one part won't improve LCP, it will just shift the time saved to another part.
For example, in the earlier network waterfall, if you reduced the file size of our image by compressing it more or switching to a more optimal format (such as AVIF or WebP), that would reduce the resource load duration, but it wouldn't actually improve LCP because the time would just shift to the element render delay subpart:

The reason this happens is because, on this page, the LCP element is hidden until the JavaScript code finishes loading, and then everything is revealed at once.
This example helps illustrate the point that you need to optimize all of these subparts in order to achieve the best LCP outcomes.
Optimal subpart times
In order to optimize each subpart of LCP, it's important to understand what the ideal breakdown of these subparts is on a well-optimized page.
Of the four subparts, two have the word "delay" in their names. That is a clue that you want to get these times as close to zero as possible. The other two parts involve network requests, which by their very nature take time.
Note that these time breakdowns are guidelines, not strict rules. If the LCP times on your pages are consistently within 2.5 seconds, then it doesn't really matter what the relative proportions are. But if you're spending a lot of unnecessary time in either of the "delay" portions, then it will be very difficult to constantly hit the 2.5 second target.
A good way to think about the breakdown of LCP time is:
- The vast majority of the LCP time should be spent loading the HTML document and LCP source.
- Any time before LCP where one of these two resources is not loading is an opportunity to improve.
How to optimize each part
Now that you understand how each of the LCP subpart times should break down on a well-optimized page, you can start optimizing your own pages.
The next four sections will present recommendations and best practices for how to optimize each part. They're presented in order, starting with the optimizations that are likely to have the biggest impact.
1. Eliminate resource load delay
The goal in this step is to ensure the LCP resource starts loading as early as possible. While in theory the earliest a resource could start loading is immediately after TTFB, in practice there is always some delay before browsers actually start loading resources.
A good rule of thumb is that your LCP resource should start loading at the same time as the first resource loaded by that page. Or, to put that another way, if the LCP resource starts loading later than the first resource, then there's opportunity for improvement.

Generally speaking, there are two factors that affect how quickly an LCP resource can be loading:
- When the resource is discovered.
- What priority the resource is given.
Optimize when the resource is discovered
To ensure your LCP resource starts loading as early as possible, it's critical that the resource is discoverable in the initial HTML document response by the browser's preload scanner. For example, in the following cases, the browser can discover the LCP resource by scanning the HTML document response:
- The LCP element is an
<img>element, and itssrcorsrcsetattributes are present in the initial HTML markup. - The LCP element requires a CSS background image, but that image is preloaded using
<link rel="preload">in the HTML markup (or using aLinkheader). - The LCP element is a text node that requires a web font to render, and the font is loaded using
<link rel="preload">in the HTML markup (or using aLinkheader).
Here are some examples where the LCP resource cannot be discovered from scanning the HTML document response:
- The LCP element is an
<img>that is dynamically added to the page using JavaScript. - The LCP element is lazily loaded with a JavaScript library that hides its
srcorsrcsetattributes (often asdata-srcordata-srcset). - The LCP element requires a CSS background image.
In each of these cases, the browser needs to run the script or apply the stylesheet—which usually involves waiting for network requests to finish—before it can discover the LCP resource and could start loading it. This is never optimal.
To eliminate unnecessary resource load delay, your LCP resource should be discoverable from the HTML source. In cases where the resource is only referenced from an external CSS or JavaScript file, the LCP resource should be preloaded with a high fetch priority, for example:
<!-- Load the stylesheet that will reference the LCP image. -->
<link rel="stylesheet" href="/path/to/styles.css">

<!-- Preload the LCP image with a high fetchpriority so it starts loading with the stylesheet. -->
<link rel="preload" fetchpriority="high" as="image" href="/path/to/hero-image.webp" type="image/webp">
Optimize the priority the resource is given
Even if the LCP resource is discoverable from the HTML markup, it still may not start loading as early as the first resource. This can happen if the browser preload scanner's priority heuristics don't recognize that the resource is important, or if it determines that other resources are more important.
For example, you can delay your LCP image using HTML if you set loading="lazy" on your <img> element. Using lazy loading means that the resource won't be loaded until after layout confirms the image is in the viewport and so may begin loading later than it otherwise would.
Even without lazy loading, images are not initially loaded with the highest priority by browsers as they are not render-blocking resources. You can hint to the browser as to which resources are most important using the fetchpriority attribute for resources that could benefit from a higher priority:
<img fetchpriority="high" src="/path/to/hero-image.webp">
It's a good idea to set fetchpriority="high" on an <img> element if you think it's likely to be your page's LCP element. However, setting a high priority on more than one or two images makes priority setting unhelpful in reducing LCP.
You can also lower the priority of images that might be early in the document response but aren't visible due to styling, such as images in carousel slides that aren't visible at startup:
<img fetchpriority="low" src="/path/to/carousel-slide-3.webp">
Deprioritizing certain resources can afford more bandwidth to resources that need it more—but be careful. Always check resource priority in DevTools and test changes with lab and field tools.
After you have optimized your LCP resource priority and discovery time, your network waterfall should look like this (with the LCP resource starting at the same time as the first resource):

2. Eliminate element render delay
The goal in this step is to ensure the LCP element can render immediately after its resource has finished loading, no matter when that happens.
The primary reason the LCP element wouldn't be able to render immediately after its resource finishes loading is if rendering is blocked for some other reason:
- Rendering of the entire page is blocked due to stylesheets or synchronous scripts in the
<head>that are still loading. - The LCP resource has finished loading, but the LCP element has not yet been added to the DOM (it's waiting for some JavaScript code to load).
- The element is being hidden by some other code, such as an A/B testing library that's still determining what experiment the user should be in.
- The main thread is blocked due to long tasks, and rendering work needs to wait until those long tasks complete.
The following sections explain how to address the most common causes of unnecessary element render delay.
Reduce or inline render-blocking stylesheets
Style sheets loaded from the HTML markup will block rendering of all content that follows them, which is good, since you generally don't want to render unstyled HTML. However, if the style sheet is so large that it takes significantly longer to load than the LCP resource, then it will prevent the LCP element from rendering—even after its resource has finished loading, as shown in this example:

To fix this, your options are to either:
- inline the style sheet into the HTML to avoid the additional network request; or,
- reduce the size of the style sheet.
In general, inlining your style sheet is only recommended if your style sheet is small since inlined content in the HTML cannot benefit from caching in subsequent page loads. If a style sheet is so large that it takes longer to load than the LCP resource, then it's unlikely to be a good candidate for inlining.
In most cases, the best way to ensure the style sheet does not block rendering of the LCP element is to reduce its size so that it's smaller than the LCP resource. This should ensure it's not a bottleneck for most visits.
Some recommendations to reduce the size of the style sheet are:
- Remove unused CSS: use Chrome DevTools to find CSS rules that aren't being used and can potentially be removed (or deferred).
- Defer non-critical CSS: split your style sheet out into styles that are required for initial page load and then styles that can be loaded lazily.
- Minify and compress CSS: for styles that are critical, make sure you're reducing their transfer size as much as possible.
Defer or inline render-blocking JavaScript
It is almost never necessary to add synchronous scripts (scripts without the async or defer attributes) to the <head> of your pages, and doing so will almost always have a negative impact on performance.
In cases where JavaScript code needs to run as early as possible in the page load, it's best to inline it so rendering isn't delayed waiting on another network request. As with stylesheets, though, you should only inline scripts if they're very small.
<head>
  <script src="/path/to/main.js"></script>
</head>
<head>
  <script>
    // Inline script contents directly in the HTML.
    // IMPORTANT: only do this for very small scripts.
  </script>
</head>
Use server-side rendering
Server-side rendering (SSR) is the process of running your client-side application logic on the server and responding to HTML document requests with the full HTML markup.
From the perspective of optimizing LCP, there are two primary advantage of SSR:
- Your image resources will be discoverable from the HTML source (as discussed in step 1 earlier).
- Your page content won't require additional JavaScript requests to finish before it can render.
The main downside of SSR is it requires additional server processing time, which can slow down your TTFB. This trade-off is usually worth it though because server processing times are within your control, whereas the network and device capabilities of your users are not.
A similar option to SSR is called static site generation (SSG) or prerendering. This is the process of generating your HTML pages in a build step rather than on-demand. If prerendering is possible with your architecture, it's generally a better choice for performance.
Break up long tasks
Even if you've followed the advice from earlier, and your JavaScript code is not render-blocking nor is it responsible for rendering your elements, it can still delay LCP.
The most common reason this happens is when pages load large JavaScript files, which need to be parsed and executed on the browser's main thread. This means that, even if your image resource is fully downloaded, it may still have to wait until an unrelated script finishes executing before it can render.
All browsers today render images on the main thread, which means anything that blocks the main thread can also lead to unnecessary element render delay.
3. Reduce resource load duration
The goal of this step is to reduce the time spent transferring the bytes of the resource over the network to the user's device. In general, there are four ways to do that:
- Reduce the size of the resource.
- Reduce the distance the resource has to travel.
- Reduce contention for network bandwidth.
- Eliminate the network time entirely.
Reduce the size of the resource
The LCP resource of a page (if it has one) will either be an image or a web font. The following guides go into great detail about how to reduce the size of both:
Reduce the distance the resource has to travel
In addition to reducing the size of a resource, you can also reduce the load times by getting your servers as geographically close to your users as possible. And the best way to do that is to use a content delivery network (CDN).
Image CDNs in particular are especially helpful because they not only reduce the distance the resource has to travel, but they also generally reduce the size of the resource—automatically implementing all of the size-reduction recommendations from earlier for you.
Reduce contention for network bandwidth
Even if you've reduced the size of your resource and the distance it has to travel, a resource can still take a long time to load if you're loading many other resources at the same time. This problem is known as network contention.
If you've given your LCP resource a high fetchpriority and started loading it as soon as possible then the browser will do its best to prevent lower-priority resources from competing with it. However, if you're loading many resources with high fetchpriority, or if you're just loading a lot of resources in general, then it could affect how quickly the LCP resource loads.
Eliminate the network time entirely
The best way to reduce resource load duration is to eliminate the network entirely from the process. If you serve your resources with an efficient cache-control policy, then visitors who request those resources a second time will have them served from the cache—bringing the resource load duration to essentially zero!
If your LCP resource is a web font, in addition to reducing web font size, you should also consider whether you need to block rendering on the web font resource load. If you set a font-display value of anything other than auto or block, then text will always be visible during load, and LCP won't be blocked on an additional network request.
Finally, if your LCP resource is small, it may make sense to inline the resources as a data URL, which will also eliminate the additional network request. However, using data URLs comes with caveats because then the resources cannot be cached and in some cases can lead to longer render delays because of the additional decode cost.
4. Reduce time to first byte
The goal of this step is to deliver the initial HTML as quickly as possible. This step is listed last because it's often the one developers have the least control over. However, it's also one of the most important steps because it directly affects every step that comes after it. Nothing can happen on the frontend until the backend delivers that first byte of content, so anything you can do to speed up your TTFB will improve every other load metric as well.
A common cause of a slow TTFB for an otherwise fast site is visitors arriving through multiple redirects, such as from advertisements or shortened links. Always minimize the number of redirects a visitor must wait through.
Another common cause is when cached content cannot be used from a CDN edge server, and all requests must be directed all the way back to the origin server. This can happen if unique URL parameters are used by visitors for analytics—even if they don't result in different pages.
For specific guidance on optimizing TTFB, consult the optimize TTFB guide.
Monitor LCP breakdown in JavaScript
The timing information for all of the LCP subparts discussed earlier is available to you in JavaScript through a combination of the following performance APIs:
Many RUM products already calculate the subparts using these APIs. The web-vitals library also includes these LCP subpart timings in the attribution build and its code can be referenced for how to calculate these in JavaScript.
Chrome DevTools, and Lighthouse also measures these subparts as shown in the previous screenshots, saving you the need to calculate them manually in JavaScript when using those tools.
Summary
LCP is complex, and its timing can be affected by a number of factors. But if you consider that optimizing LCP is primarily about optimizing the load of the LCP resource, it can significantly simplify things.
At a high level, optimizing LCP can be summarized in four steps:
- Ensure the LCP resource starts loading as early as possible.
- Ensure the LCP element can render as soon as its resource finishes loading.
- Reduce the load time of the LCP resource as much as you can without sacrificing quality.
- Deliver the initial HTML document as fast as possible.
If you're able to follow these steps on your pages, then you should feel confident that you're delivering an optimal loading experience to your users, and you should see that reflected in your real-world LCP scores.